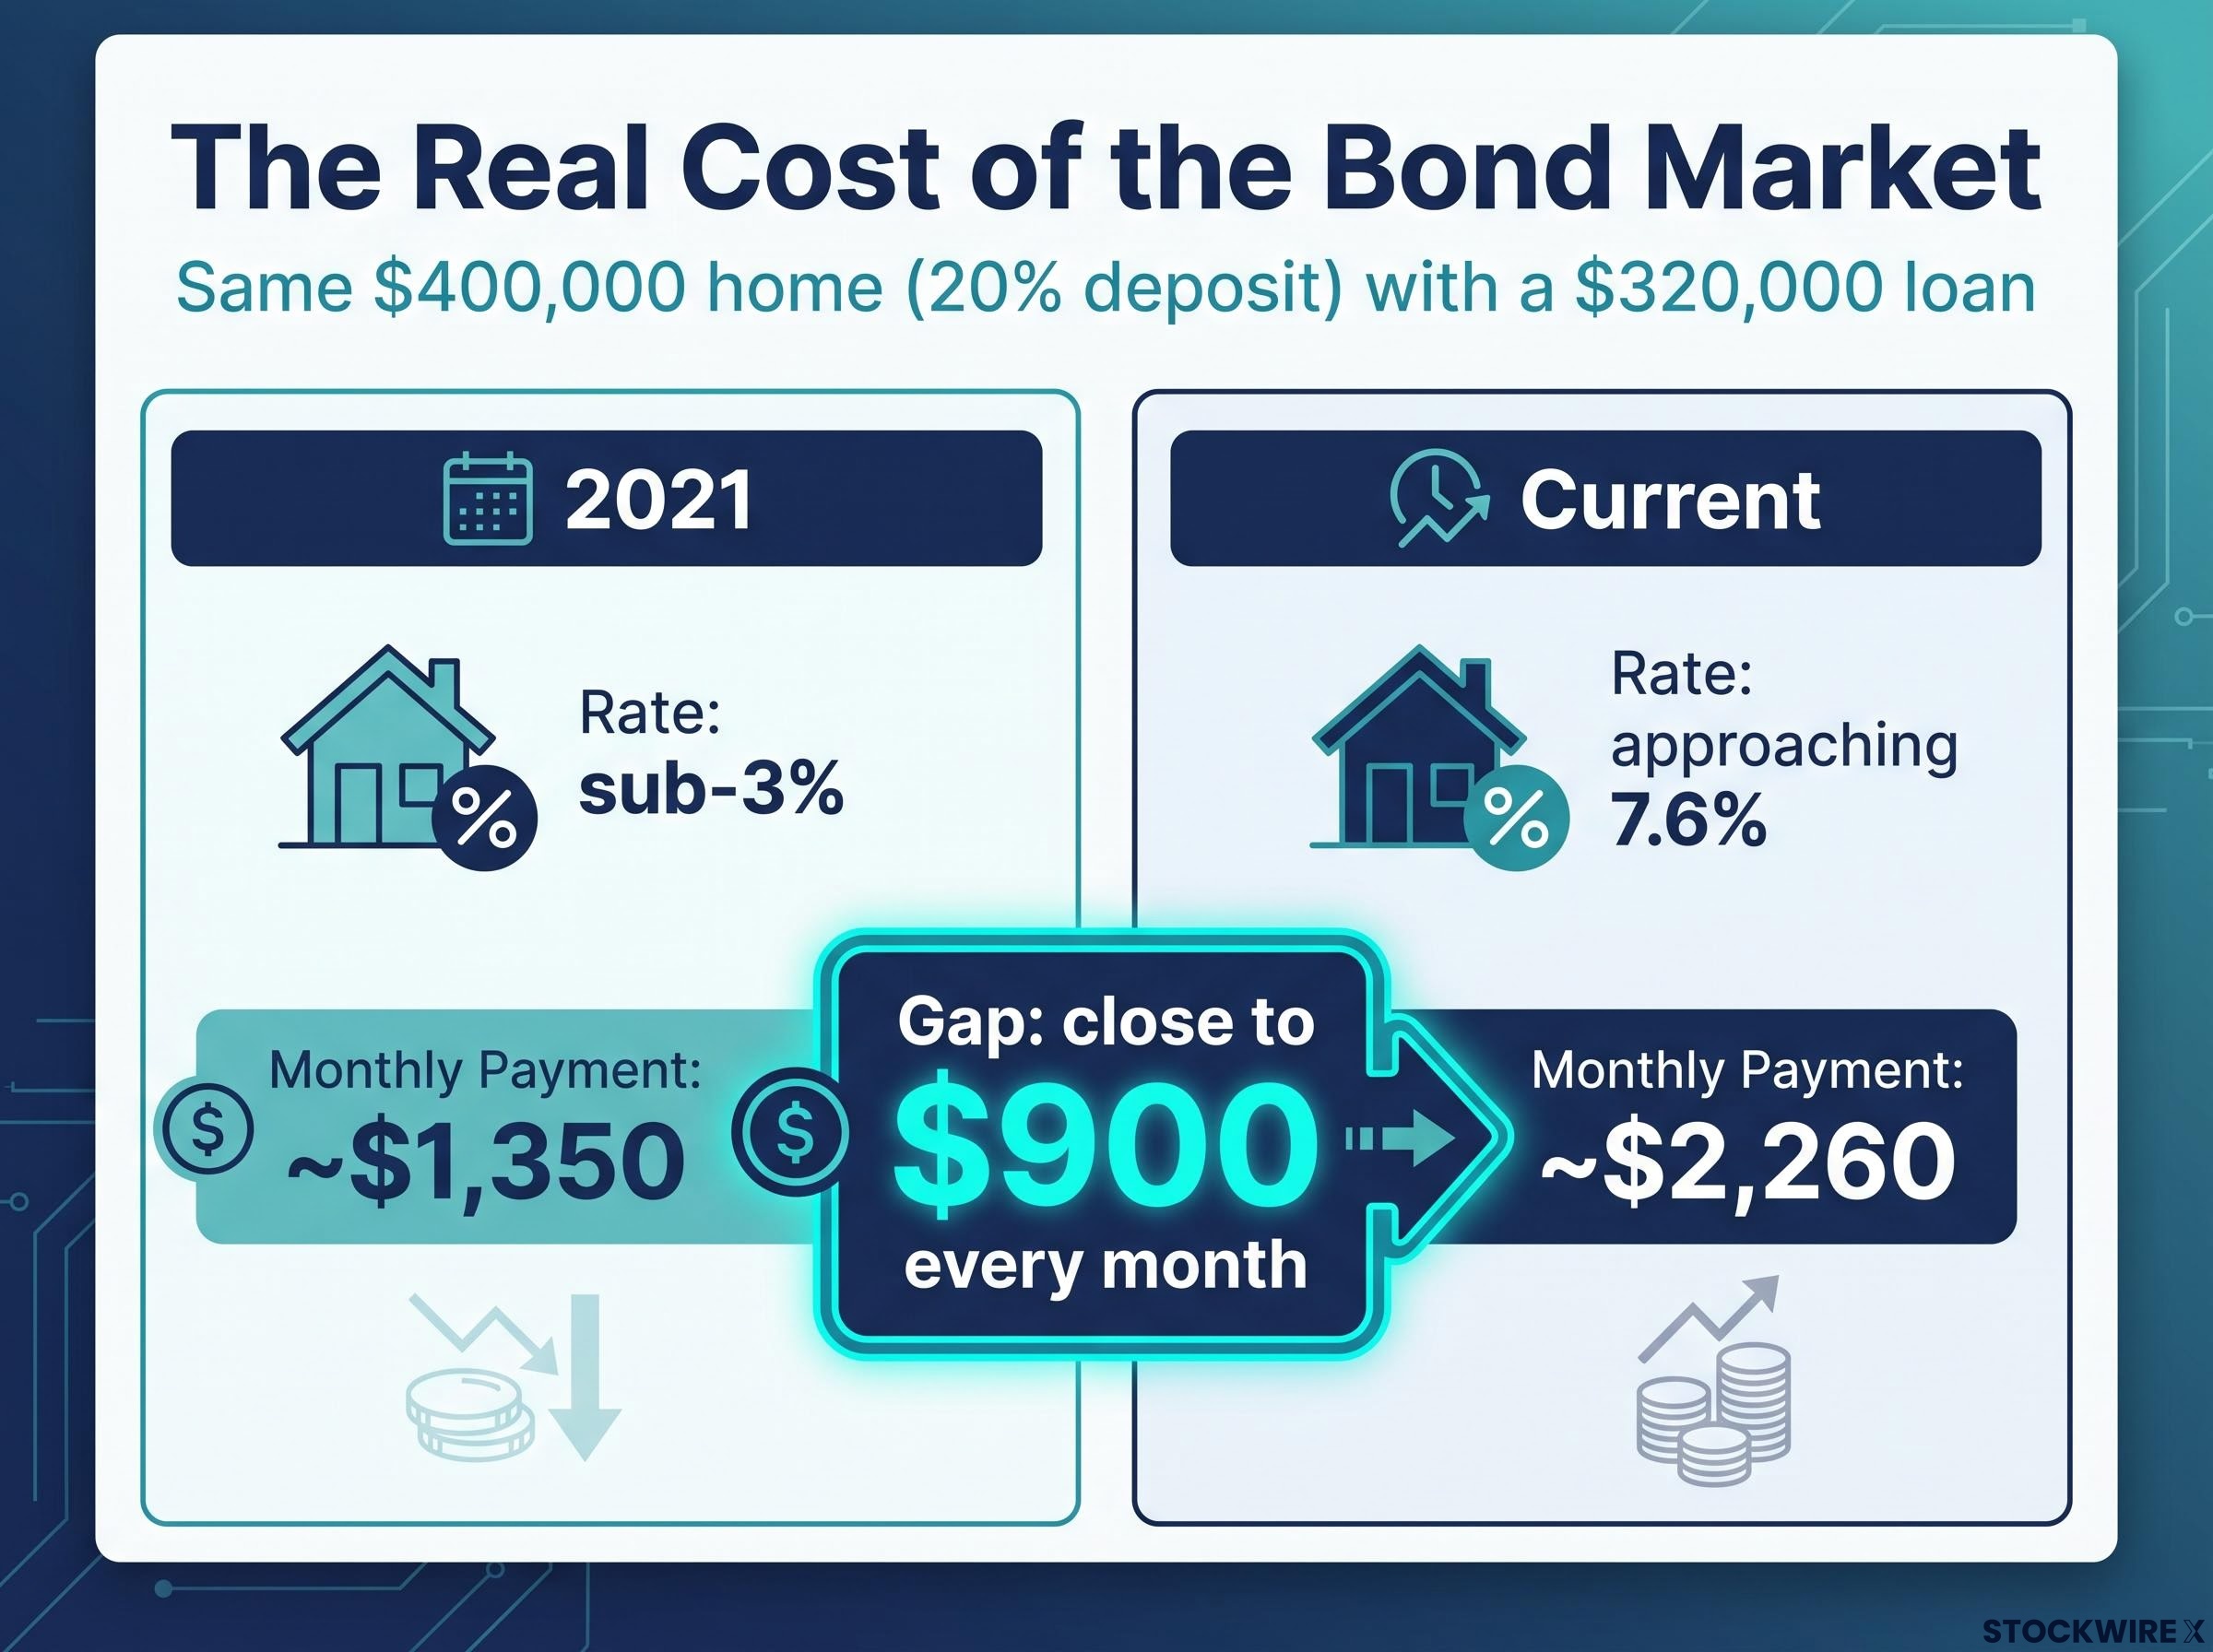
If you bought a $400,000 home today with a 20% deposit, financing $320,000 at the current 30-year fixed rate approaching 7.6%, your monthly principal and interest payment lands around $2,260. The same loan at the sub-3% rates available in 2021 would have cost roughly $1,350 a month. That gap, close to $900 every month, is not a Federal Reserve decision. It is the long end of the bond market pressing on your rate sheet.
The mechanism behind that number sits in the 10-year and 30-year Treasury yields, and what is happening there is not a passing policy artefact. It is a convergence of structural forces that predate any single Fed meeting and look set to outlast the next one.
Understanding why long-end yields are climbing gives you a working mental model of the four to five forces actually driving borrowing costs. Once you have it, you can read any headline about bond yields, mortgage rates, or Treasury auctions through your own framework, instead of waiting for someone on television to interpret it for you. This maps the machinery behind the number on your rate sheet.
The signal hiding in plain sight: what the 30-year mortgage rate is actually telling you
Here is the assumption most borrowers carry: mortgage rates are high because the Fed has not cut enough, and once it does, your rate will fall. That intuition is wrong in a way that matters for your financial decisions.
Mortgage rates are not priced off the federal funds rate. They track the 10-year and 30-year Treasury yields. The 30-year fixed mortgage typically sits above the 30-year Treasury yield, so when the long end of the curve is elevated, your borrowing cost is elevated too, regardless of what the Fed does with short-term policy.
Bond yield mechanics sit underneath every figure on a lender’s rate sheet: because the coupon is fixed at issuance, any fall in a bond’s price automatically lifts its yield, and any rise in price compresses it, which is why Treasury selloffs translate directly into higher borrowing costs for homebuyers.
That distinction explains the September 2026 trajectory. According to Freddie Mac’s Primary Mortgage Market Survey, the 30-year fixed rate climbed steadily through the month.
| Survey Date | Source | 30-Year Rate |
|---|---|---|
| 10 September 2026 | Freddie Mac PMMS | 6.76% |
| 17 September 2026 | Freddie Mac PMMS | 6.95% |
| 24 September 2026 | Freddie Mac PMMS | 7.03% |
The daily read ran hotter still.
Mortgage News Daily, 29 September 2026: 30-year fixed rate at 7.58%, consistent with a rate approaching 7.6% in real time.
None of that move was driven by near-term Fed posture. It was driven by long-end dynamics, the same forces pushing Treasury yields up at the far end of the curve.
That tells you something you can act on. If your borrowing cost problem is structural rather than policy-driven, then waiting for a Fed pivot to fix it may be waiting for the wrong mechanism entirely. The rest of this explains what the real one is.
When big ASX news breaks, our subscribers know first
Five forces converging on the long end at once
The temptation is to hunt for the single cause. There is not one. There are five, and they are genuinely distinct mechanisms rather than variations on the same theme.
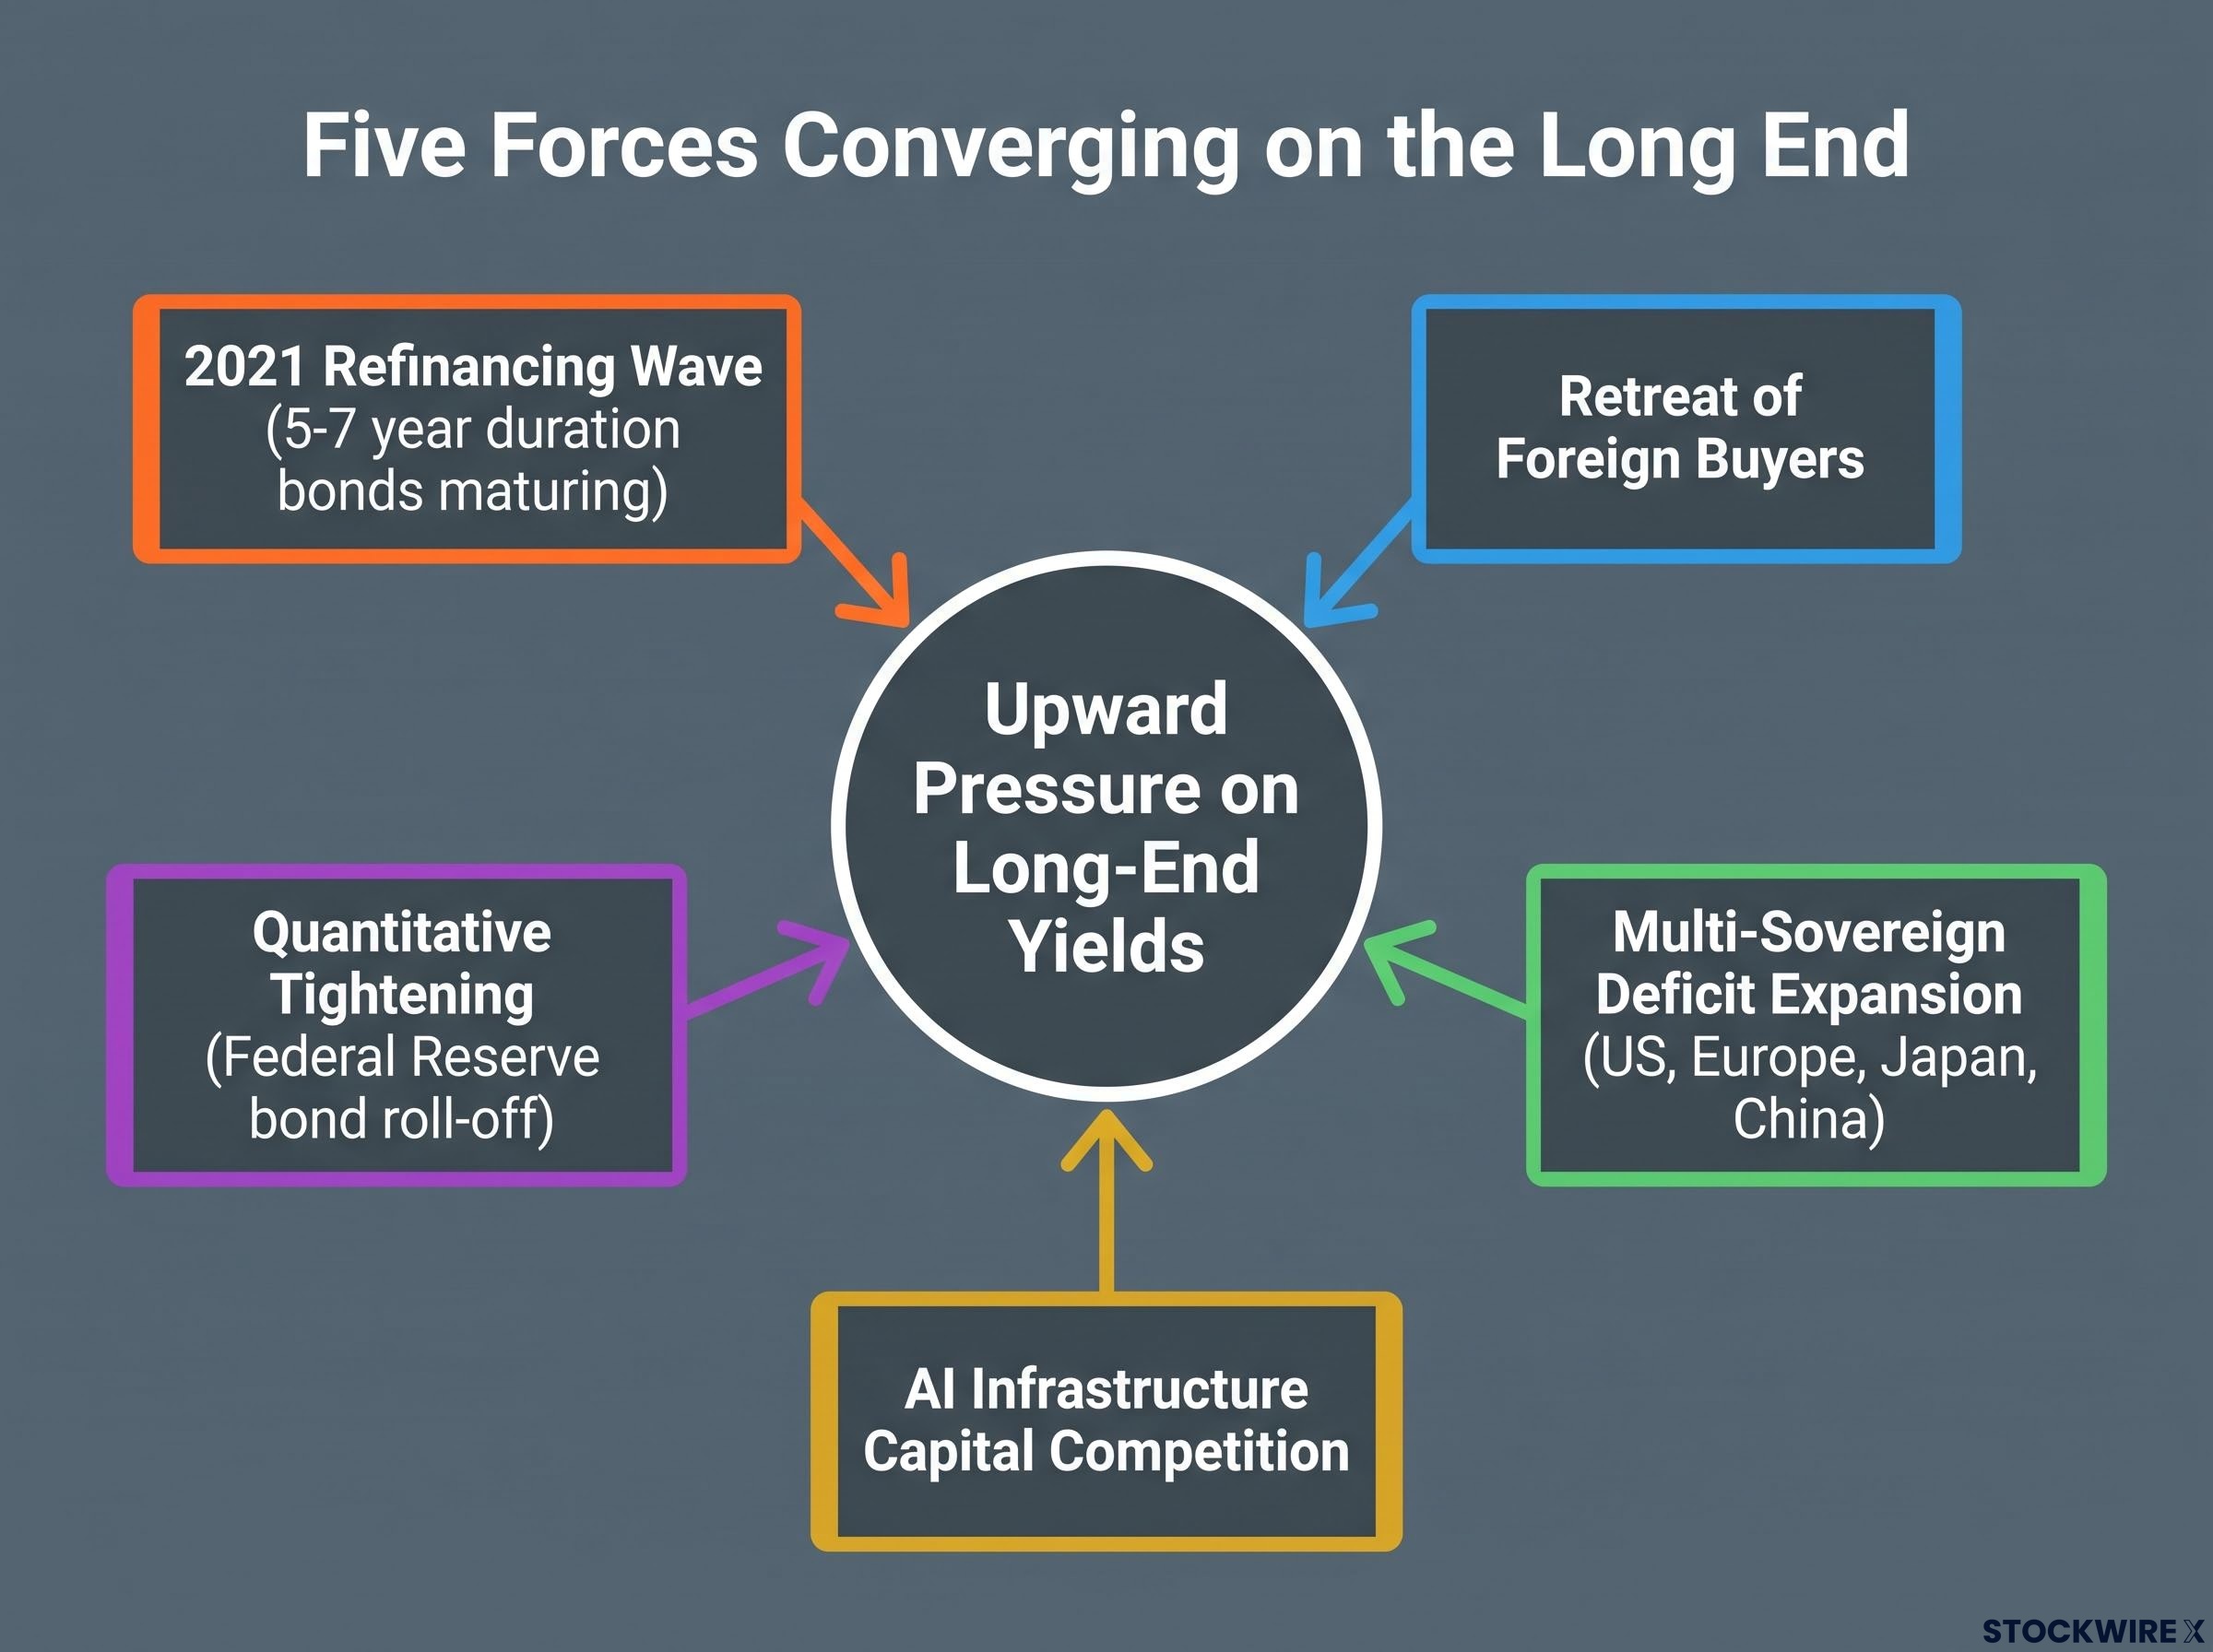
- The 2021 refinancing wave: Bonds issued at near-zero rates in 2021, given typical durations of five to seven years, are now maturing and must be refinanced at today’s far higher rates.
- The retreat of foreign buyers: Overseas purchasers of US debt, especially outside the US, are stepping back from the long end.
- Multi-sovereign deficit expansion: The US, Europe, Japan, and China are all running large deficits at the same time, flooding the global market with government paper.
- AI infrastructure capital competition: The artificial intelligence capital expenditure boom is drawing on the same pool of loanable funds that government borrowing needs.
- Quantitative tightening: The Federal Reserve, through quantitative tightening (letting bonds roll off its balance sheet), has removed itself as a large, price-insensitive buyer.
Start with the refinancing wave, because it is the least discussed. Debt raised when money was nearly free is now competing for capital across corporate, sovereign, private credit, and real estate markets simultaneously. This is not a government problem alone; it is a broad, cross-asset scramble for refinancing capital that did not exist at this scale two years ago.
Layer AI capital demand on top. According to macro strategist commentary, the AI infrastructure boom competes directly with government borrowing for the same limited funds, and it operates on the global pool, not just the US domestic market. That is why this is a real interest rate story as much as a deficit story: more claims on capital, at the margin, mean a higher price for that capital.
Multi-sovereign deficit expansion is not evenly distributed: the US federal deficit is projected at $1.9 trillion for FY2026 while technology hyperscalers plan $4.1 trillion in AI capital expenditure over the next decade, meaning the competition for loanable funds runs across both public borrowing and private infrastructure investment simultaneously.
The demand side collapses simultaneously
Now the supply pressure meets a shrinking buyer base. Foreign buyer retreat runs broader than Japan alone: reserve managers and sovereign wealth funds across multiple geographies have been trimming their US duration exposure.
The timing is the problem. Historically, surplus countries absorbed US Treasury supply when issuance surged. That safety valve has weakened precisely because those same countries are now running their own large deficits and issuing their own paper.
Here is the analytical leap that separates a sophisticated reader from someone waiting for the “real” cause. These forces are additive and independent. Even a balanced US budget, achieved overnight, would leave the refinancing wave, the foreign retreat, the AI capital competition, and quantitative tightening fully in place. Fixing one does not reverse the pressure.
What term premium actually is, and why it explains more than rate expectations do
You probably think bond yields reflect two things: expected inflation and expected growth. That is true, but there is a layer underneath doing more work right now, and once you can see it, you have a sharper instrument for reading the market.
That layer is the term premium.
The ACM model estimates the US 10-year term premium at 70-80 basis points in mid-to-late 2026, a swing of roughly 220 basis points from negative territory in early 2020, which quantifies precisely how much of the current yield rise reflects investors demanding compensation for duration uncertainty rather than pricing in higher future inflation.
Term premium is the extra yield investors demand to hold a long-dated bond rather than simply rolling over a series of short-term instruments. It is compensation for the uncertainty of committing capital for decades: uncertainty about future rates, inflation, and which policy regime governs the years ahead.
The reason this matters is historical. The 2010s were structurally abnormal. Global savings gluts, aggressive quantitative easing, and yield-curve control at the Bank of Japan suppressed term premium across developed markets, keeping long-end yields low even as debt levels climbed. Part of today’s rise is that term premium returning to more normal positive territory, a normalisation rather than a fresh crisis.
The diagnostic detail is where this gets useful. The current rise shows up primarily in real yields and term premium, not in breakeven inflation (the market’s implied inflation expectation).
| What the yield rise looks like | What is actually driving it |
|---|---|
| Inflation breakevens relatively stable | Real yields and term premium rising |
| Headline “rates are up” narrative | Supply pressure and regime uncertainty being priced |
Fixed-income strategists at Goldman Sachs, JPMorgan, and Bank of America broadly agree that supply, inflation risk, and term premium normalisation are all contributing, with an open debate over which dominates. A structural amplifier sits underneath: supplemental leverage ratio (SLR) rules, which govern how much low-risk debt a dealer can hold against its capital, limit how much long-duration paper dealers can warehouse.
Here is what that means for you. If most of the yield rise is term premium and real yield normalisation rather than inflation panic, you should expect yields to stay elevated even as inflation data cools. Falling inflation and stubbornly high bond yields is not a paradox. It is the term premium doing the work.
Japan’s $71 billion reversal and what it reveals about the system’s fragility
Japan is the variable most readers are not watching, and it is the single most concentrated swing factor in global long-end duration. The speed of its recent reversal tells the story without any need to dramatise it.
Japanese pension funds and life insurers hold enormous portfolios of foreign bonds to supplement low domestic yields. Their long-dated liabilities, annuity and insurance obligations stretching decades, push them toward long-duration assets, which gives their allocation decisions outsized weight on the far end of foreign curves.
The swing factor is currency hedging. These institutions typically hedge their dollar exposure back into yen. When hedging costs rise, driven by the gap between US and Japanese short-term rates, the all-in hedged yield on a US Treasury can fall below what a domestic Japanese government bond pays, wiping out the reason to hold US duration at all.
The Bank of Japan’s gradual loosening of yield-curve control since 2022 changed this calculus. As domestic Japanese yields were allowed to rise, JGBs became progressively more competitive, giving these institutions a reason to bring capital home.
CFR analysis of Japanese foreign bond demand following the end of yield-curve control shows that the policy shift gave Japanese institutions a structural reason to reassess their foreign duration exposure, setting the conditions for the repatriation flows that accelerated through 2026.
The flow data captures the turn. According to Japan’s Ministry of Finance, via Reuters, Japanese investors bought a net 13.59 trillion yen of foreign bonds across full-year 2025, more than three times the 4.16 trillion yen of 2024. From January to November 2025, US bonds absorbed 10.6 trillion yen and European debt 2.74 trillion yen. Then December 2025 flipped to net selling of 374.2 billion yen.
The acceleration in 2026: From roughly $18.1 billion in withdrawals through 22 August, Japanese outflows surged to $71 billion by 22 September, concentrated in off-the-run securities.
That concentration is the tell. Off-the-run securities are older, less liquid Treasuries, and selling into that thin part of the market creates price impact far larger than the notional size suggests. Scott Bessent has been referenced on the asymmetric information problem around these off-the-run issues. In plain terms: when Japanese institutions repatriate, they move fast, at scale, and through the least liquid door.
For monitoring purposes, the signal splits cleanly.
- Selling likely continues if: the Bank of Japan lets domestic yields rise further, dollar and euro hedging costs stay elevated, or capital rules make foreign holdings more burdensome for Japanese balance sheets.
- Buying likely returns if: US and European long-end yields rise relative to JGBs while hedging costs fall, boosting the hedged all-in yield.
- Buying also returns if: a global risk-off event sends Japanese investors back toward liquid foreign sovereigns as safe havens.
Watching those conditions gives you a more forward-looking read on global bond stress than US economic data alone provides.
Why Treasury’s toolkit has not stopped the pressure, and what could change the equation
The US Treasury has not been passive. Its response is worth reading not as reassurance but as a measure of how seriously the structural problem is being taken.
Four interventions stand out, according to strategist commentary citing Jim Carson of Kai Volatility:
- SLR rule changes: Modifications to the supplemental leverage ratio at the start of the year, aimed at freeing up dealer capacity to hold Treasuries.
- The stablecoin act: Legislation with implications for demand for short-duration Treasuries held as stablecoin reserves.
- Buyback operations: Treasury purchases of older, off-the-run securities to improve liquidity.
- Box ETF regulatory scrutiny: Pressure on a tax-efficient arbitrage product, read as an indirect push to redirect capital back toward Treasuries.
Each tries to do one of two things: expand dealer capacity or channel existing capital toward government paper. Be honest about what they are, though. These are at-the-margin measures against a structural supply-demand imbalance. None of them touch the underlying fiscal arithmetic.
The counter-arguments to the structurally-higher-yields thesis deserve equal weight. A US recession would trigger a flight-to-safety rally into Treasuries that could dwarf any structural force; 2008 and 2020 both saw long-end yields collapse despite heavy issuance. Central banks retain the tools, outright purchases and yield-curve control, to reset equilibrium yields fast, as the Bank of England demonstrated during the 2022 UK gilt crisis. Foreign demand is price-sensitive: high enough absolute yields attract buyers back. And secular stagnation forces, ageing populations and elevated savings, have not been conclusively defeated.
| Conditions favouring continued yield pressure | Conditions favouring a yield reversal |
|---|---|
| Persistent multi-sovereign deficits and heavy issuance | US or global recession driving flight to safety |
| Continued quantitative tightening | Renewed central-bank asset purchases or yield-curve control |
| Japanese repatriation and foreign buyer retreat | High absolute yields pulling foreign buyers back |
| AI capital demand crowding out government borrowing | Secular stagnation forces reasserting downward pressure |
The takeaway is balanced, not comforting. The existence of an active policy response tells you the pressure is real enough to require management. The limited effect so far tells you the forces are larger than any toolkit built to work at the margin.
For readers wanting to pressure-test the structural argument against the counter-case, our full explainer on yield normalisation versus crisis examines historical pre-QE yield ranges and current auction bid-to-cover data to assess whether today’s levels represent a regime shift or a reversion to pre-2008 norms.
Monitoring the long end without getting lost in the noise
You now understand the mechanism, not just the symptom. That is the only durable way to read a bond market that moves on forces most commentary never surfaces. The final step is turning that understanding into a short watchlist.
Five variables carry most of the signal.
- Japanese capital flow reports: Ministry of Finance data, released weekly, shows whether Japanese institutions are net buyers or sellers of foreign bonds.
- Treasury auction health: Bid-to-cover ratios and foreign central bank participation reveal whether demand is keeping pace with supply.
- Bank of Japan policy statements: Each adjustment to yield-curve control can accelerate or reverse Japanese repatriation.
- Real yields versus breakeven inflation: Rising real yields with stable breakevens signals term premium and supply pressure; rising breakevens signals an inflation narrative taking hold, which calls for different positioning.
- The 30-year mortgage rate itself: Moving from 6.76% to 7.58% across three weeks of September 2026, it is a live gauge. When it climbs faster than Fed decisions would imply, long-end structural pressure is intensifying.
What to watch at the global capital flow level
The Ministry of Finance weekly cadence is your fastest read on Japan. A sustained run of net selling figures signals repatriation is entrenching rather than pausing.
Track the Bank of Japan meeting calendar alongside it. Each statement on yield-curve control is a potential trigger, either accelerating Japanese selling or, if the tone shifts, opening the door for capital to return.
The next time a bond market headline crosses your feed, you have three or four specific data points to check before deciding whether the move is structural and worth your attention, or noise and worth nothing.
This article is for informational purposes only and should not be considered financial advice. Investors should conduct their own research and consult with financial professionals before making investment decisions.
Past performance does not guarantee future results, and the forward-looking scenarios described here are speculative and subject to change based on market developments and policy decisions.