Gold sits near $4,182 per ounce at the end of September 2026, well below its recent highs, and the asset millions of Americans buy specifically to protect themselves from inflation is being pinned down by inflation itself.
That is the paradox worth sitting with. The hedge is being hurt by the very thing it is supposed to guard against, and a clean recovery in XAU/USD has stubbornly refused to appear.
The pressure is not random. Three forces are working in the same direction at once: WTI crude near $89 per barrel and Brent in the $95-105 range are keeping inflation above the Fed’s 2% target; July 2026 core PCE at 3.3% year-over-year confirms underlying price pressures have not cooled to target; and the 10-year Treasury yield at 5.24% signals markets expect the Fed to stay restrictive.
Think of this as a system rather than a list of separate headwinds. Each force feeds the next.
Here is the framework for understanding why these three pressures operate together instead of independently, what upcoming data could shift the picture, and how to think about gold’s positioning in a portfolio built for this specific macro environment. The goal is analytical leverage, not a summary of where prices have been.
Why oil prices are doing the Fed’s dirty work against gold
Start with the least obvious link in the chain: oil is not merely an inflation ingredient. It is an active suppressant of gold, and once you trace the mechanism, the connection stops feeling strange and starts feeling almost mechanical.
WTI trading near $89 per barrel and Brent in the $95-105 range in late September 2026 are running above the trajectory J.P. Morgan mapped out in July. The bank’s forecast projected Brent at $86 in Q3 2026 and $80 in Q4 2026, on the assumption that inventory drawdowns would soften and demand would normalise. Spot prices are outrunning that path.
J.P. Morgan’s Brent crude forecasts, which projected $86 per barrel in Q3 2026 and $80 in Q4 2026, were constructed on assumptions of softening inventory drawdowns and normalising demand; spot prices running $10-20 above those levels signal a materially more stubborn inflation problem than the bank’s base case anticipated.
That gap matters more than it looks. When oil outpaces the forecasts of the very analysts who model it, the read for you is that the inflation problem is more stubborn than the market believed as recently as two months ago, and any mental timeline you held for a Fed pivot should be pushed further out.
The transmission works in three steps:
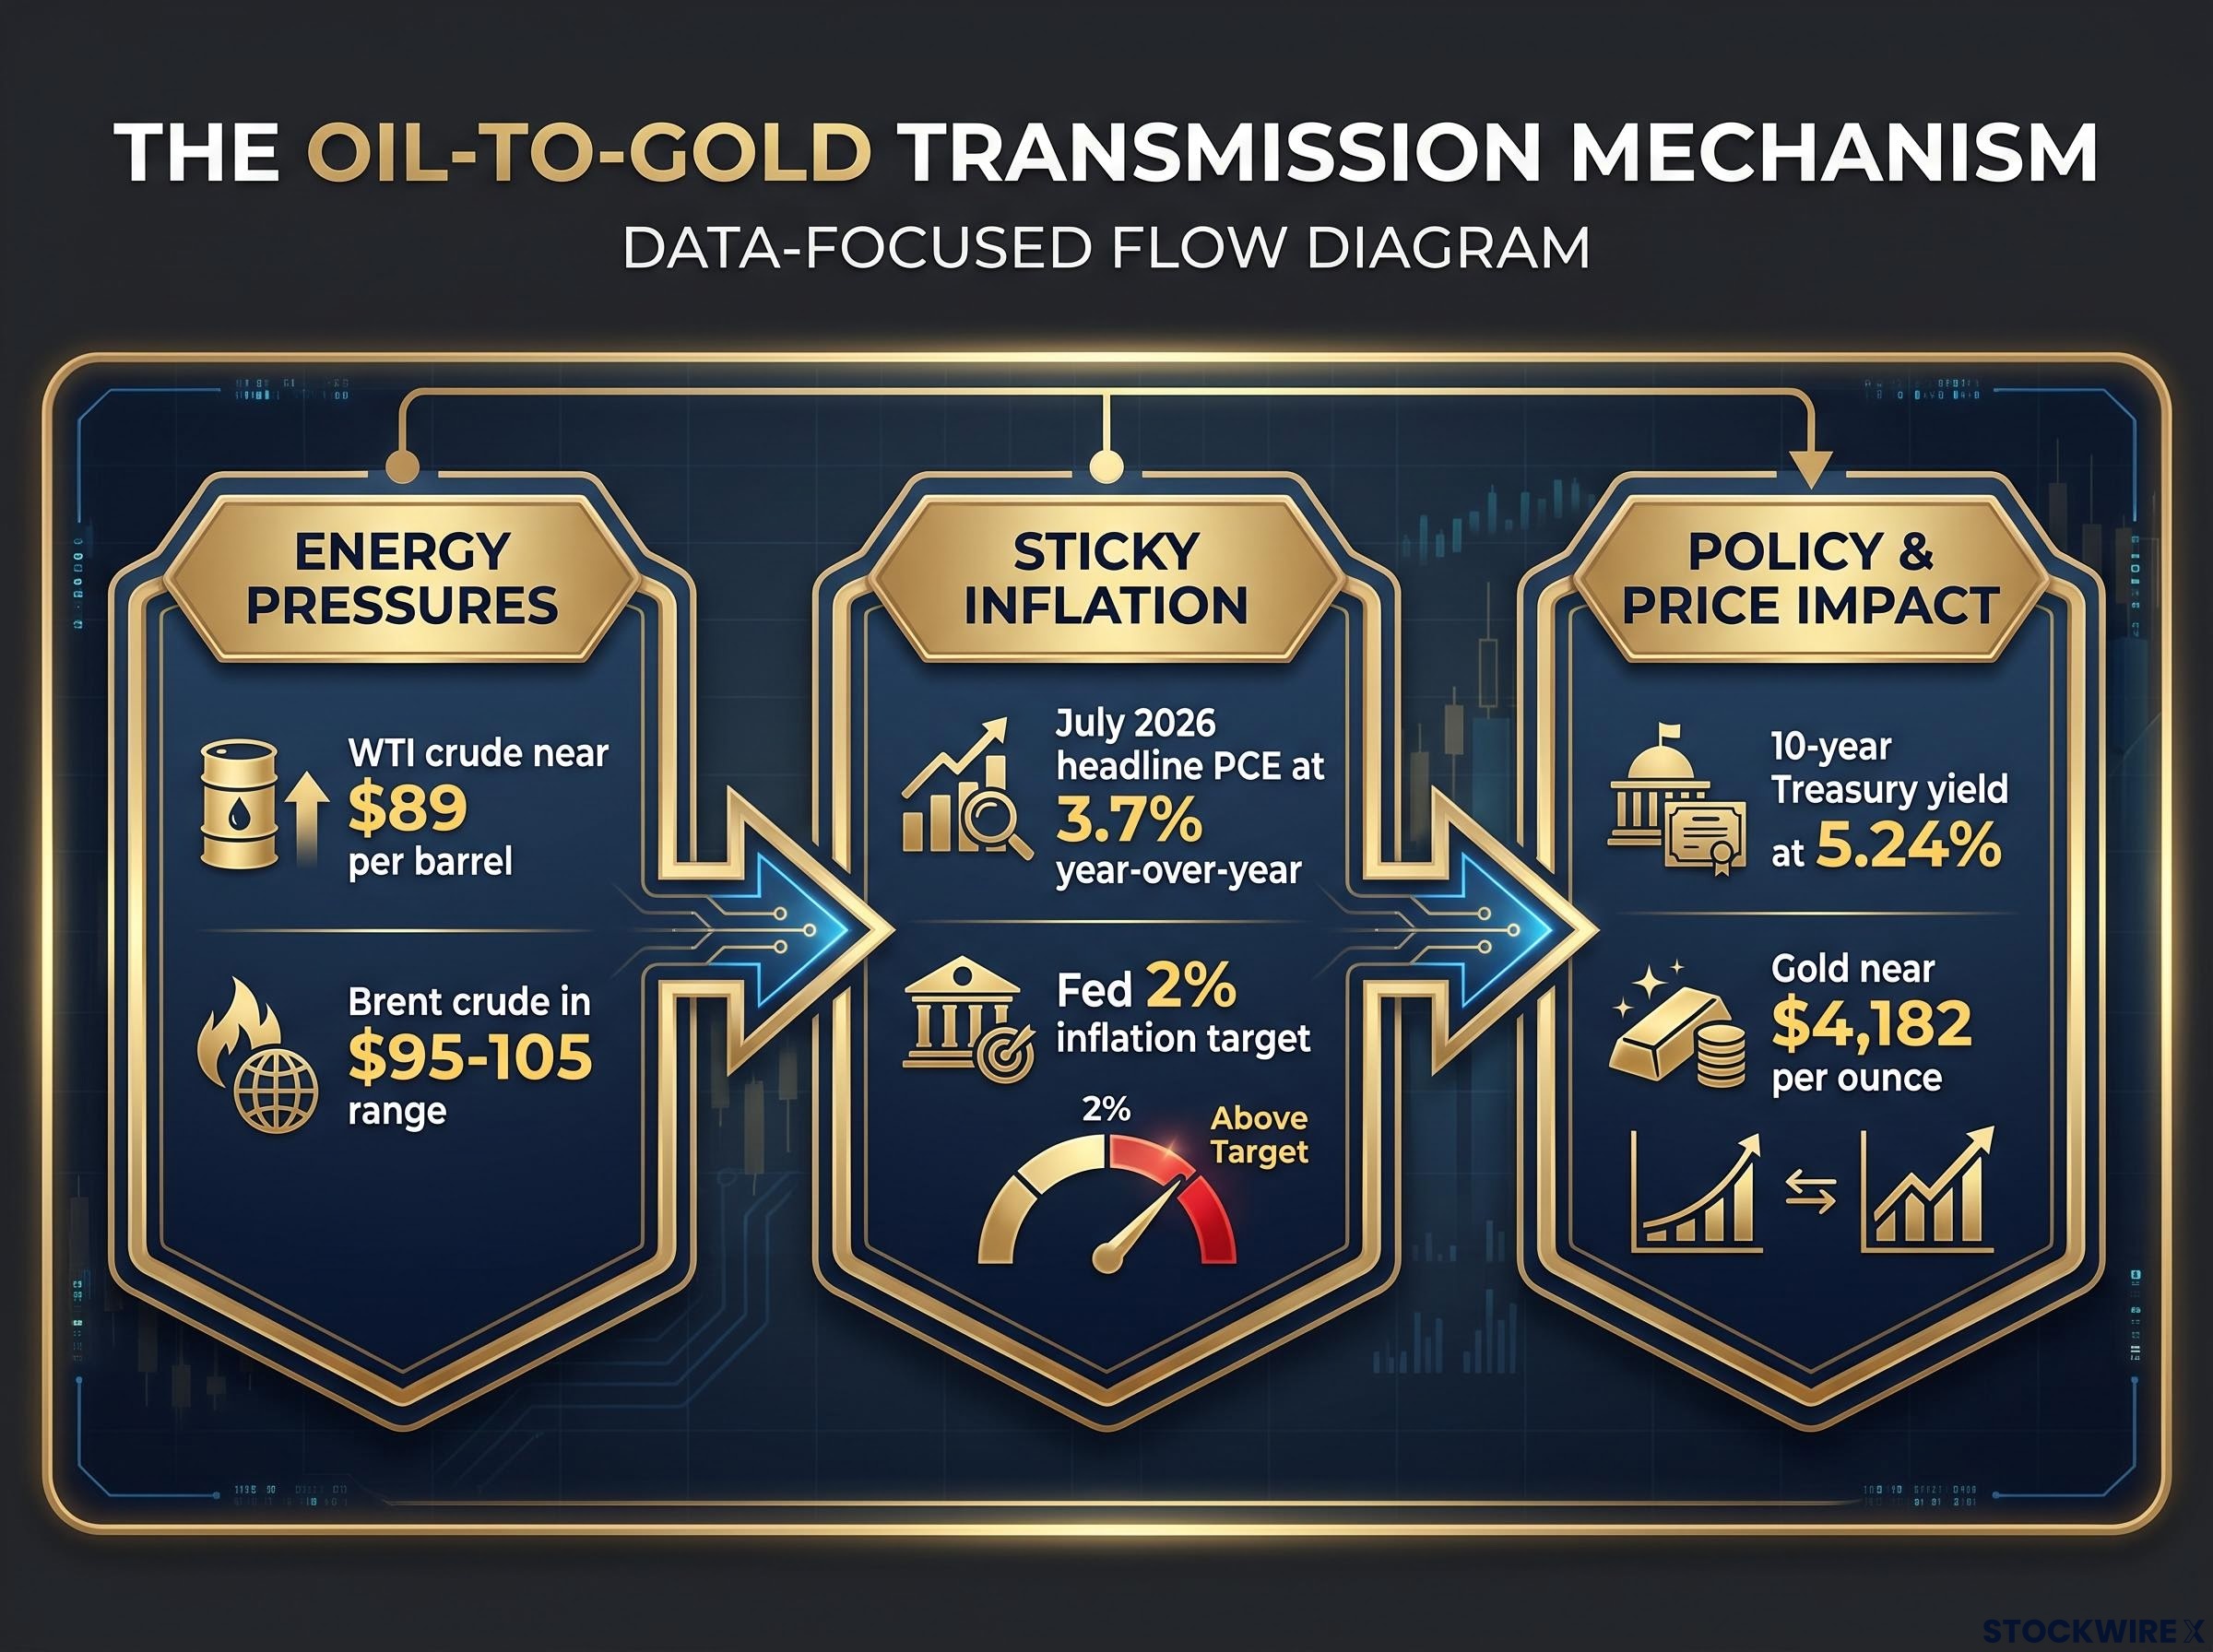
- Oil prices rise, feeding directly into headline PCE, the Fed’s preferred inflation gauge.
- Elevated energy costs keep PCE high or slow its descent toward 2%.
- With inflation sticky, the Fed has reason to hold policy restrictive even when other components are cooling.
| Benchmark | Current Level | J.P. Morgan Q3 2026 Forecast | J.P. Morgan Q4 2026 Forecast |
|---|---|---|---|
| WTI crude | ~$88.7-89.2/bbl | Not specified | Not specified |
| Brent crude | ~$95-105/bbl | $86/bbl | $80/bbl |
The Fed watches PCE closely, and PCE is acutely sensitive to energy-driven components. That makes oil less a background variable and more a signal the central bank reads directly when deciding whether to hold, hike, or ease. July 2026 headline PCE landed at 3.7% year-over-year, a figure elevated energy prices helped keep high.
Luis Oganes, J.P. Morgan Head of Global Macro Research Oganes has pointed to a “reflationary backdrop” with “heightened risks from US rates repricing,” emphasising that oil and inflation dynamics are holding market focus on rates rather than on traditional inflation hedges like gold.
Skip this link and you will misread gold’s weakness as a buying signal. It is closer to a policy signal.
The same three-way system of gold price factors — oil inflation expectations, real yield suppression, and Fed policy posture — drove the metal’s 64% surge in 2025, which makes the current configuration’s reversal of each variable all the more instructive for readers calibrating their timing.
When big ASX news breaks, our subscribers know first
What the inflation and jobs data are actually telling you
Read the numbers like a detective and a picture forms: an economy cooling, but not cool enough to give the Fed the cover it needs to ease.
July 2026 core PCE came in at 3.3% year-over-year, with headline PCE at 3.7% year-over-year. Both sit well above the 2% target. Supplementary gauges tell the same story: the Dallas Fed’s trimmed-mean PCE and the Cleveland Fed’s median PCE both confirm inflation is moderating but has not returned to target.
The PCE breadth gauges that matter most to the Fed — the Dallas trimmed mean and the Cleveland median — were both approaching target faster than the headline core figure, serving as the Fed’s primary test of whether disinflation is broad-based rather than concentrated in volatile categories.
The benchmark that matters Every PCE reading should be measured against the Federal Reserve’s official 2% inflation target. At 3.3% core, the gap is still wide enough to keep policy restrictive.
The most recent inflation reading offers a thin sliver of hope. August 2026 headline PCE reportedly rose 0.2% month-on-month, down from a previously reported 0.4% and softer than the 0.3% consensus (this figure is unverified at the time of writing). A softer-than-expected print is one of the few near-term catalysts that could nudge rate expectations and give gold a foothold.
| Indicator | Reading | Period | Implication for Fed |
|---|---|---|---|
| Core PCE (YoY) | 3.3% | July 2026 | Above target, keeps policy tight |
| Headline PCE (YoY) | 3.7% | July 2026 | Energy pressure visible, tight bias |
| Nonfarm payrolls | +31,000 | June 2026 | Softening, dovish-leaning |
| Nonfarm payrolls | +21,000 | July 2026 | Near-stagnant, dovish-leaning |
| Nonfarm payrolls | +162,000 | August 2026 | Rebound, removes easing excuse |
Reading the NFP rebound in context
The labour data complicates the easing narrative. After June’s +31,000 and July’s +21,000, two months of near-stagnant hiring, August 2026 delivered +162,000 jobs. On its own, that jump looks like renewed strength.
It should be read against the two soft prints that preceded it, not in isolation. One month does not reverse a trend, but it can shift short-term rate expectations enough to move gold meaningfully in either direction.
For gold bulls, this is the number to watch most carefully. A resilient labour market strips the Fed of its most politically acceptable reason to ease, and that keeps the pressure on XAU/USD regardless of what happens at the inflation margin.
The mechanism: why a strong dollar and high real yields are gold’s actual problem
Here is where the mental model needs an upgrade. Most people file gold under “inflation hedge.” The more accurate filing is “real yield and dollar instrument,” and once you make that swap, gold’s behaviour stops being confusing.
Gold generates no yield. That single fact drives everything that follows through three channels:
- Real yields: When inflation-adjusted returns on Treasuries rise, non-yielding gold looks relatively worse.
- The dollar: A hawkish Fed strengthens the dollar, and gold is priced in dollars.
- Opportunity cost: Holding gold means forgoing the return you could earn elsewhere.
Take the real yields channel first. A real yield is the return on a bond after subtracting inflation. When the Fed holds rates high while inflation moderates, nominal yields stay elevated and real yields climb. Against a 10-year Treasury yield of 5.24% and a 30-year near 5.49-5.50%, gold has to justify holding an asset that pays nothing.
That 5.24% figure is not just a data point for you. It is the hurdle rate your gold allocation must clear on diversification and protection value, and right now that hurdle is historically high.
Gregory Shearer, J.P. Morgan Head of Base and Precious Metals Strategy Shearer argues that “the increasing specter of Fed rate hikes has turned a pause into a deeper freeze for precious metals prices for now,” citing a “very large lack of engagement” from investors while rate-hike risk hangs over the market.
The dollar channel and what it means for XAU/USD pricing
Gold’s price in dollars reflects two things at once: demand for the metal itself, and the purchasing power of the dollar it is quoted in.
When the Fed holds or signals higher rates, capital flows toward dollar-denominated assets and the dollar strengthens. Because gold is priced in dollars, a stronger dollar means each ounce costs fewer of them on global markets, mechanically dragging XAU/USD lower.
The key implication is that gold can fall in dollar terms even if global demand for the metal has not changed at all. The currency simply got stronger underneath it.
Now the paradox from the opening resolves cleanly. Oil-driven inflation does not trigger a gold-hedge bid, because the same inflation triggers a Fed response that lifts both real yields and the dollar. Two negative channels fire at once, which is why inflation is hurting the very asset built to hedge it.
A structural break in the gold-yield relationship has been accumulating since approximately 2022-2023, driven by central-bank gold accumulation running near 1,000 tonnes annually and growing institutional doubt about long-run US fiscal credibility — which is why the classic inverse correlation has produced anomalous readings at certain points in the current cycle.
That reframe changes the question you should be asking. Stop asking why gold is not rising with inflation. Start asking what would have to happen to real yields and the dollar for gold to recover.
What history says about gold’s timing problem in tightening cycles
History does not predict the next move, but it does calibrate expectations. Past tightening cycles suggest how long these pressure phases tend to last and what the eventual turn has looked like.
- 1970s to early 1980s, the Volcker tightening. Gold surged early as inflation expectations spiked, then corrected sharply once the Fed tightened decisively and real rates rose, before recovering as the cycle matured and inflation fell.
- 2004 to 2006, mid-cycle tightening. Gold consolidated and pulled back when rate expectations and the dollar firmed, then advanced again as markets began pricing the end of hikes. It performed best late in the cycle, not during peak rate anxiety.
- 2013 to 2015, the taper period. Gold struggled through policy-transition uncertainty as the Fed signalled tapering, finding durable support only once the tightening path was clear.
The consistent lesson is that gold’s recovery lags the peak in real yields and the dollar, not the peak in inflation. Today’s setup, PCE above target, trimmed-mean and median measures still elevated, and strategists flagging US rate-repricing risk, resembles those earlier phases when gold’s upside stayed constrained.
| Condition | J.P. Morgan Requirement | Current Data Status | Assessment |
|---|---|---|---|
| Inflation | PCE moderating convincingly toward 2% | Core PCE 3.3% YoY | Not yet met |
| Fed policy | Transition to less restrictive stance | Higher-for-longer bias | Not yet met |
| Structural drivers | Fiscal risk, debasement, geopolitics reasserting | Intact but dormant | Deferred |
J.P. Morgan’s conditional target The bank maintains a forecast that gold could reach $6,000 per ounce by December 2026, but now describes it as “increasingly conditional on rates pricing.”
The $6,000 figure is not a reason to buy today. It is a conditional forecast telling you exactly which conditions must align first, and until they show up in the data, the historical record argues for patience over anticipation.
Where the data needs to go for gold to find its footing
This is a decision-point, not a prediction. Two releases give you the clearest read on when the macro backdrop shifts in gold’s favour.
- Core PCE moderating toward 2%. A sustained move lower, tracked through the BEA headline figure alongside the Dallas and Cleveland Fed measures, is the clearest sign the Fed can credibly shift from restrictive to less restrictive.
- The NFP trend softening. The June-July pattern of +21,000 to +31,000 was far more supportive for gold than August’s +162,000 rebound. Sustained weakness would lift recession-risk pricing and pull safe-haven flows toward gold even before the Fed explicitly pivots.
The practical takeaway for anyone holding gold: track core PCE and NFP each month as your two leading indicators, rather than reading signal into every intraday XAU/USD tick.
For readers wanting to build the full analytical framework for interpreting each monthly release, our dedicated guide to reading the NFP report explains how wages, revisions, and cross-asset reactions interact to determine whether a given print tightens or loosens the Fed’s policy hand.
Structural scenarios that could change the calculus quickly
Some paths bypass the slow data-dependency route entirely.
- A geopolitical escalation, a sharp deterioration in confidence around US debt sustainability, or a currency-debasement episode could reassert gold’s structural role abruptly, independent of the rate cycle.
These are low-probability, high-impact scenarios rather than the base case. J.P. Morgan explicitly identifies these structural drivers as intact even while near-term rate pressure dominates, which means the structural bull case has not been abandoned. It has only been deferred.
Persistent energy-driven inflation, a Fed that defends its credibility through prolonged restrictive policy, and Shearer’s observed “very large lack of engagement” from investors all point the other way, toward extended downside pressure.
Gold at a macro crossroads: what changes the trade and what does not
Pull the chain together and gold’s fragile position stops looking accidental. The metal’s failure to recover from its recent lows is the predictable output of one specific macro configuration: oil-elevated PCE, high nominal yields, and a strong dollar. That configuration will not resolve until at least one of its inputs shifts.
The structural bull case has not gone away. J.P. Morgan’s $6,000 December 2026 target, grounded in fiscal risk, currency debasement, and geopolitical fragmentation, remains intact but sits in what Shearer calls a “deeper freeze” until rate-repricing risk recedes.
From roughly $4,182, here is what would change the trade:
- Core PCE converging sustainably toward 2%, freeing the Fed to ease.
- The NFP trend softening back toward the mid-2026 pace of near-stagnant hiring.
- A structural shock, geopolitical or fiscal, that overrides the rate cycle outright.
Your instinct to hold gold as a long-term inflation and risk hedge is not wrong. The timing of its next meaningful move is simply bound to the same sequence that has always governed it: real yields need to roll over before XAU/USD can sustain a recovery, and that requires the data to move first. Identifying the inflection is the easy part. Timing it is the hard part.
This article is for informational purposes only and should not be considered financial advice. Investors should conduct their own research and consult with financial professionals before making investment decisions. Past performance does not guarantee future results. Financial projections are subject to market conditions and various risk factors, and forward-looking statements are speculative and subject to change based on market developments.