The Federal Reserve just raised interest rates again, adding to earlier cumulative tightening in this cycle. Then its most influential regional president told the market not to expect a hurry.
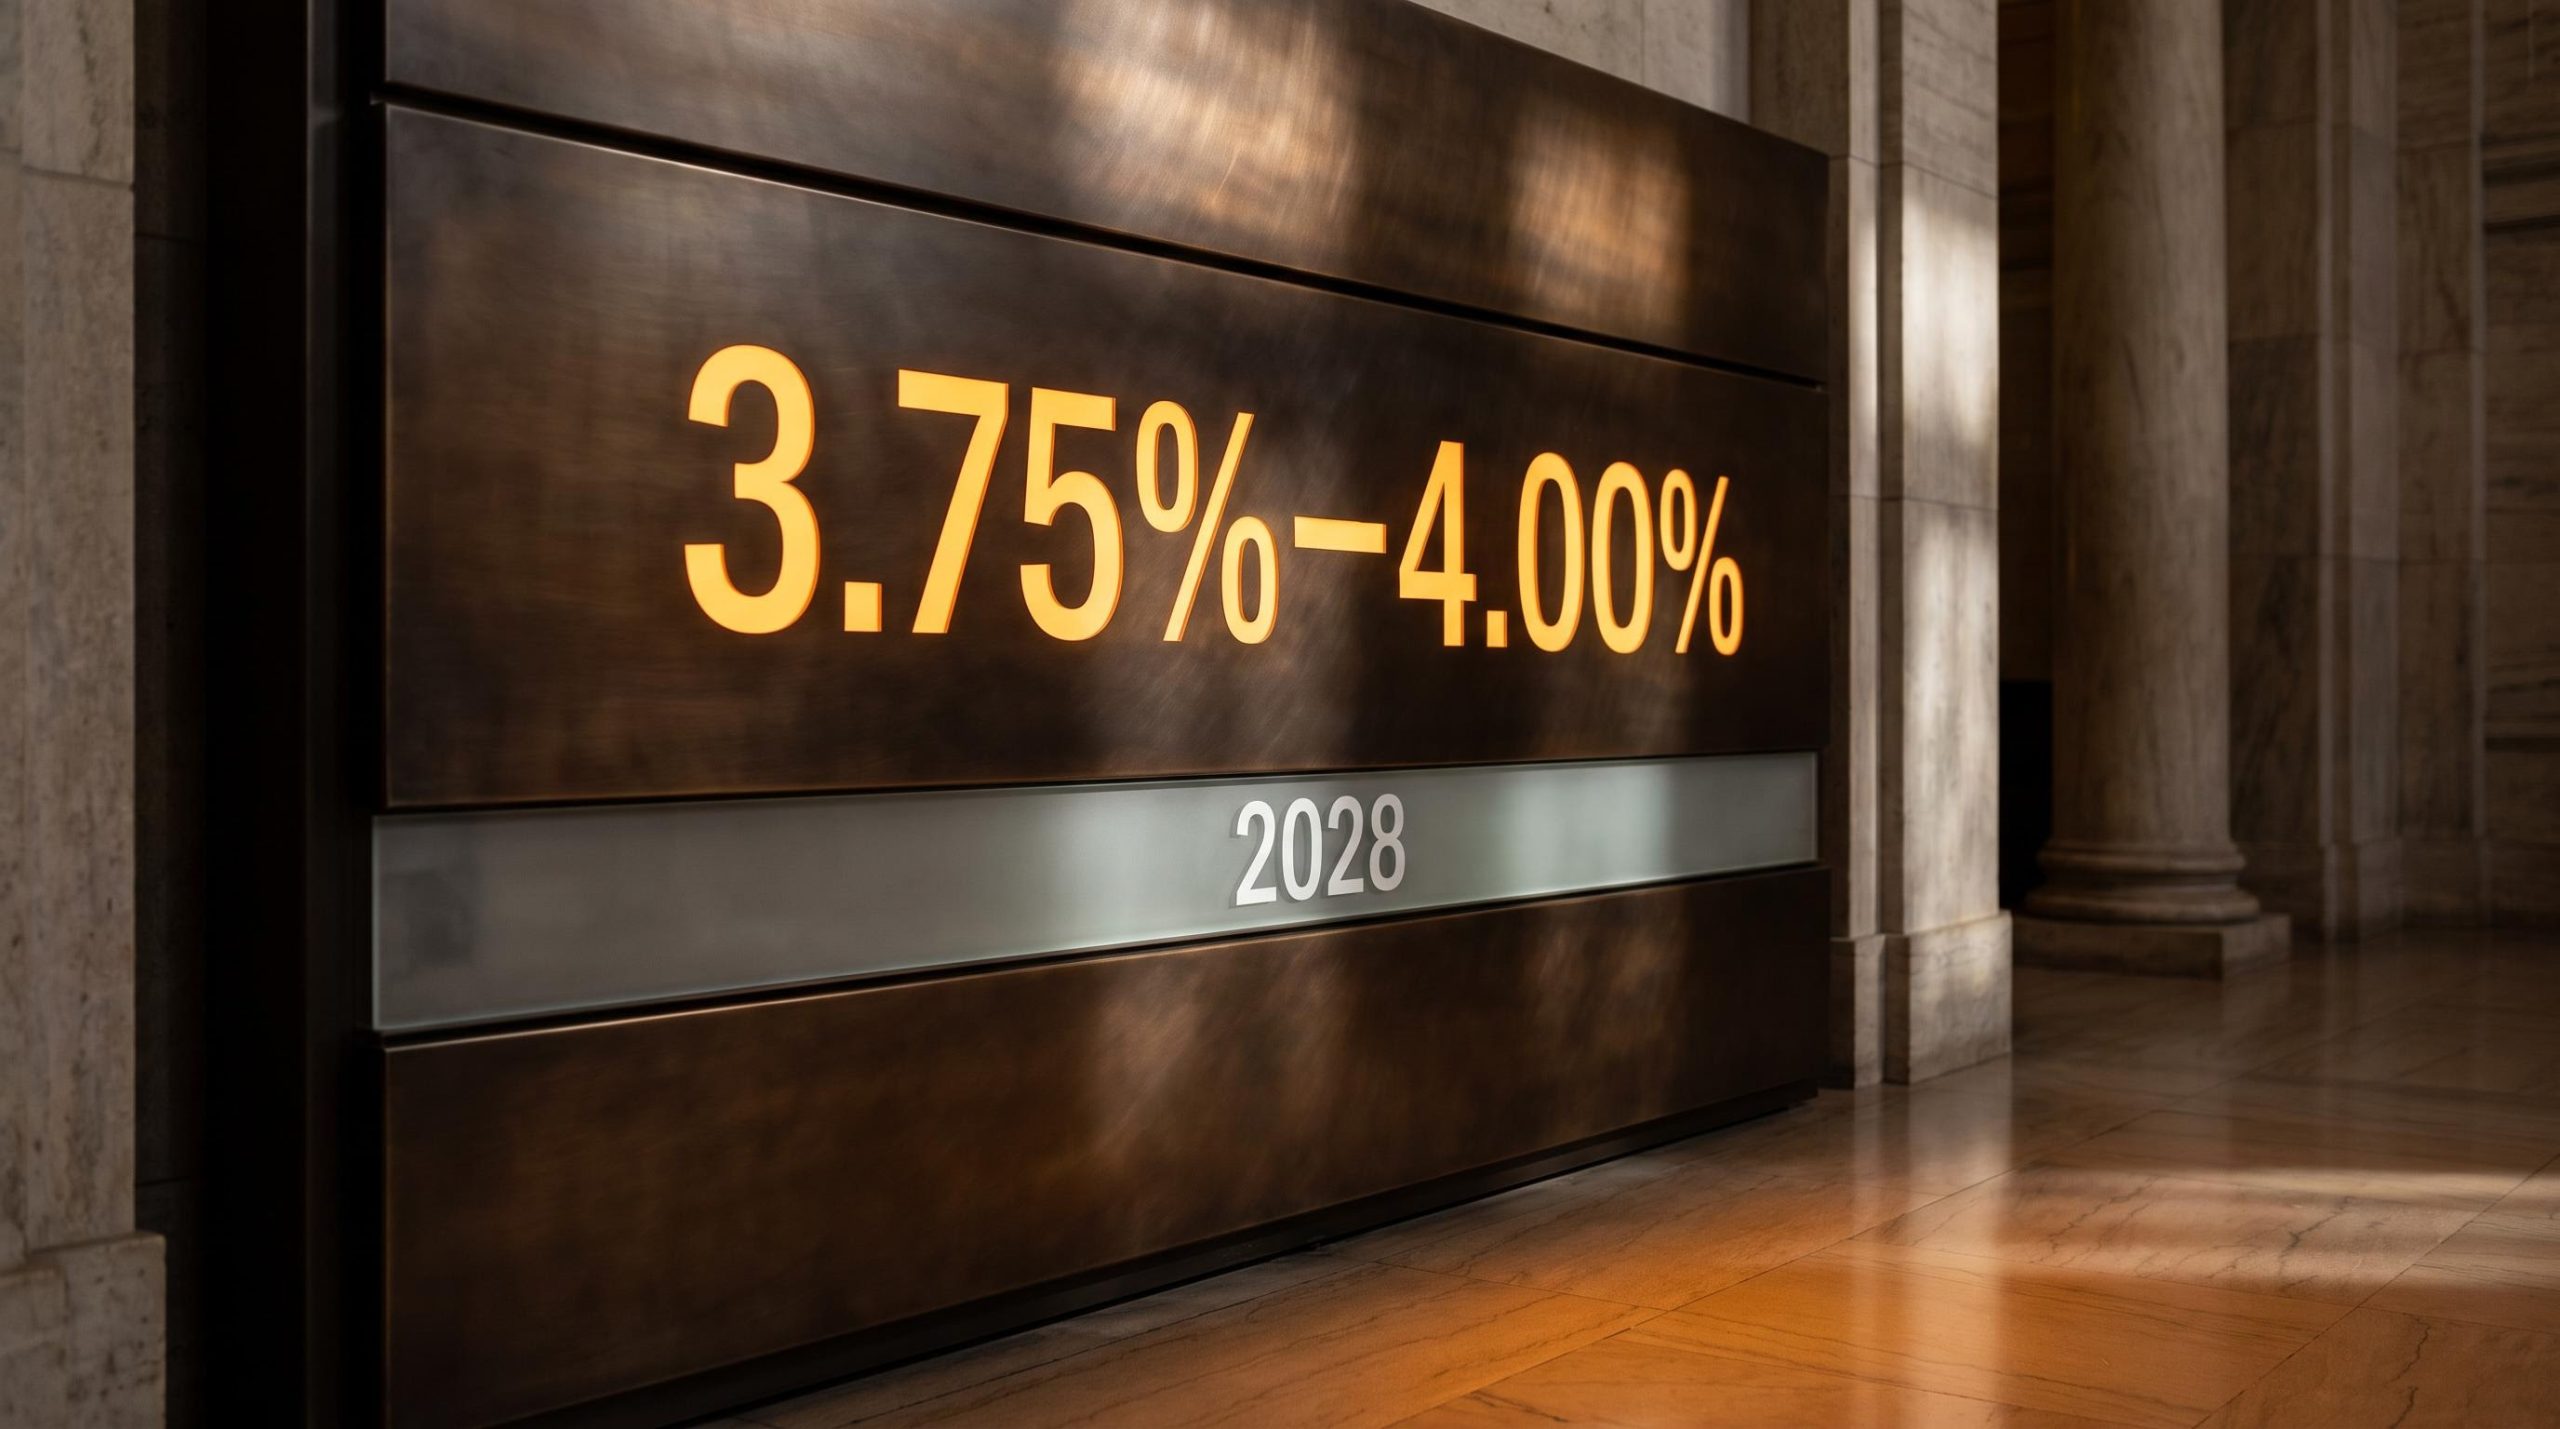
That combination is the reason the September meeting mattered more than the quarter-point move suggests. On 16 September 2026, the Federal Open Market Committee (FOMC) voted unanimously to lift the federal funds rate to a target range of 3.75%-4.00%, but the forward guidance from New York Fed President John Williams reframed the whole picture. Williams pointed to a 2028 timeline for inflation returning to target and flagged artificial intelligence investment as an emerging price-pressure risk, two details that reveal how the Fed is actually thinking.
Here is what a data-dependent Fed rate hike forecast means for the way you should read the next several months. The signals to watch are not the rate moves themselves but the projections, the inflation timeline, and the dollar’s reaction to every word of Fed communication. This analysis breaks down each one.
What the September FOMC decision actually signals beyond the headline rate move
The headline was clean: a 25-basis-point increase, delivered unanimously, effective 17 September 2026. J.P. Morgan Asset Management confirmed there were no dissents, which on its own reads as a committee in agreement about the direction of travel.
The more useful information sits in what participants said comes next.
The FOMC voting structure matters here because public remarks from non-voting regional presidents carry context weight but not binding policy force, a distinction that shapes how much directional authority Williams’s ‘no urgency’ framing actually carries into the next decision.
The Summary of Economic Projections (SEP), the quarterly document where each FOMC official records where they expect rates to go, tells a different story than a single hike. The numbers point to a Fed that is not yet finished, but is also in no rush to keep pushing.
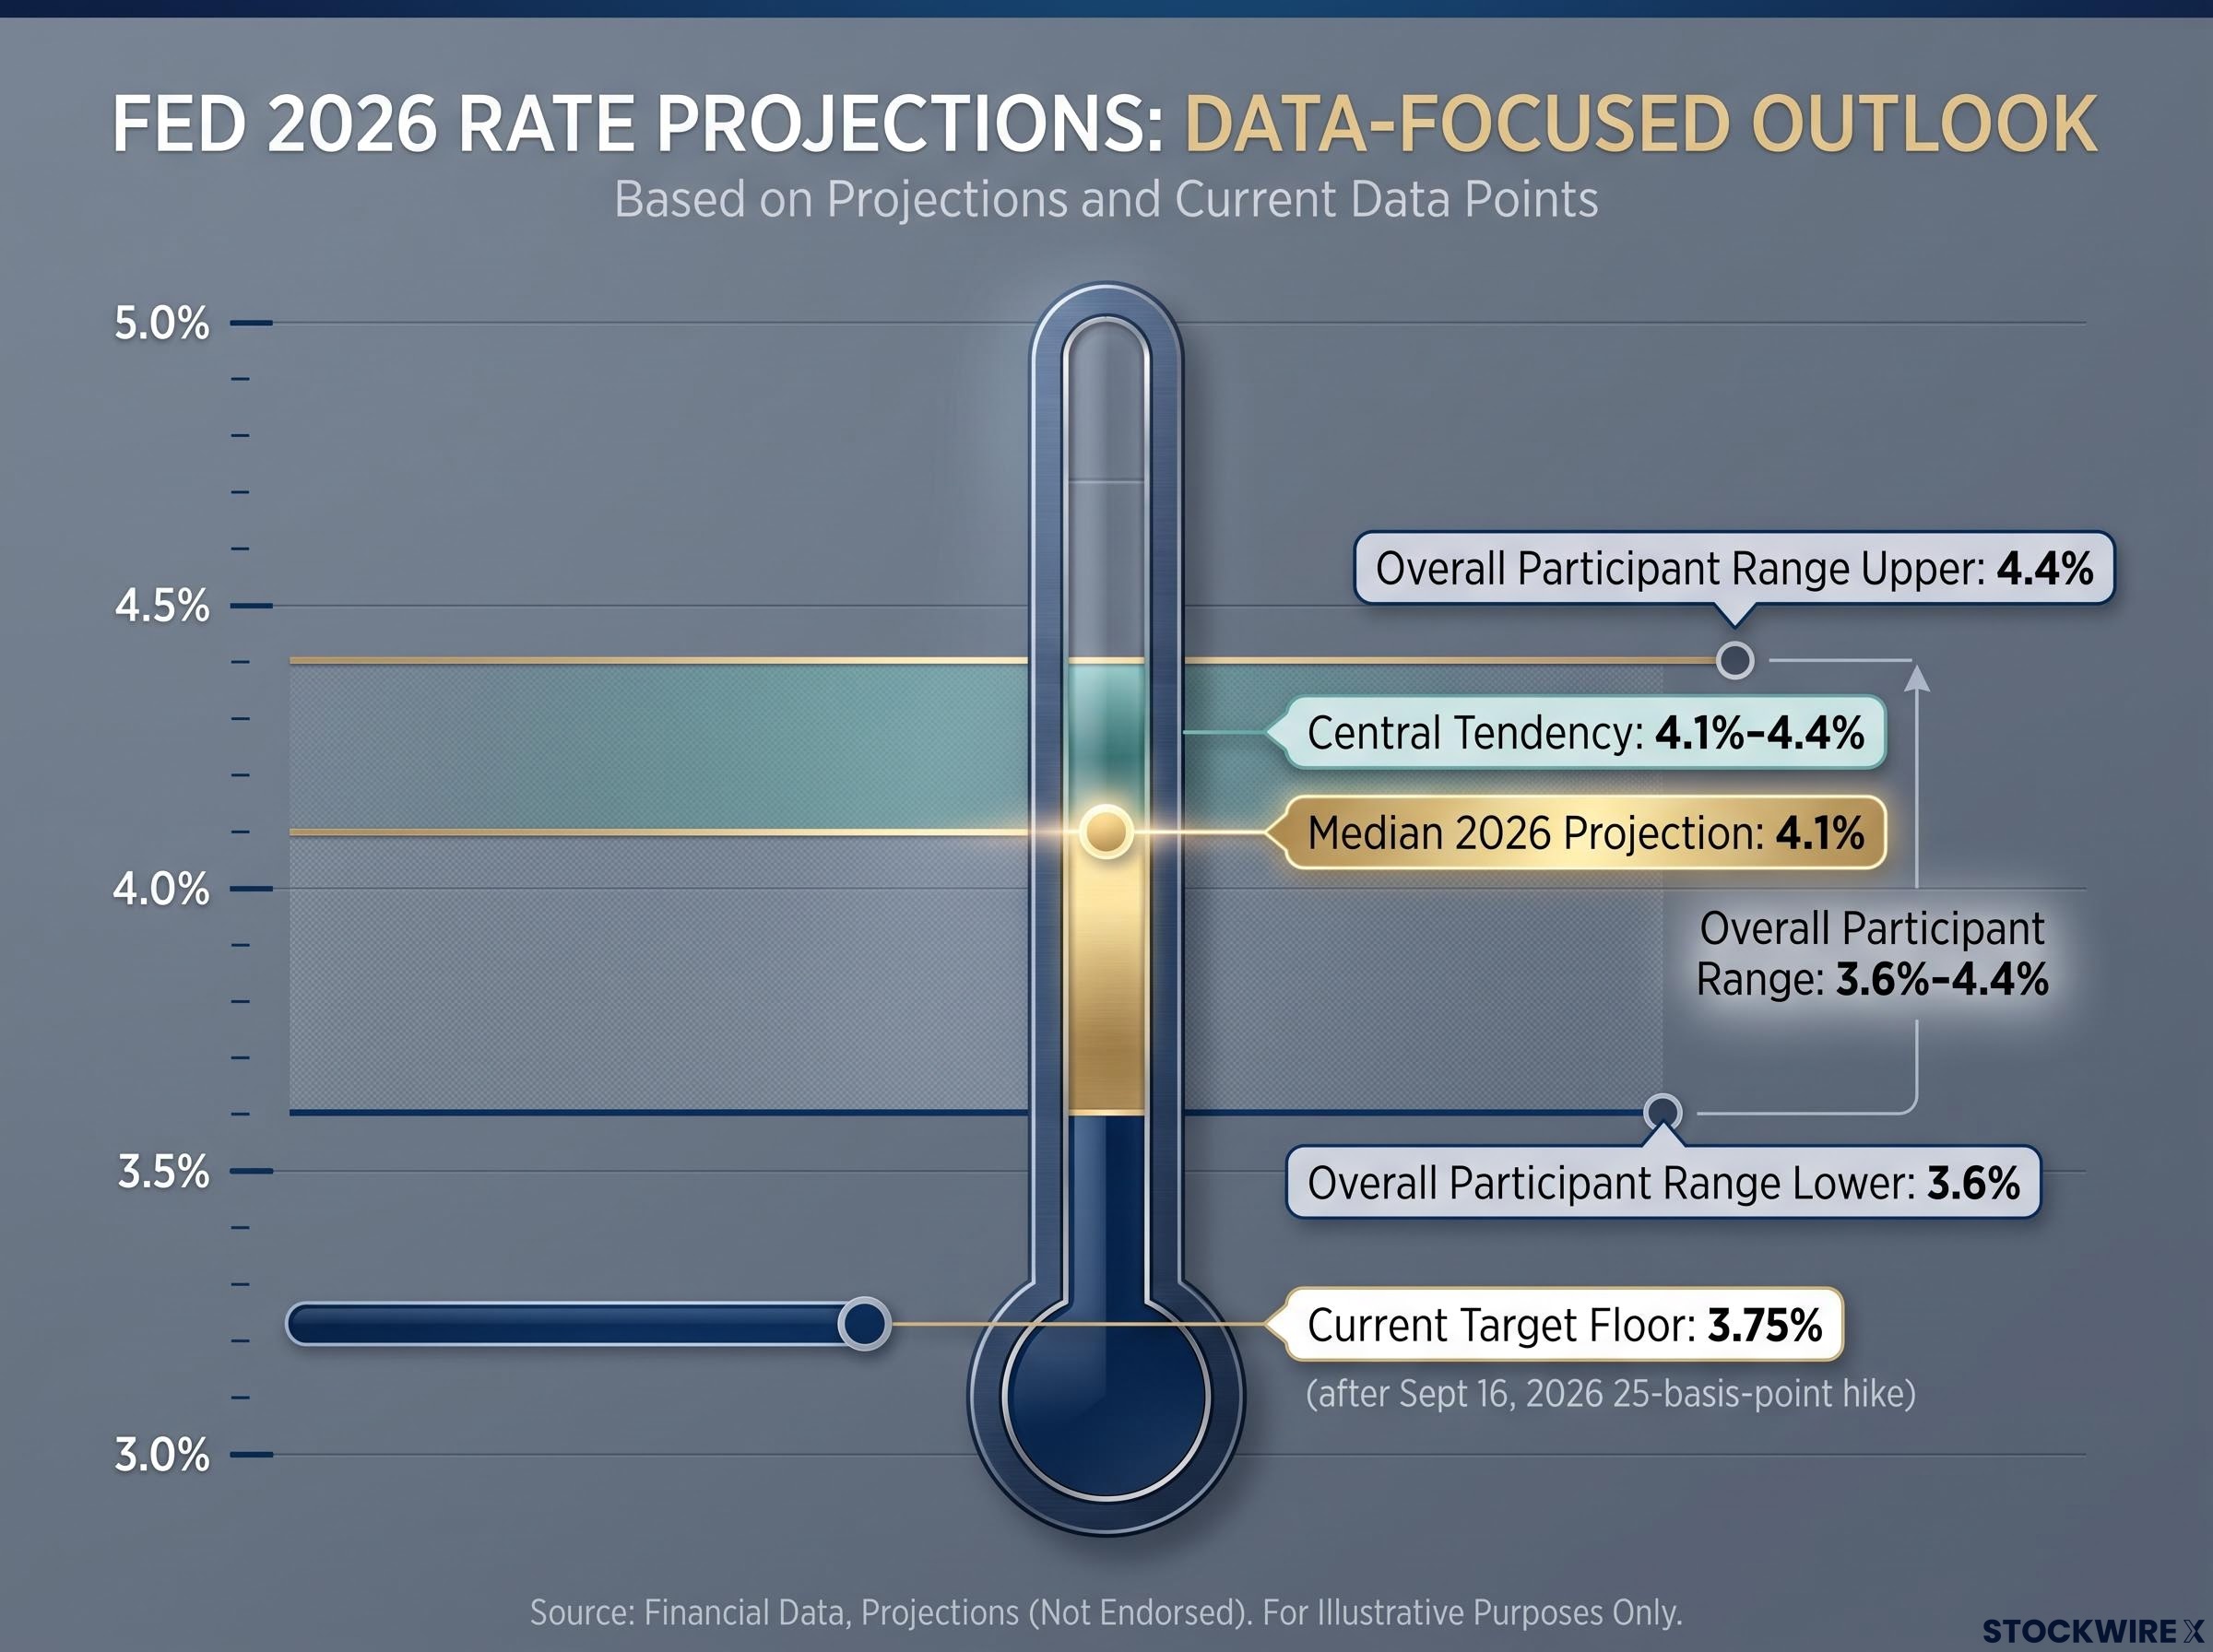
- Median 2026 rate projection: 4.1%
- Central tendency: 4.1%-4.4%
- Overall participant range: 3.6%-4.4%
With the current target floor at 3.75% and the median projection at 4.1%, the SEP implies at least one more 25-basis-point increase is on the table before year-end, if the data cooperate. That is the map that matters, not the move already made.
Williams supplied the tone to go with the map, signalling no urgency to act and a strictly data-dependent approach to what follows.
Williams’s “no urgency” framing is the anchor signal of this meeting: the Fed is choosing a measured, evidence-led pace rather than committing to a sustained hiking campaign.
For anyone pricing rate-path risk, the gap between the 3.75% floor already delivered and the 4.4% participant ceiling is the key spread to understand. It tells you the Fed sees more room to tighten, but the unanimity paired with Williams’s caution suggests the Committee is leaning toward patience over aggression. The difference between one more hike and two is material for fixed income positioning and for every dollar forecast built on top of it.
When big ASX news breaks, our subscribers know first
Why 2028 is a long way from 2% and what that gap means
Williams’s 2028 target date only makes sense once you look at how far current inflation still sits from the goal. The most recent hard data does the arguing for him.
The August 2026 Consumer Price Index (CPI), released by the U.S. Bureau of Labor Statistics (BLS) on 11 September 2026, showed headline inflation running at +3.4% year-on-year and +0.4% month-on-month on a seasonally adjusted basis. Core CPI, which strips out volatile food and energy prices, came in at +2.4% year-on-year and +0.3% month-on-month.
Williams’s own projection that inflation closes the current year near 3.5% lines up closely with that August headline reading. In other words, he is not forecasting much disinflation across the rest of 2026.
| Metric | Williams projection | Current reading (Aug 2026 / SEP) |
|---|---|---|
| Headline inflation (year-end) | ~3.5% | 3.4% YoY (August CPI) |
| 2% target achieved | 2028 | Core CPI 2.4% YoY (August) |
| US GDP growth (current year) | ~2.25% | Momentum described as robust |
| Unemployment | ~4% by 2027 | SEP rate peak ~4.1% in 2026 |
With core CPI still 40 basis points above target and Williams projecting only gradual convergence over more than two years, the read here is that Fed patience is not complacency. The final stretch of disinflation, the move from roughly 2.4% back to 2%, is historically the slowest and stickiest part to deliver.
For you, the 2028 date is not bureaucratic filler. It signals that restrictive borrowing conditions are likely to persist well into the next Presidential term, with direct consequences for equity valuations, credit costs, and the duration risk in any fixed income you hold.
The structural case for higher for longer without aggressive hikes
Why hold rates high rather than keep raising them? Three mechanisms explain the Fed’s choice.
The first is policy lag. Rate increases take months to work through the economy, so the tightening already delivered continues cooling demand and prices well after the last hike. Piling on more increases risks overshooting and damaging the labour market unnecessarily.
The second is the balanced-risk calculus. With inflation above target but well below its prior peak, the Fed is weighing the risk of prices staying high against the risk of choking growth and employment. Holding a restrictive level, rather than repeatedly pushing higher, is how it manages both at once.
The third is uncertainty about the neutral rate, the interest rate that neither stimulates nor restrains the economy. The gap between the projected 2026-2027 policy rate and the SEP’s longer-run rate suggests policymakers already see current settings as tight, which reinforces the case for waiting rather than hiking again.
AI investment as an inflationary wildcard: what Williams flagged and why it matters
The least expected line in Williams’s remarks was not about CPI or the labour market. It was about artificial intelligence.
Williams identified AI-related investment as a growing consideration for the inflation outlook, framing it as a forward-looking flag rather than an immediate alarm. It is the kind of signal that rarely makes headlines but changes how you should read the risks to any inflation forecast.
AI infrastructure inflation adds a structural dimension to Williams’s flag that goes beyond generalised capital expenditure: US data centre construction spending reached a $75.2 billion annualised rate in July 2026, and multiple senior Fed officials have named AI infrastructure on the record as an upward pressure on PCE that standard disinflation models do not yet capture.
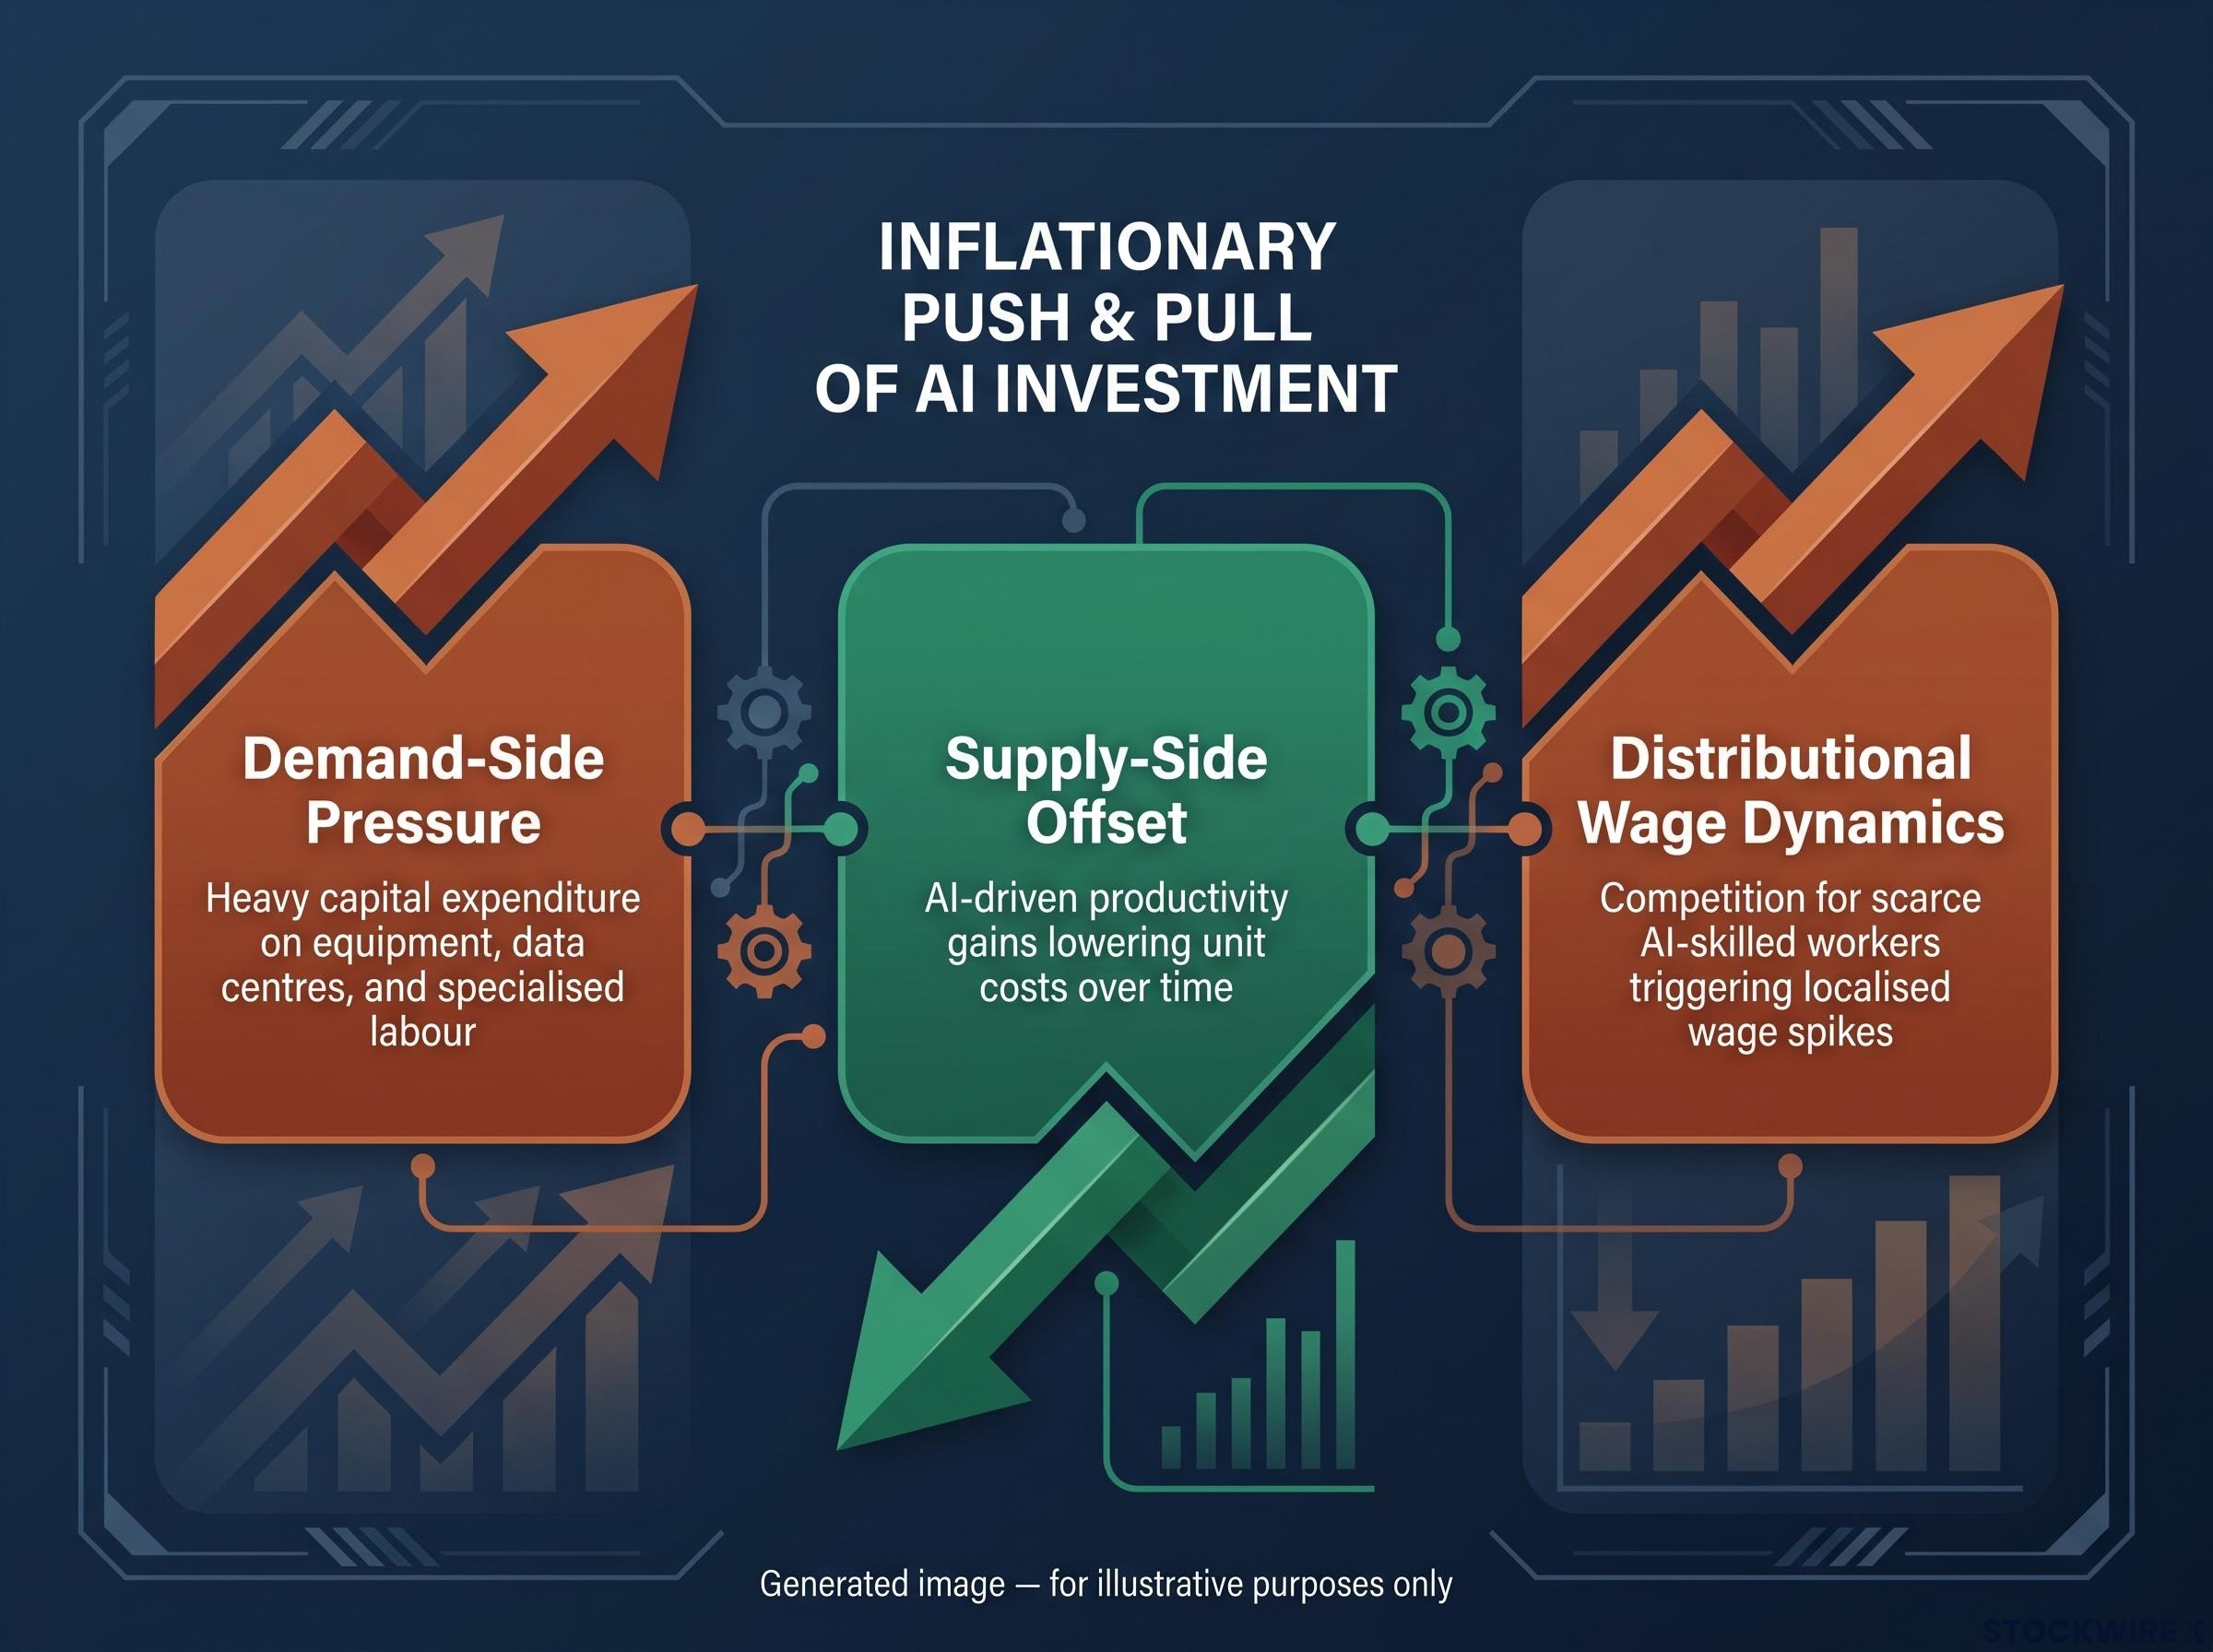
The channels through which AI feeds into prices pull in opposite directions:
- Demand-side pressure: Heavy capital expenditure on equipment, data centres, and specialised labour lifts aggregate demand, putting upward pressure on constrained sectors such as construction, high-end semiconductors, and energy.
- Supply-side offset: Over time, AI-driven productivity gains can lower unit costs across industries, exerting disinflationary pressure that could offset or even dominate the initial demand shock.
- Distributional wage dynamics: Competition for scarce AI-skilled workers can trigger localised wage spikes, producing pockets of inflation even as broad productivity improves.
The problem is timing. The demand-side inflation impulse arrives now; the productivity dividend arrives later, and the two do not coincide.
That timing mismatch, near-term inflationary investment against longer-term disinflationary productivity, is precisely the kind of structural uncertainty that makes the Fed reluctant to commit to a definitive rate path.
Read that way, Williams’s flag is as much a comment on the limits of forward guidance as it is about AI itself. Regulatory and competitive responses make the net effect genuinely hard to forecast, which is why he raised it as an open question rather than a resolved thesis.
For you as an investor, the practical takeaway is that AI capital expenditure now belongs on the same watchlist as CPI releases and payrolls. If spending in the sector accelerates meaningfully, it could complicate the 2028 inflation timeline and drag rate expectations higher than current pricing assumes.
How the dollar is reading the Fed’s cautious posture
Williams struck a dovish tone. The dollar barely flinched. That gap between what he said and what the currency did is where the real market signal lives.
His comments triggered only a modest dip in the US Dollar Index, and the currency held its positive position for the session. Per FXStreet data captured at the time of his remarks, the dollar advanced against almost every major peer.
| Currency pair | USD movement |
|---|---|
| USD vs Euro | +~0.30% |
| USD vs British Pound | +~0.21% |
| USD vs Japanese Yen | -~0.08% |
| USD vs Canadian Dollar | +~0.08% |
| USD vs Australian Dollar | +~0.50% |
| USD vs New Zealand Dollar | +~0.47% |
| USD vs Swiss Franc | +~0.23% |
The dollar’s strongest gain came against the Australian Dollar at roughly +0.50%, with the Japanese Yen the lone exception at about -0.08%.
The mechanism behind this is straightforward. Higher US rates relative to other advanced economies attract international capital into US fixed-income assets, which supports the dollar. A data-dependent, slower-pace signal, though, can cap how much further that support runs.
Yield differential transmission is the mechanism connecting the rate path to the dollar’s behaviour: higher US rates widen the return advantage of dollar-denominated assets, attracting foreign capital inflows that require USD purchases, though this logic breaks down when hikes are already fully priced in or offset by stronger growth abroad.
That the dollar held its gains despite dovish commentary tells you markets are still pricing in at least one more hike. Any genuine signal of a pause would likely produce a sharper pullback than this session delivered. For US investors holding unhedged foreign assets, that is the leading indicator to watch: a real dovish pivot weakens the dollar and lifts foreign returns, while renewed hiking urgency does the reverse.
The three tools the Fed uses to move markets, and where each stands now
The FOMC meets eight times a year, and its twelve voting members (seven Governors, the New York Fed president, and four rotating regional presidents) work with three main tools under a dual mandate of price stability and maximum employment.
- Interest rate adjustments: The primary tool. Raising rates strengthens the dollar by pulling in capital; cutting rates weakens it. This is the lever currently in use.
- Quantitative tightening (QT): The Fed stops buying bonds and stops reinvesting maturing principal, shrinking its balance sheet. This is generally supportive of the dollar and is the balance-sheet complement to the current hiking cycle.
- Quantitative easing (QE): The Fed buys high-grade bonds, expanding its balance sheet. This typically weakens the dollar and is not the current posture.
The downstream risks of holding this stance are worth watching: sustained high rates pressure credit markets, commercial real estate valuations, and dollar-denominated emerging market debt.
What the Fed’s patient posture means for the months ahead
Pull the four threads together and a coherent picture emerges. The SEP leaves a final hike on the table, Williams pins the inflation target to 2028, AI investment sits as an unquantified wildcard, and the dollar is still braced for more tightening rather than easing.
That combination points to a specific set of risks you should track rather than a single outcome to bet on. The SEP shows rates peaking near 4.1% in 2026 before drifting lower through 2027-2029, with unemployment forecast around 4% by 2027. The strain of higher-for-longer tends to surface in three places:
- Credit markets: A refinancing wall in 2027-2028 forces leveraged borrowers to roll debt at higher coupons, re-pricing credit risk more abruptly.
- Commercial real estate: Elevated financing costs pressure valuations and refinancing, with knock-on exposure for regional banks and credit funds.
- Emerging markets: A firm dollar raises rollover risk on dollar-denominated debt and heightens vulnerability to capital-flow reversals.
The Fed’s patient posture extends uncertainty rather than resolving it. Anyone reading the current pause as a signal of imminent easing is likely to be wrong.
The signals that decide whether the Fed delivers that last projected hike or stands pat are already scheduled: upcoming CPI prints, the monthly payrolls reports, and the tone of subsequent FOMC communications. Watch those three, not the rate decision in isolation.
For investors wanting to understand how this data-dependent posture changes the toolkit for reading future meetings, our deep-dive into the end of Fed forward guidance covers how Warsh’s overhaul of the communication regime forces a rebuild of rate-expectations strategy from first principles.
This article is for informational purposes only and should not be considered financial advice. Investors should conduct their own research and consult with financial professionals before making investment decisions.
Past performance does not guarantee future results. Financial projections are subject to market conditions and various risk factors, and forward-looking statements here are speculative and subject to change based on economic developments.