The 10-year TIPS real yield has climbed to 2.78%, the highest reading since 2008. Yet inflation expectations have barely budged. If prices are not the worry, what exactly is pushing the real cost of money to a 17-year high?
That question matters because real yields set the actual price of borrowing once inflation is stripped out. When they rise sharply, they lift the discount rate applied to almost everything you own, from stocks and houses to corporate debt, quietly reshaping the risk and reward of every position in your portfolio.
The repricing has been broad and fast. Yields across the curve have moved up between 80 and 170 basis points during the current tightening cycle. Here is the framework that lets you read a real yield number and understand which economic forces are actually moving it, and what that movement means for where you hold your money.
What real yields actually measure, and why the distinction matters
Start with something familiar: the yield on a 10-year US Treasury. That headline number, the nominal yield, is not one thing. It is two things stacked on top of each other, and separating them is the whole game.
The nominal yield decomposition
A nominal yield equals the real yield plus the inflation compensation, often called the breakeven. The real yield is the return you earn after inflation is accounted for. The breakeven is the market’s expectation of average inflation over the life of the bond.
These two components answer to different masters. The breakeven moves on inflation fears. The real yield moves on the expected path of policy rates and the underlying strength of the economy.
That split is the key. When breakevens sit still and nominal yields climb, every bit of the movement is coming from the real component. Nothing is hiding in the inflation layer.
Right now the nominal 10-year has crossed 5%, sitting alongside a 2.78% real yield. That implies a breakeven of roughly 2.2%, a contained inflation expectation. According to BNY Markets analysis reported by FXStreet, inflation breakevens and inflation swaps have stayed relatively stable within recent ranges throughout this period.
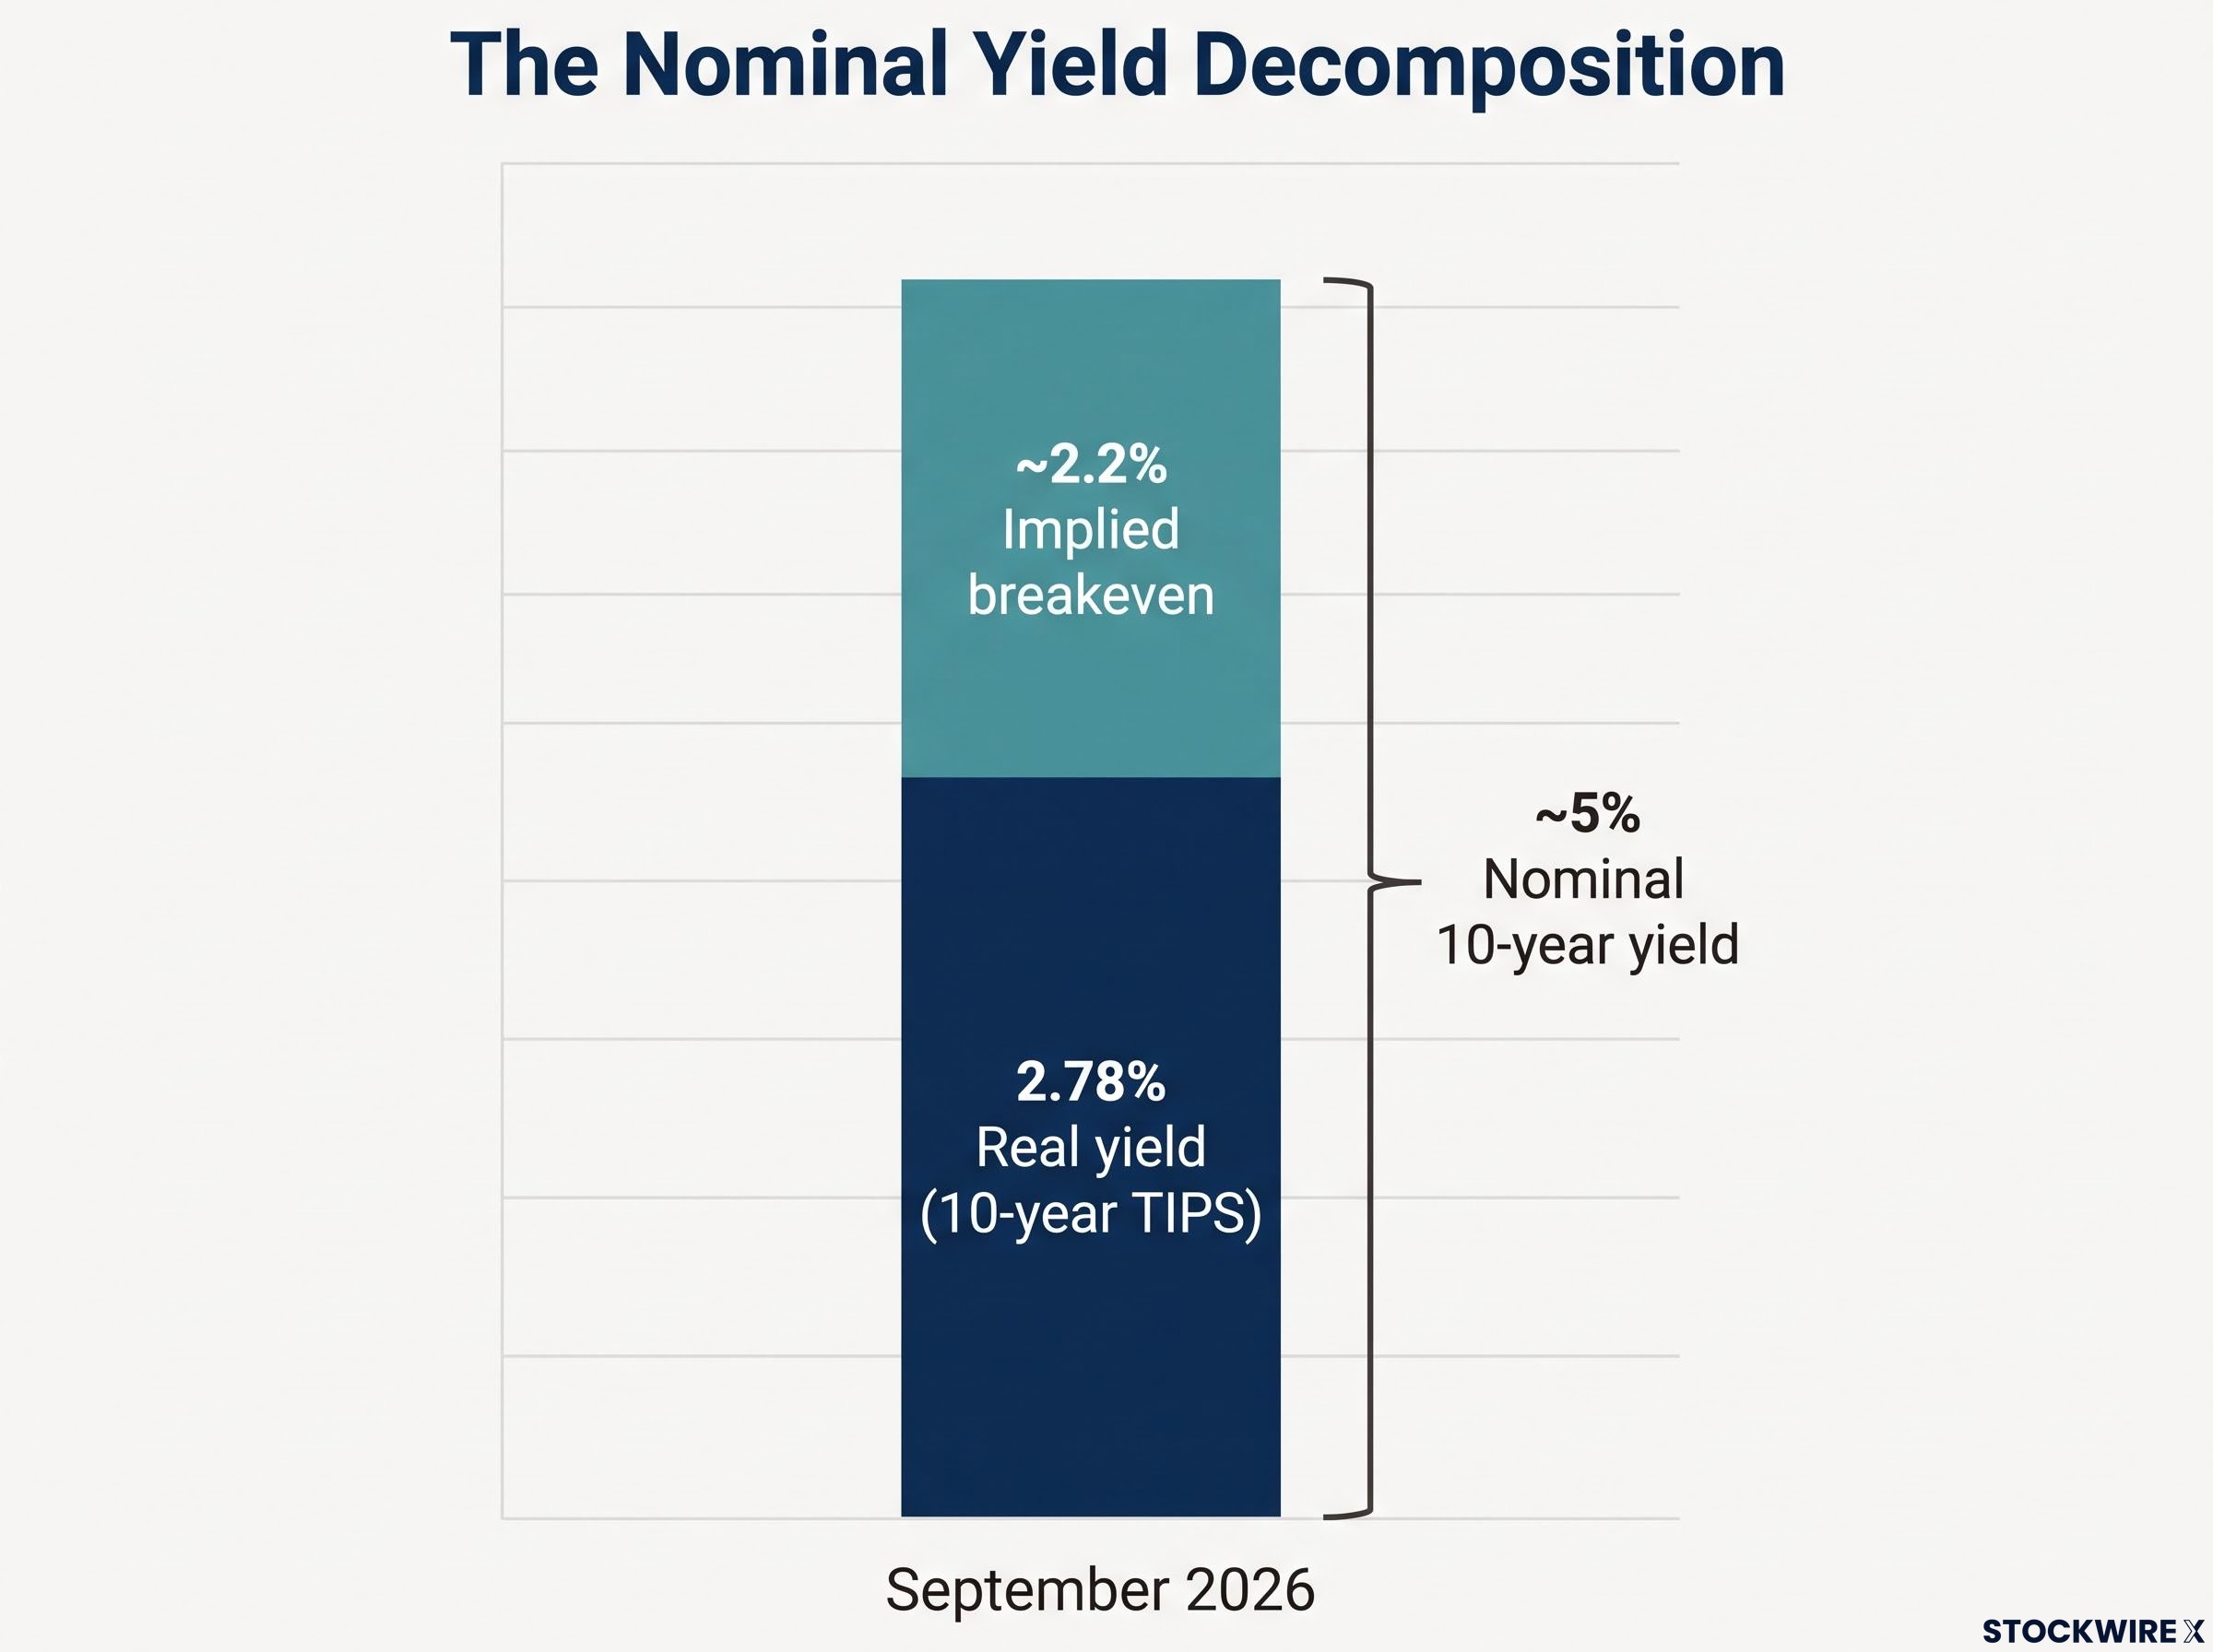
| Component | Approximate Level (September 2026) |
|---|---|
| Nominal 10-year yield | ~5% |
| Real yield (10-year TIPS) | 2.78% |
| Implied breakeven (inflation compensation) | ~2.2% |
How TIPS make real yields directly observable
You do not have to estimate the real yield. You can read it straight off a specific type of bond: Treasury Inflation-Protected Securities, or TIPS.
With a TIPS bond, the principal adjusts up and down with the Consumer Price Index. Because the inflation piece is built into the payout, the yield quoted on a TIPS bond is a real yield by construction. It is what you earn on top of inflation, no guesswork required.
That makes the TIPS yield a cleaner signal than a real yield you have to back out of nominal bonds. When it reads 2.78% with breakevens sitting quietly, the message is direct: the bond market is not pricing an inflation scare. It is pricing something else. That distinction is the foundation for everything that follows.
When big ASX news breaks, our subscribers know first
Why monetary policy expectations are the primary driver
So if inflation is not the culprit, follow the logic. Breakevens are stable. Real yields are surging. The force has to be coming from the expected path of the policy rate itself. And the market pricing confirms exactly that.
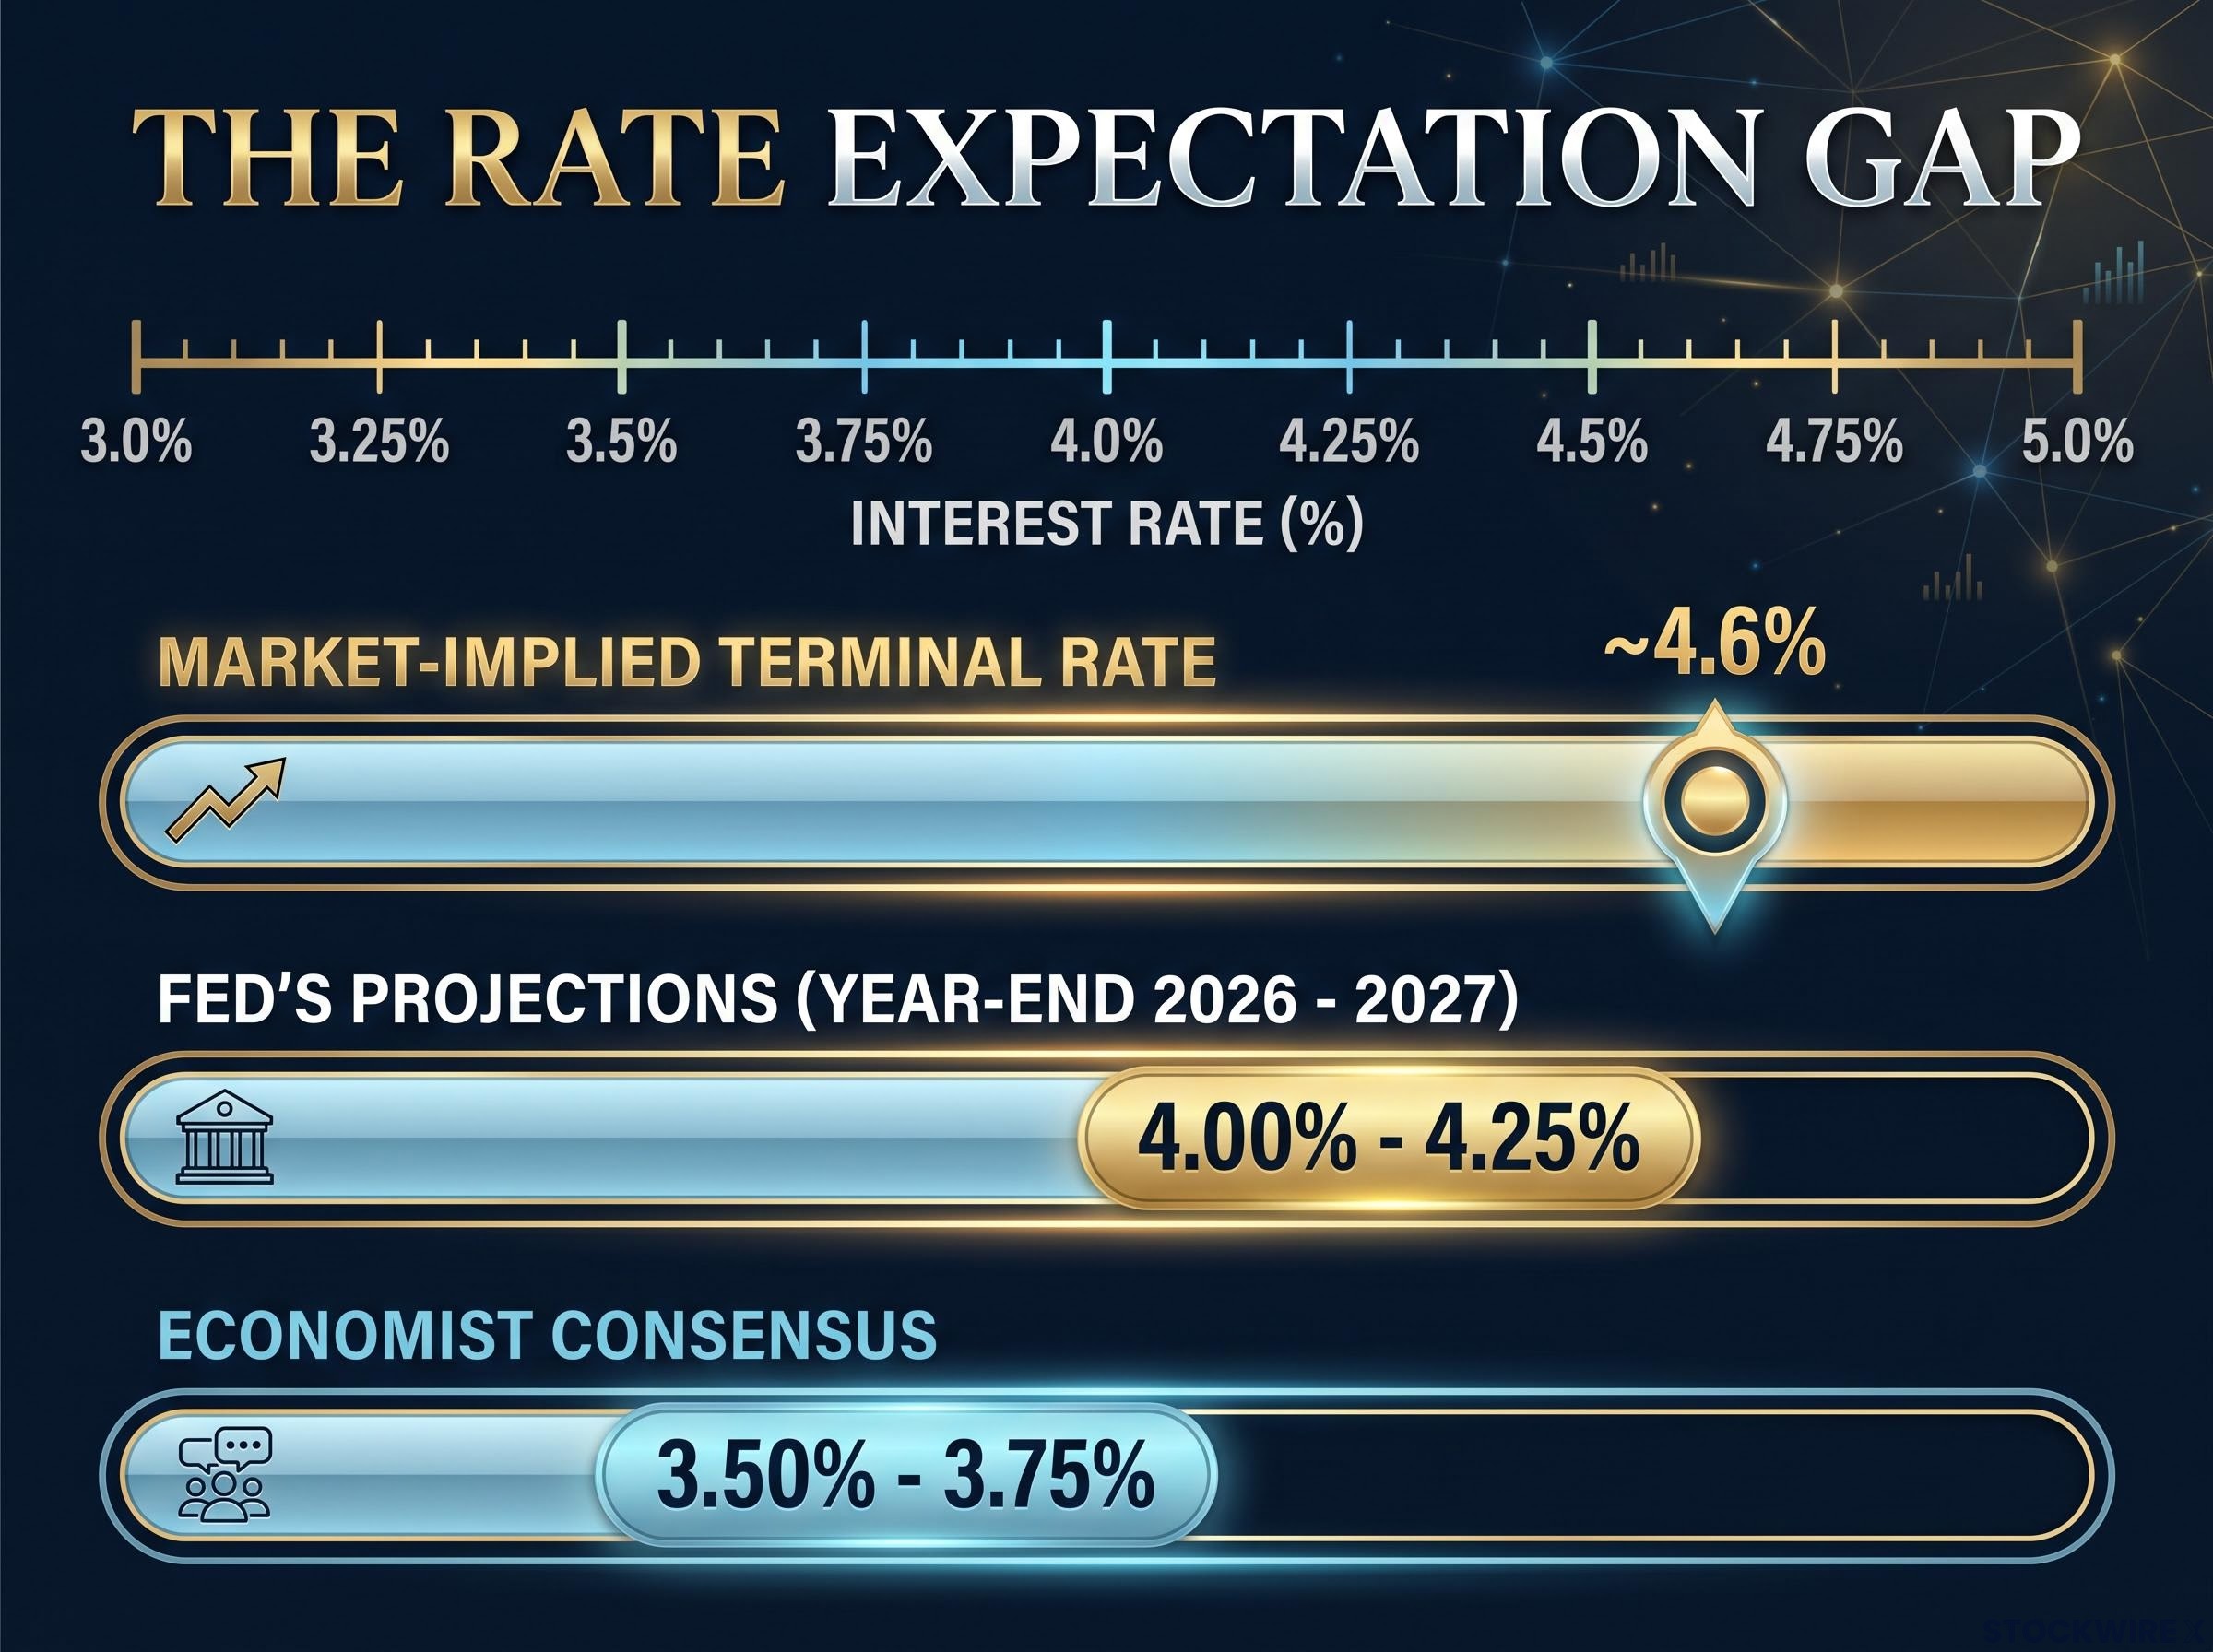
According to Reuters Breakingviews, using CME FedWatch and interest-rate swap prices, money-market traders as of 16 September 2026 were pricing four quarter-point hikes over the following year. That implies a terminal rate of roughly 4.6%. When markets expect the Federal Reserve to keep short rates higher for longer, the entire real rate structure shifts up to reflect that anticipated path.
CME FedWatch implied a 93% probability of an immediate 25 basis point hike to a target range of 3.75%-4.00% at the upcoming FOMC meeting.
The scale of that conviction is worth pausing on. Here is the market pricing that anchors the policy-expectations story:
- CME FedWatch: 93% probability of an immediate 25 basis point hike, taking the target range to 3.75%-4.00%
- Market-implied terminal rate: approximately 4.6%, via four quarter-point hikes over 12 months
- Fed’s own projections: policy rate at 4.00%-4.25% by year-end 2026, holding there through 2027
- BNY Markets estimate: roughly 75 additional basis points of tightening priced over the rest of the cycle
Not everyone agrees the Fed will follow through. Reuters polls of economists in June and August 2026 found a majority expecting rates to hold at 3.50%-3.75% through year-end, a notably more cautious view than the market’s pricing of further hikes. That gap between market pricing and economist consensus is the live uncertainty embedded in current yield levels.
The broader Fed rate hike implications for equity valuations and bond duration risk extend well beyond the immediate CME FedWatch probability, with the 10-year Treasury already clearing approximately 5.01% and market-implied follow-up hike odds surging to 56.5% within a week of the September 2026 FOMC decision.
The clearest fingerprint of a policy-driven story sits in the shape of the move. According to BNY Markets analysis reported by FXStreet, the 2-year real yield has risen more than 170 basis points during this cycle, while longer maturities have climbed between 80 and 113 basis points.
That outsized move at the short end is exactly what you would expect if the dominant force is a reassessment of where short rates are heading, rather than a structural shift in the long-run equilibrium. The front of the curve is where policy-rate expectations live, and that is where the biggest adjustment has happened.
For you, this reframes what to watch. If the story is policy expectations rather than inflation, then Fed communications, the dot plot, and CME FedWatch pricing deserve more of your attention than the next inflation print. That is where the next major repricing is most likely to originate.
How strong growth and the AI investment boom add fuel
Policy expectations are the primary driver, but they are not the only one. Two real-economy forces are layered on top, and understanding them tells you whether real yields might stay elevated even after the Fed stops hiking.
Why a strong economy lifts the equilibrium real rate
Economists talk about the equilibrium real rate, often written as r*. In plain terms, it is the real interest rate that balances how much the economy wants to save against how much it wants to invest.
When the real economy is strong and profitable projects are plentiful, more of those projects compete for the same pool of savings. That competition lifts the real rate needed to clear the market, pushing observed real yields up even beyond the pure policy-expectations channel.
The evidence that real strength is not fading sits in the jobs data. Tight labour markets and ongoing employment growth, cited in Reuters reporting on the tightening cycle, signal an economy that keeps generating demand rather than one rolling over.
Why the AI capex boom shows up in real yields, not inflation
The second real-economy force is the AI investment cycle. BNY Markets explicitly identifies strong growth and AI-driven capital expenditure as secondary drivers alongside monetary policy expectations. The buildout of data centres and AI infrastructure is a genuine surge in real investment demand, backed by high expected real returns.
The AI investment boom has pushed US IT hardware and software spending to a record 4.9% of GDP in Q1 2026, surpassing both the dot-com era peak and the cloud buildout peak, a scale of real investment demand that provides direct empirical grounding for why r* is moving alongside policy expectations rather than in spite of them.
Here is why that pressure routes into real yields specifically rather than nominal ones:
- The buildout raises the real return on capital, drawing more savings toward productive investment and lifting the clearing real rate
- Higher expected productivity and potential growth support a higher real required return on safe assets
- With inflation expectations anchored by credible policy, the adjustment shows up mechanically in the real component, not the breakeven
Bloomberg projected on 4 October 2024 that major US technology firms were on track to spend roughly $200 billion on capital expenditure in 2025, with a cumulative increment of about $90 billion over 2023 levels across 2024-2025. These figures are noted as unverified by independent confirmation and should be treated as an estimate rather than an established fact.
There is precedent for this pattern. The late-1990s technology and internet investment boom coincided with elevated real yields, as strong productivity expectations lifted r* without unsettling inflation expectations. The mechanism is not new; the technology driving it is.
For anyone holding technology or growth equities, the tension here is direct. The same AI spending cycle fuelling earnings optimism is simultaneously raising the real discount rate applied to those future earnings. That is a cost worth pricing into any long-duration equity position, because it cuts against the very valuations the boom is meant to support.
What elevated real yields mean for bonds, equities, and borrowing costs
Now the framework meets your portfolio. A 2.78% real yield is not an abstraction. It changes the relative appeal of nearly every asset you can hold.
How financial assets are repriced
The most direct effect is on the bond-versus-equity choice. A 2.78% real return on a risk-free government bond is a meaningful, inflation-adjusted payout that competes head-on with the earnings yield on stocks, especially when equity valuations are stretched.
Reuters’ Trading Day framed it plainly: the 10-year TIPS real yield at 2.78% could tempt all kinds of investors to diversify away from expensive stocks and lock in attractive returns on risk-free assets.
Growth equities feel the squeeze most acutely. Higher real yields raise the discount rate applied to distant cash flows, and companies whose value sits mostly in far-off earnings, high-multiple technology and growth names, lose the most present value. Value and cash-flow-rich stocks, whose earnings arrive sooner, are less exposed.
| Asset Class | Effect of High Real Yields | Portfolio Implication |
|---|---|---|
| Long-duration Treasuries | Price falls as real rates rise; high sensitivity to term premium | Favour shorter maturities if term premium is climbing |
| TIPS | Lock in an elevated real return with inflation protection intact | Attractive core holding at current real yields |
| Growth equities | Distant cash flows discounted harder; valuations compress | Reduce exposure to speculative, high-multiple names |
| Value equities | Nearer-term earnings less sensitive to discount rate | Tilt toward cash-flow-rich sectors |
| Housing and mortgage assets | Higher real mortgage rates pressure affordability | Expect weaker demand and homebuilding activity |
The broader economic and fiscal transmission
Beyond your holdings, high real yields raise real borrowing costs across the economy. That lifts the hurdle rate for non-AI capital projects, potentially slowing investment outside the technology boom, and it pushes real mortgage rates higher, pressuring housing affordability and demand.
The fiscal risk is larger still. The Congressional Budget Office and the IMF have flagged that persistently high real yields worsen US federal debt dynamics: when the real interest rate exceeds real growth for a sustained stretch, debt-to-GDP rises faster absent large primary surpluses.
US debt sustainability becomes structurally fragile at the precise point where the real interest rate exceeds real growth, and the CBO projects that crossover arriving around fiscal year 2031, compressing the window in which primary deficits can persist without accelerating the debt-to-GDP ratio.
The strain does not stop at the US border. BIS and IMF analysts have warned that elevated US real yields can pull capital out of emerging markets, driving currency depreciation and financial-stability pressures in countries carrying heavy dollar-denominated debt. If you hold international exposure, that spillover risk sits inside your portfolio too.
At 2.78% real, the risk-free alternative is no longer trivial. The choice between holding expensive growth equities and locking in a meaningful inflation-adjusted return on government bonds has shifted materially. It is worth asking honestly which side of that trade your current allocation sits on.
For investors wanting to construct a deliberate response to the current real yield environment, our dedicated guide to fixed income strategy covers a laddered allocation framework across TIPS, intermediate Treasuries, and investment-grade corporates, including the phantom income tax issue that makes TIPS significantly more efficient inside a tax-advantaged account.
Reading real yields as a signal, not just a number
Pull the three drivers together and a coherent picture emerges. Real yields are elevated because of policy-rate expectations, a strong economy lifting r*, and AI-driven investment demand. All three would need to shift before real yields could sustainably retreat.
That is what makes real yields a signal rather than a static reading. A meaningful decline would tell you a Fed pivot is becoming credible, growth is softening, or the investment boom is fading. Continued elevation tells you the higher-for-longer path, durable real growth, and the ongoing buildout are all still intact.
The gap between what markets price and what economists forecast is the tell. Markets see four hikes and a terminal rate near 4.6%; economists lean toward a hold at 3.50%-3.75%. That divergence is live uncertainty, and it is exactly where the next major repricing may come from. Watch these four indicators:
- TIPS yields directly. A sustained fall signals easing across one or more of the three drivers; continued climbing signals the pressure persists.
- Inflation breakevens. These separate the real component from the inflation component, telling you whether a yield move is a growth story or a price story.
- CME FedWatch pricing. The cleanest read on the policy-expectations channel, and the one the Fed’s own 4.00%-4.25% projection through 2027 anchors.
- Big-tech capex guidance. A leading indicator of real investment demand; slowing spend would ease upward pressure on r*.
One supplementary variable is worth noting. Some strategists argue term premium is recovering from unusually depressed levels, which would add a fourth independent driver of long-end real yields beyond pure policy expectations.
A reader who leaves with this watchlist can reassess positioning as conditions change, rather than making a one-time call on today’s snapshot.
This article is for informational purposes only and should not be considered financial advice. Investors should conduct their own research and consult with financial professionals before making investment decisions.
Past performance does not guarantee future results. Financial projections are subject to market conditions and various risk factors, and forward-looking market pricing is speculative and subject to change based on economic developments.