Arm Holdings (ARM) surged more than 22% across three trading sessions before reversing hard, dropping just under 10% intraday and closing down roughly 8% in the session that broke the run. Lumentum (LITE) climbed approximately 500% in under a year, then cracked its ascending trendline in a single session.
These are not abstract chart exercises. Something specific is happening across semiconductor and photonics names right now, and technical traders have a vocabulary for reading it.
When a stock moves this fast and this far, even investors who never look at a chart face the same question: is this a healthy pause before the next leg up, or the first sign of a real reversal? Technical traders answer that question with a handful of named signals. This piece explains what those signals actually claim.
By the time you finish this, you will know what a gap fill, a trendline break, and a head-and-shoulders pattern look like in practice, using real stocks at real price levels. More importantly, you will understand what each signal says about market psychology, rather than treating chart reading as mysticism.
Why price gaps form, and why traders watch them so closely
A price gap is a zone on a chart where no trading happened. It appears when a stock opens materially above or below its prior close, usually because overnight order flow, driven by news, earnings, or a sector-wide event, overwhelmed the previous session’s closing price before the market reopened.
In high-momentum names like AI-linked semiconductors, gaps almost always follow a significant catalyst. That leaves the early buyers who chased the move sitting on large unrealised gains, and it leaves a visible zone of empty space on the chart below the current price.
Traders watch that empty space because of what it tends to attract. Prices often drift back into a gap for three reasons: profit-taking by the buyers who rode the initial move, mean-reversion behaviour when a spike proves temporary, and large participants working orders back into the prior trading range where liquidity is deeper. This is a tendency rooted in behaviour, not a mechanical rule that guarantees a fill.
That distinction matters enormously in practice. Consider ARM.
ARM gap-fill setup ARM rallied more than 22% in three sessions, then reversed for an intraday drop of just under 10% and a close down roughly 8%. The stock had not filled the gap left by that rally. Lawton at Verified Investing flagged a potential entry near $275, which would mark a decline of roughly 18% from the prior Wednesday’s peak.
ARM’s unfilled gap tells you a zone of unfinished business sits below the current price. Whether it fills depends on which kind of gap this turns out to be, not on the myth that all gaps close eventually.
The four gap types and what each signals
Professional educators, drawing on the CMT Association curriculum and the work of Edwards and Magee, sort gaps into four categories, each with a different fill likelihood:
- Common gaps: Ordinary noise inside a range, and the most likely to be retraced quickly.
- Breakaway gaps: Form at the start of a strong new trend, and are less likely to fill in the near term.
- Runaway (measuring) gaps: Appear mid-trend as momentum accelerates, and are also less likely to fill quickly.
- Exhaustion gaps: Form near the end of a move, and are more prone to being retraced.
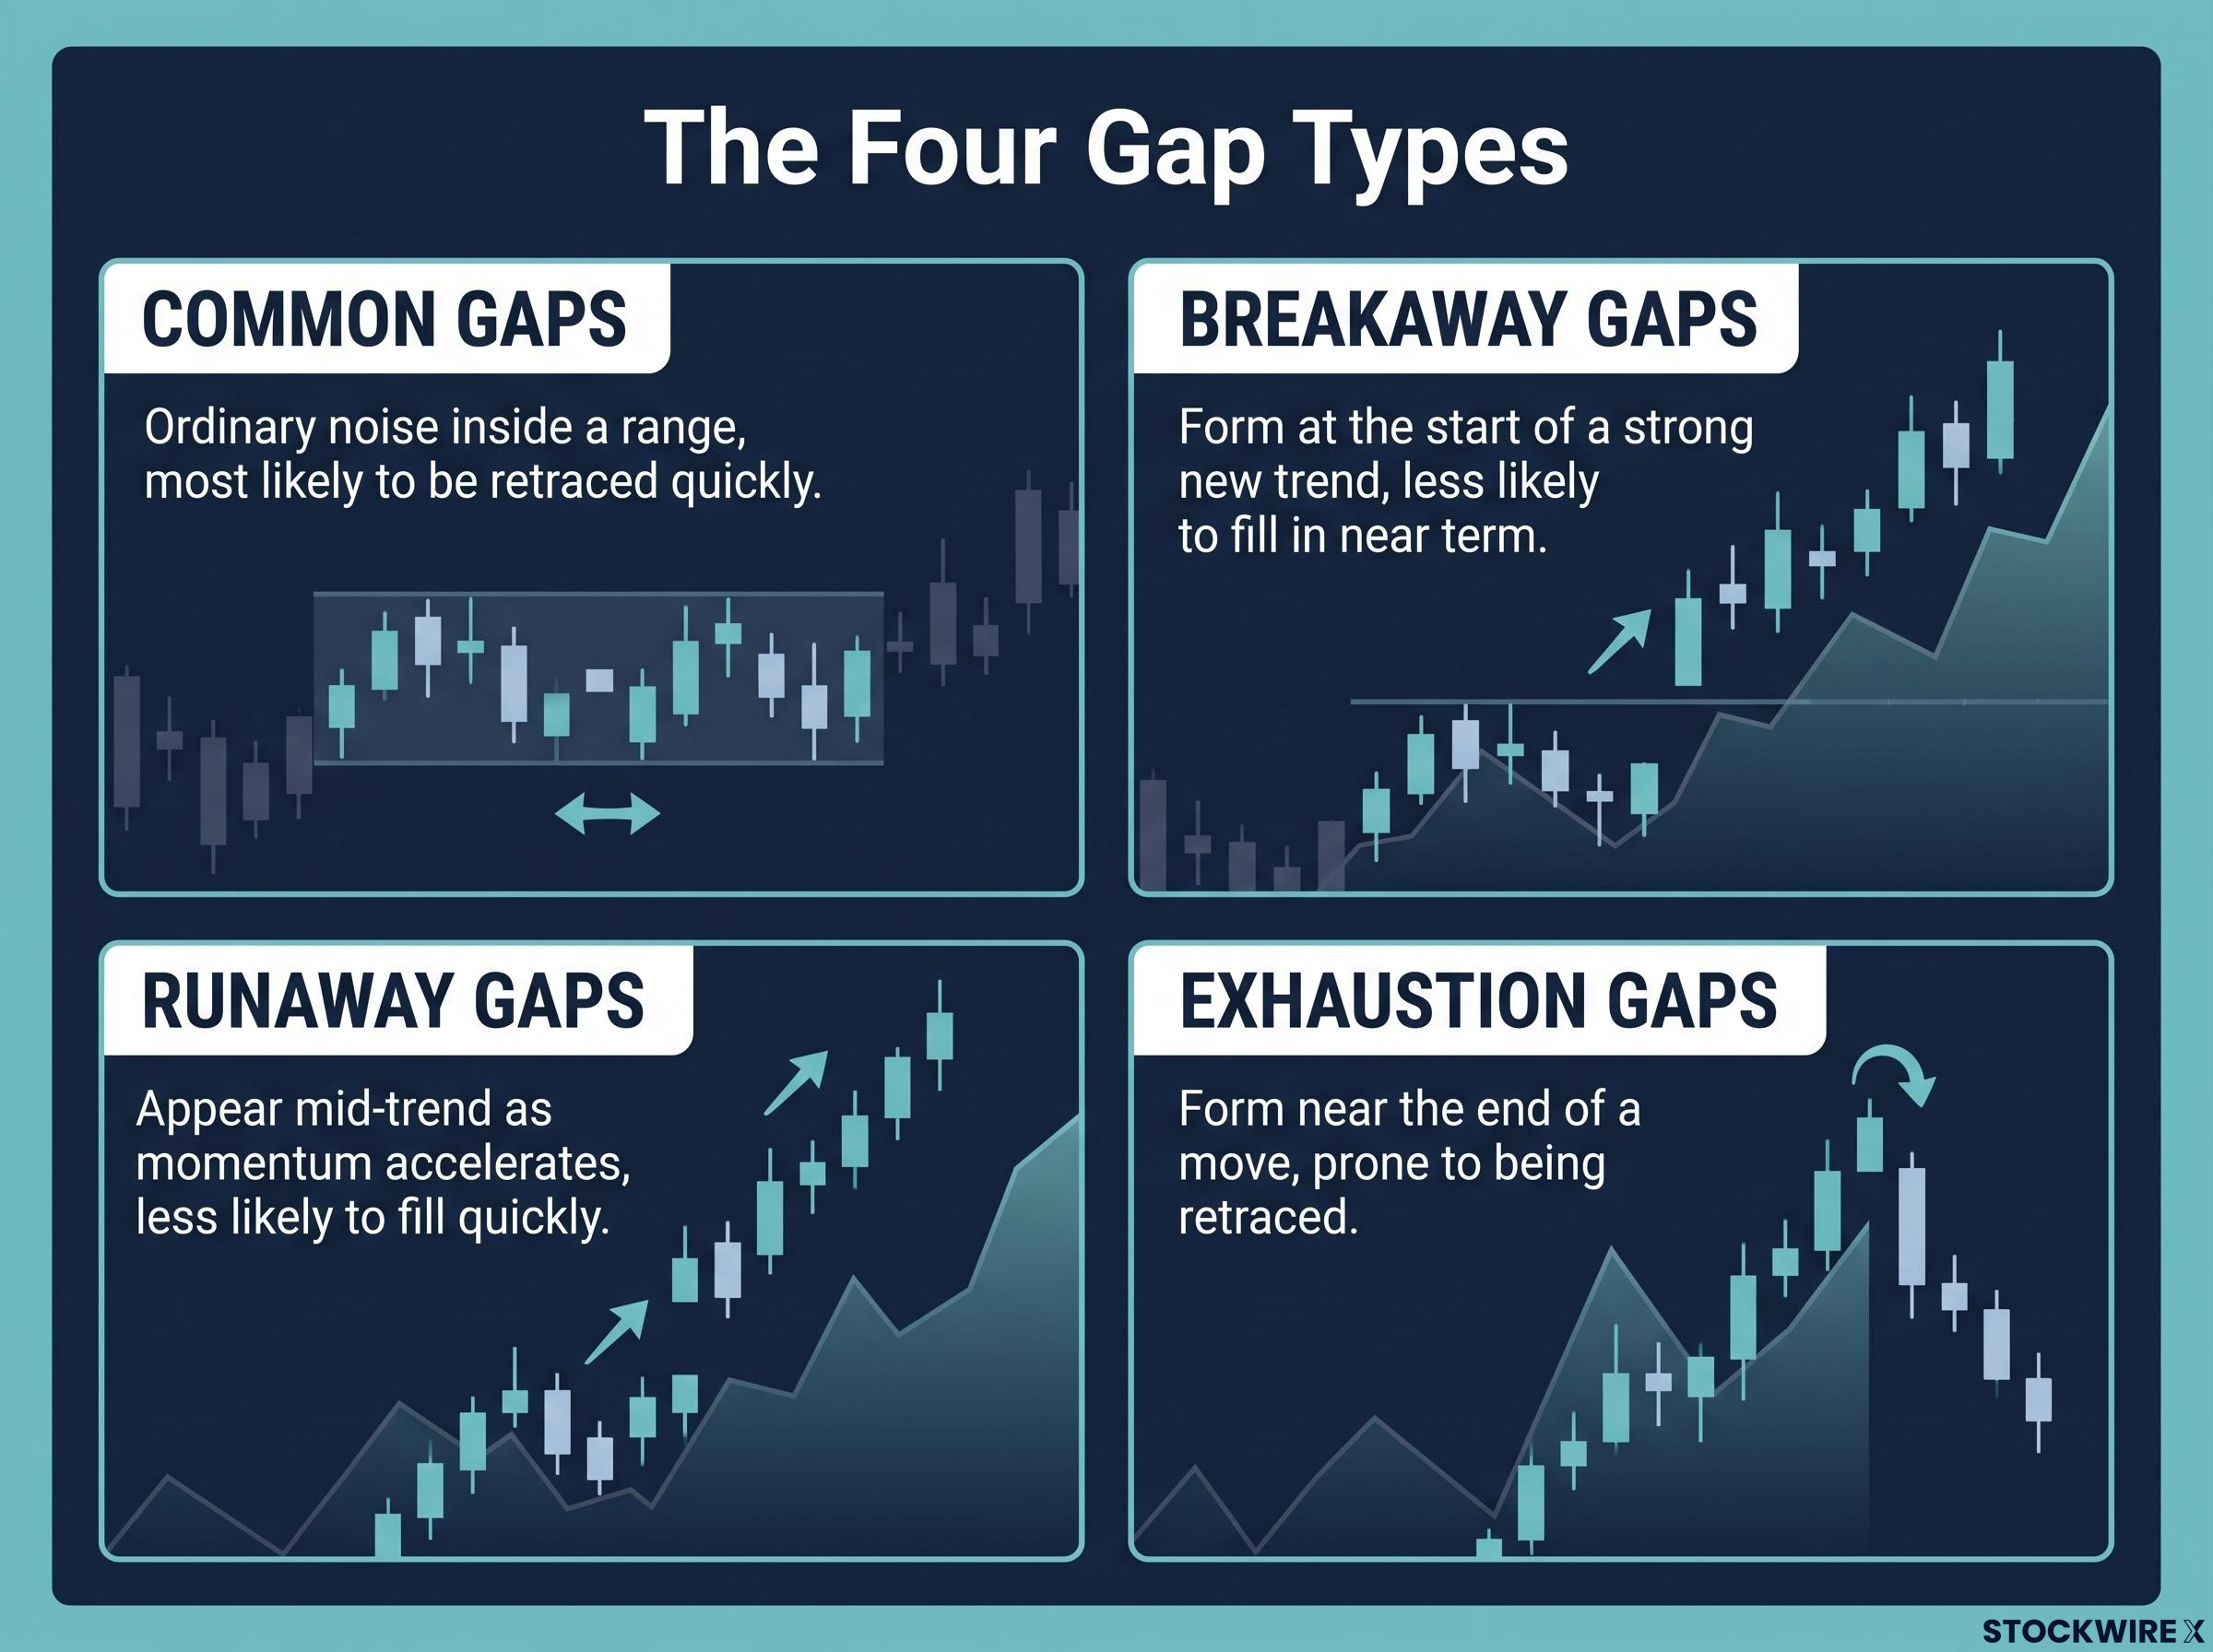
Here is why this matters for a stock like ARM. Momentum sectors produce a disproportionate share of breakaway and runaway gaps, precisely the two types least likely to fill on any useful timescale. A trader who fades every gap on the assumption that it must close is betting against the exact gap type these stocks generate most often. That reflex is one of the most common and costly misreads in retail technical trading.
When big ASX news breaks, our subscribers know first
What trendlines actually measure, and what it means when one breaks
An ascending trendline is drawn by connecting a series of higher lows. It is a visual record of buyer commitment: the pace at which buyers have repeatedly stepped in to defend the stock on every dip. As long as the line holds, that commitment is intact.
When the line breaks, it means buyers stopped showing up at the price they used to defend. Lumentum offers a live example of exactly that failure.
Lumentum had risen approximately 72% from its July lows and roughly 500% in under a year. During the session under review, it broke below its key ascending trendline, and it did so with two other bearish signals firing at the same moment.
- Trendline breach: The stock fell through the rising line connecting its higher lows.
- Prior week’s low breach: It broke beneath the previous week’s floor in the same move.
- Downside gap fill: A small gap below the price closed during the breakdown.
The overvaluation concern Lawton at Verified Investing cited Lumentum’s approximately 500% appreciation in under one year as the basis for a longer-term view that the stock remains overvalued, regardless of the near-term chart.
Here is what a 500% run means for the psychology behind that break. Every holder who bought before the recent peak is sitting on embedded profit. A trendline crack is the signal that enough of those holders decided to lock in that profit at once, and their selling is what pushed the line to give way.
For reference points on where the selling might pause, the setup identified two levels below.
| Level type | Price zone | Significance |
|---|---|---|
| Potential bounce area | Near $750 | Possible spot for a short-term technical rebound after the breakdown |
| Key support zone | Near $840 | Higher support level watched as the first line of defence |
The Lumentum case shows why even a compelling growth story can produce a brutal near-term drawdown once the technical structure fails. Spotting the trendline crack early narrows your decision to one question: do you wait for a confirmed support level to hold, or act on the break itself?
The head-and-shoulders pattern: what the research actually says about reliability
Credo Technology (CRDO) gives you the pattern on a live chart. The stock had closed higher by 10% and then 7.7% in back-to-back sessions, then reversed for an intraday drop of approximately 10% that erased the entire rally. On the chart, that reversal formed a head-and-shoulders pattern: a peak (the head) flanked by two lower peaks (the shoulders), sitting above a support line called the neckline. Lawton noted the neckline would likely act as resistance on any recovery attempt, with further selling possible if the stock failed to reclaim it.
The pattern is treated as one of the most reliable reversal signals in technical analysis. What “reliable” actually means, though, depends entirely on how strictly you define the pattern.
| Source | Year | Reported success rate | Key condition |
|---|---|---|---|
| Titan FX | 2025 | 93% (tops); retail 55-70% | Bulkowski data, 38,500+ examples, strict criteria |
| TickerDaily | 2026 | 54%, avg 15% decline | 16,500 patterns, less-filtered |
| Strike.money | 2026 | 57% (57 wins, 43 losses) | 100-pattern internal test |
| Quantified Strategies | 2024 | 93%; 20-30% false breakouts broadly | 431 patterns, narrow definition |
| Tradervue | 2026 | 60-80% | Varies with conditions and asset class |
The gap between 54% and 93% is the most useful thing on that table. It is not a question of which study is correct. Titan FX (2025) cites Bulkowski’s 93% figure across more than 38,500 examples, but only under strict conditions, including volume confirmation and target discipline. The same source notes that retail traders applying looser criteria realise closer to 55-70%. The higher numbers are not wrong; they simply assume a level of rigour most traders never apply. That gap in discipline is where most retail losses in pattern trading actually happen.
Five factors that separate a real break from a fakeout
Professional guidance across 2024 to 2026 sources converges on five confirmation checks, applied roughly in this order:
- Trend context: A top pattern is only trustworthy after a genuine prior uptrend. Without that context, the shape is just noise dressed up as a signal.
- Neckline quality: A clean, repeatedly tested neckline is far more reliable. A choppy or shallow one produces more false breaks.
- Volume confirmation: A decisive rise in volume on the neckline break is a core confirmation. A break on thin volume is where fakeouts breed.
- Confluence with other indicators: Agreement from moving averages, RSI, or MACD raises the odds. A pattern that fires alone is weaker than one backed by other tools.
- Measured-move discipline: Use the head-to-neckline distance to set a realistic target. Ignoring this step turns a probabilistic setup into a guess.
A reader who knows the headline 93% assumes all five of these are in place will treat a CRDO-style setup very differently from one who reads “93% success rate” and acts on it blind.
Where technical analysis earns its keep, and where it breaks down in AI semiconductor stocks
Chart patterns carry extra hazard in exactly the stocks discussed here. ARM’s 22% three-session surge and Lumentum’s 500% run are the kind of momentum regimes where classical reversal rules face their toughest test, because these stocks routinely produce the breakaway gaps and runaway trends that reversal signals are worst at reading.
Three specific risks stack up in high-momentum AI semiconductor names:
- Algorithmic fakeout frequency: Titan FX (2025) notes that post-2008 algorithmic trading has raised the number of false signals during the confirmation phase of patterns, pushing effective failure rates above the classic study figures.
- Breakaway gap dynamics: Momentum leaders generate the gap types least likely to fill, making a mechanical gap-fade structurally dangerous.
- Earnings-driven re-ratings: A shift in AI-cycle sentiment, export-control policy, or earnings expectations can reprice one of these stocks overnight, invalidating a chart setup that would otherwise carry high historical reliability.
None of that makes chart reading useless. Intel shows the constructive case. A technical gap and support zone was identified near $108.60 as a preferred entry level, an example of how a chart level can time an entry even when the fundamental thesis is already set.
Timing tool, not decision system The CMT Association and institutional broker guidance both point the same way: technical signals work best for timing entries and exits around levels that fundamentals-focused investors have already flagged as significant. They are weakest when used as standalone decision engines in a strong trend.
In a stock like ARM or Lumentum, a trendline break or an unfilled gap tells you something real about short-term positioning. What it cannot tell you is whether the underlying business has changed. Conflating those two signals, treating a chart wobble as a verdict on the company, is where the largest errors get made.
Knowing when a technical signal is working with the trend versus fighting a structural one is the difference between using chart reading as a genuine edge and using it to rationalise a trade you had already decided to make.
Reading charts in a momentum market: the discipline that makes the difference
The three patterns covered here work best as questions, not commands. A gap asks whether unfinished business will pull price back. A trendline break asks whether buyer commitment has failed. A head-and-shoulders pattern asks whether sentiment has turned. Each is a hypothesis to test, not a trade to fire.
The distance between a 54% and a 93% success rate lives almost entirely in whether you confirmed the setup before acting. So before trading any of these three patterns, run the same short checklist:
- Identify the gap type. A common or exhaustion gap behaves nothing like a breakaway gap in a strong trend.
- Check trendline quality. Count the prior tests. A line touched many times carries more weight than one drawn through two points.
- Confirm volume on the break. A neckline or trendline break on thin volume is where fakeouts live.
The mindset that matters Patterns are probabilistic signals, not guarantees. The readers who use technical analysis effectively treat every setup as a hypothesis to confirm, never a certainty to execute.
This article is for informational purposes only and should not be considered financial advice. Investors should conduct their own research and consult with financial professionals before making investment decisions. Past performance does not guarantee future results, and technical patterns are subject to market conditions and various risk factors.