Right now, Australian investors are watching more recession signals than at almost any point in recent memory. Corporate insolvencies, the Sahm Rule, lipstick sales, protein substitution at the supermarket, the shape of the yield curve. The paradox is that this abundance of data may be making forecasts worse, not better, because several of these signals may be measuring the same thing wearing different clothes.
The current picture is genuinely mixed. Unemployment is edging up but has not breached recession-detection thresholds. Insolvencies are elevated. The yield curve is not inverted. Consumer sentiment is subdued. This is not a clean read in either direction, and that ambiguity is exactly when cognitive biases do their most damage.
What follows gives you a clear framework for reading these signals without letting prior expectations do the work. You will learn what each indicator actually measures, how reliable it is in the Australian context, and whether the next signal you encounter is adding genuinely new information or just reinforcing what you already believe.
What Australian recession indicators are actually measuring right now
Start by laying the pieces on the table before doing any analysis with them. The most recent labour data comes from the Australian Bureau of Statistics (ABS), whose “Labour Force, Australia, August 2026” release, published on 24 September 2026, put seasonally adjusted unemployment at 4.6% and underemployment at 6.2%.
The ABS Labour Force release for August 2026 is the primary source for the 4.6% unemployment and 6.2% underemployment figures cited throughout this analysis, and reading its accompanying methodology notes helps you understand precisely which workers each measure counts and which it excludes.
That is a softening, not a collapse. And to judge whether it matters, you need to know what each indicator was built to detect.
The labour market: softening or stalling?
Unemployment has stepped up gradually through 2026, from 4.3% in March to 4.6% in August. The move is real but slow.
This is where the Sahm Rule comes in. Developed by economist Claudia Sahm, it flags that a recession has likely already begun when the three-month average unemployment rate rises 0.5 percentage points above its lowest point in the prior 12 months. The Reserve Bank of Australia (RBA) applies a higher 0.75-point threshold domestically.
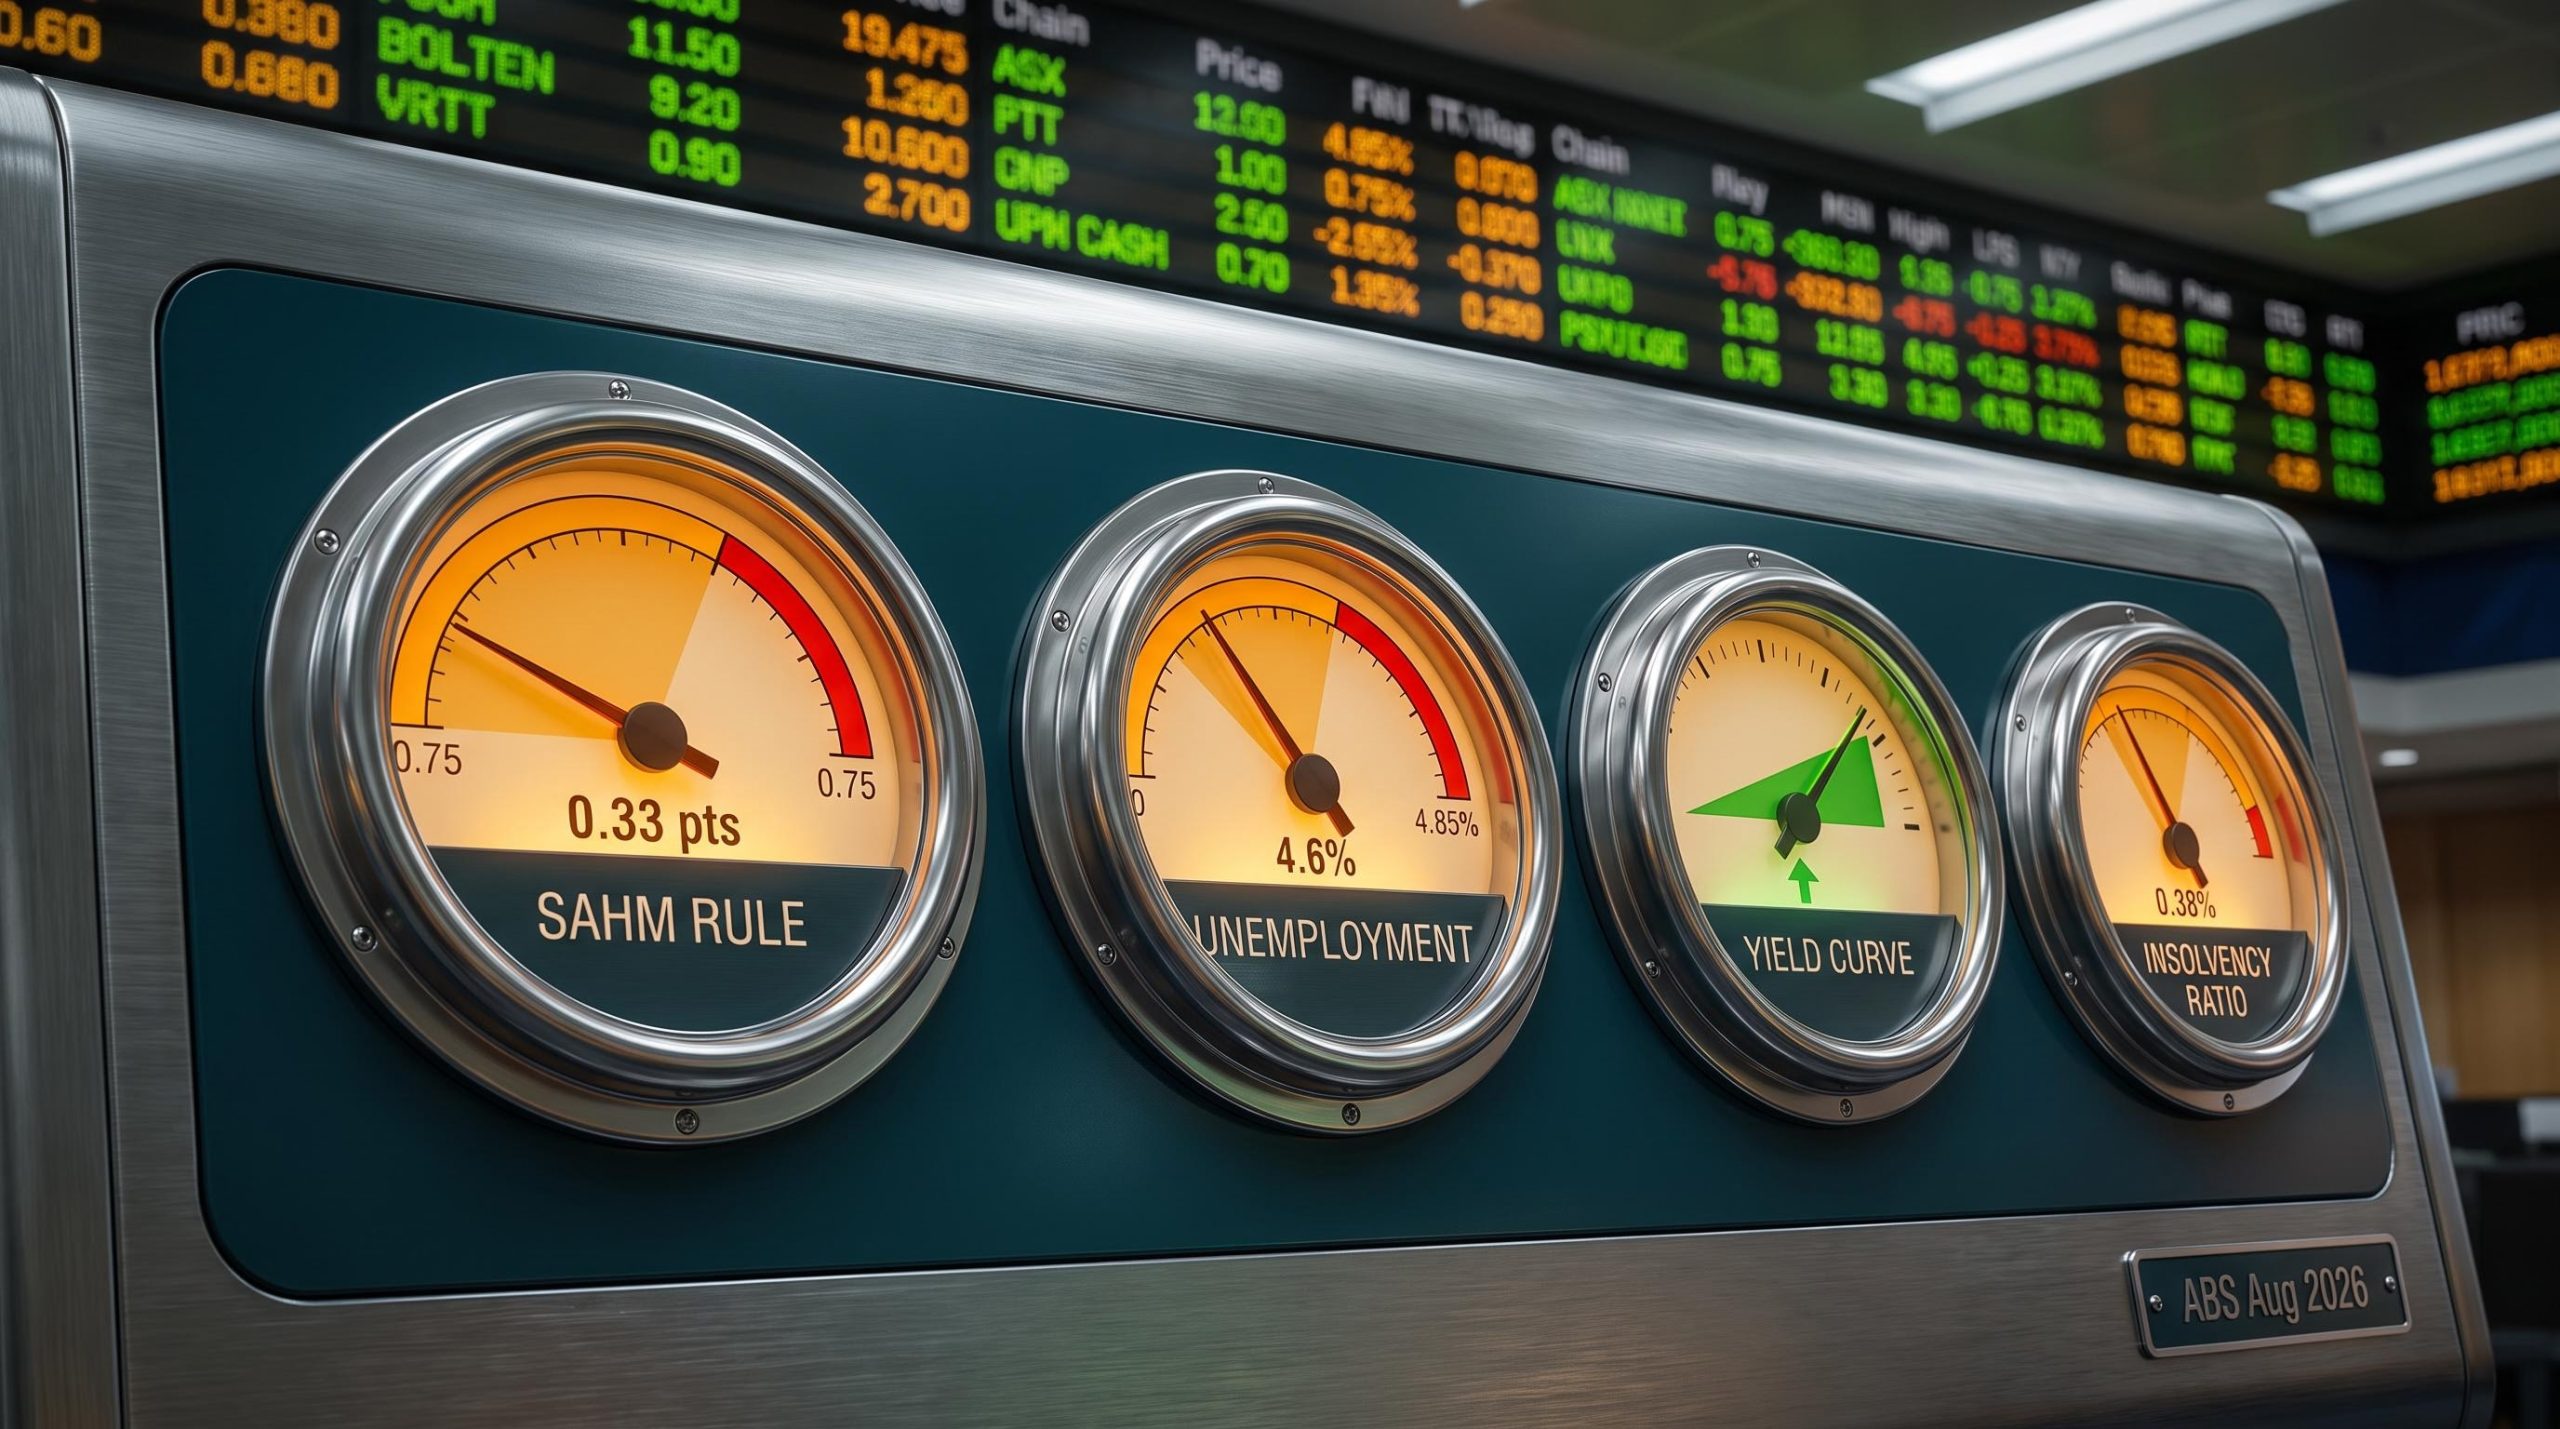
Australia’s three-month average unemployment for July 2026 sat at roughly 4.43%, against a 12-month low of 4.1%. Neither the US 0.5-point nor the RBA 0.75-point trigger has been breached. For the RBA-adapted version to fire, unemployment would need to reach around 4.85%.
Then there is the definitional wrinkle. Roy Morgan’s broader “real unemployment” series put the August figure at 11.7%, against the ABS 4.6%. Same economy, wildly different number, purely because of how joblessness is defined. That gap is your first clue that the signal you read often depends on the ruler you pick.
Yield curve and insolvencies: elevated, not extreme
The yield curve was not inverted as of September 2026. An inversion happens when short-term interest rates climb above long-term ones, a pattern historically linked to US recessions. Its absence does not guarantee calm, but it does remove one of the loudest alarm bells from the current mix.
On the corporate side, the ASIC Corporate Insolvency Update dated 13 August 2026 reported that over the year to 31 May 2026, 0.38% of Australia’s 3,724,139 registered companies entered external administration. That is a non-trivial share, but without comparable historical ratios to hand, it is elevated rather than clearly accelerating.
The ASIC insolvency statistics portal publishes weekly updates on companies entering external administration, giving you access to the running data behind the 0.38% ratio cited here and the ability to track whether that figure is accelerating as new monthly counts are released.
| Indicator | Current Reading | Trigger Threshold | Australian Status |
|---|---|---|---|
| Unemployment (ABS) | 4.6% (Aug 2026) | RBA Sahm: 4.85% | Not triggered |
| Sahm Rule (3-mth avg) | 4.43% vs 4.1% low | +0.75 points | Not triggered |
| Yield curve | Positive slope | Inversion | Not inverted |
| Insolvency ratio | 0.38% (yr to May 2026) | No fixed trigger | Elevated |
None of the headline thresholds have formally been breached. Read that not as reassurance but as an invitation. A near-miss tells you something different from a clean miss, and knowing where the data actually sits, rather than where the coverage implies it sits, is your first defence against reading your own fears into the numbers.
When big ASX news breaks, our subscribers know first
Why behavioural economists think your brain is wired to misread these signals
Now shift the focus from the economy to the person reading it. Because the greater risk here is not that the data is scary, but that your own reasoning is primed to distort what you just read.
Confirmation bias is the tendency to seek out evidence that supports what you already believe and discount evidence that does not. In recession forecasting, an investor who already feels financially stretched is primed to notice every confirming signal and wave away the reassuring ones.
Confirmation bias operates most destructively when investor sentiment is already skewed in one direction, because the prior emotional state determines which evidence gets noticed and which gets discarded before conscious analysis begins.
That matters right now because the behavioural environment is already tilted. A Morningstar survey of Australian investors found that the most common self-described sentiment was “cautious.”
The behavioural baseline When the most prevalent investor mindset is already “cautious,” ambiguous data is more likely to be read as recession-confirming. The data itself becomes less predictive than the prior beliefs of the people reading it.
Four cognitive mechanisms do most of the damage. Work by Daniel Kahneman and Amos Tversky first mapped these traps, and later behavioural-finance researchers Hersh Shefrin and Nicholas Barberis showed how they play out in markets.
- Motivated reasoning: You start with a preferred story (“a downturn is coming”) and interpret each new data release to fit it, rather than updating your view.
- Availability and salience bias: Vivid indicators like an inverted curve or a viral lipstick-sales chart are easy to recall, so you over-weight them against duller but sturdier signals.
- Representativeness and overfitting: You assume anything that looks like 2008 must end like 2008, and keep searching until the current data resembles a familiar crisis.
- Base-rate neglect: You forget how often similar signals, like yield-curve inversions or brief unemployment upticks, produced no recession at all.
Consider the US yield-curve inversion of 2019. Many treated it as near-certain proof of a recession within 12 to 18 months. A recession did follow, but it was driven by a pandemic shock the curve never signalled, not the cyclical downturn people had projected onto it.
Understanding which of these mechanisms is active in your own reading is not abstract psychology. It is the precondition for making portfolio decisions that reflect evidence rather than anxiety.
How correlated signals create an illusion of converging evidence
Here is the central trap. The more signals you collect, the more confident you feel, and that confidence is often false, because those signals frequently share the same root cause and are not independent votes.
Search economic data broadly enough and something alarming will always turn up. Stop looking the moment you find confirming evidence, and you have built yourself a biased sample without noticing.
Take the current Australian mix. Rising insolvencies, a cooling labour market, and subdued consumer confidence look like three separate recession warnings. But they largely respond to one driver: higher interest rates and cost-of-living pressure working through indebted households and leveraged businesses. That is not three independent signals. It is one signal with three faces.
Per capita recession conditions complicate the picture further: headline GDP growth masks a roughly 0.7% contraction in output per person across 2025, which is why insolvency figures and household spending data can look alarming even when the aggregate number stays positive.
Official commentary has long resisted single-indicator calls for exactly this reason. The RBA’s “narrow path” framing, associated with former Governor Philip Lowe in 2022-23, deliberately treated recession risk as the product of combined pressures rather than any one trigger.
One economy, two honest interpretations
The same data set can support genuinely opposite conclusions, and being aware of both is itself a guard against cherry-picking.
| Signal | Cyclical downturn reading | Structural adjustment reading |
|---|---|---|
| Insolvencies | Tightening is breaking indebted firms; failures are spreading | Failures concentrated in over-leveraged, low-productivity firms post-pandemic |
| Labour cooling | Hiring slows as firms brace for tougher conditions | Normalisation from extremely tight conditions to mid-4% unemployment |
| Consumer weakness | Households pull back in anticipation of a downturn | Cost-of-living squeeze forcing spending re-allocation, not collapse |
When you find three signals all pointing the same way, the disciplined question is not “how could I be wrong?” It is “are these three signals, or one signal with three labels?” That distinction is what separates rigorous recession analysis from anxiety-driven pattern-matching.
How reliable are consumer-behaviour proxies, and why do investors keep using them?
The popular alternative indicators deserve an honest audit, because their cultural fame runs well ahead of their track record.
The Lipstick Index is the famous one. Leonard Lauder, chairman of Estée Lauder, coined it in the early 2000s after noticing cosmetic sales climb during economic stress, on the logic that shoppers trade big luxuries for small affordable ones. Intuitive, memorable, and empirically shaky.
The failure modes are well documented:
- Fashion cycles and product innovation can lift sales during expansions, not just downturns.
- Premiumisation and promotional pricing confound the price and volume data.
- Spending has shifted toward skincare and wellness, breaking the historical pattern.
- Demographic and online-platform shifts change the baseline entirely.
Protein substitution follows the same arc. The idea is that squeezed households trade down from red meat to poultry, and there is anecdote to support it.
A frequently cited observation Richard Galanti, former Chief Financial Officer of Costco, noted in a 2023 earnings call that protein substitution patterns had appeared around prior downturns, with similar behaviour reportedly re-emerging into 2026.
The confounders are just as stubborn here:
- Long-running health and environmental trends drive red-meat substitution regardless of the cycle.
- Supermarket promotions and pricing shift volumes without signalling distress.
- Younger cohorts adopting different diets change baselines permanently.
So why do these indicators persist? Because they are vivid, intuitive and emotionally resonant, which makes them highly susceptible to availability bias. The very qualities that make them feel compelling to you are the ones that lead you to over-weight them relative to their actual predictive power. Treat them as colour on household sentiment, not as recession signals in their own right.
Why standard US recession rules need recalibration before you apply them in Australia
Even the most rigorous indicators can mislead Australian investors specifically, and understanding why gives you a durable scepticism that is precision rather than nihilism.
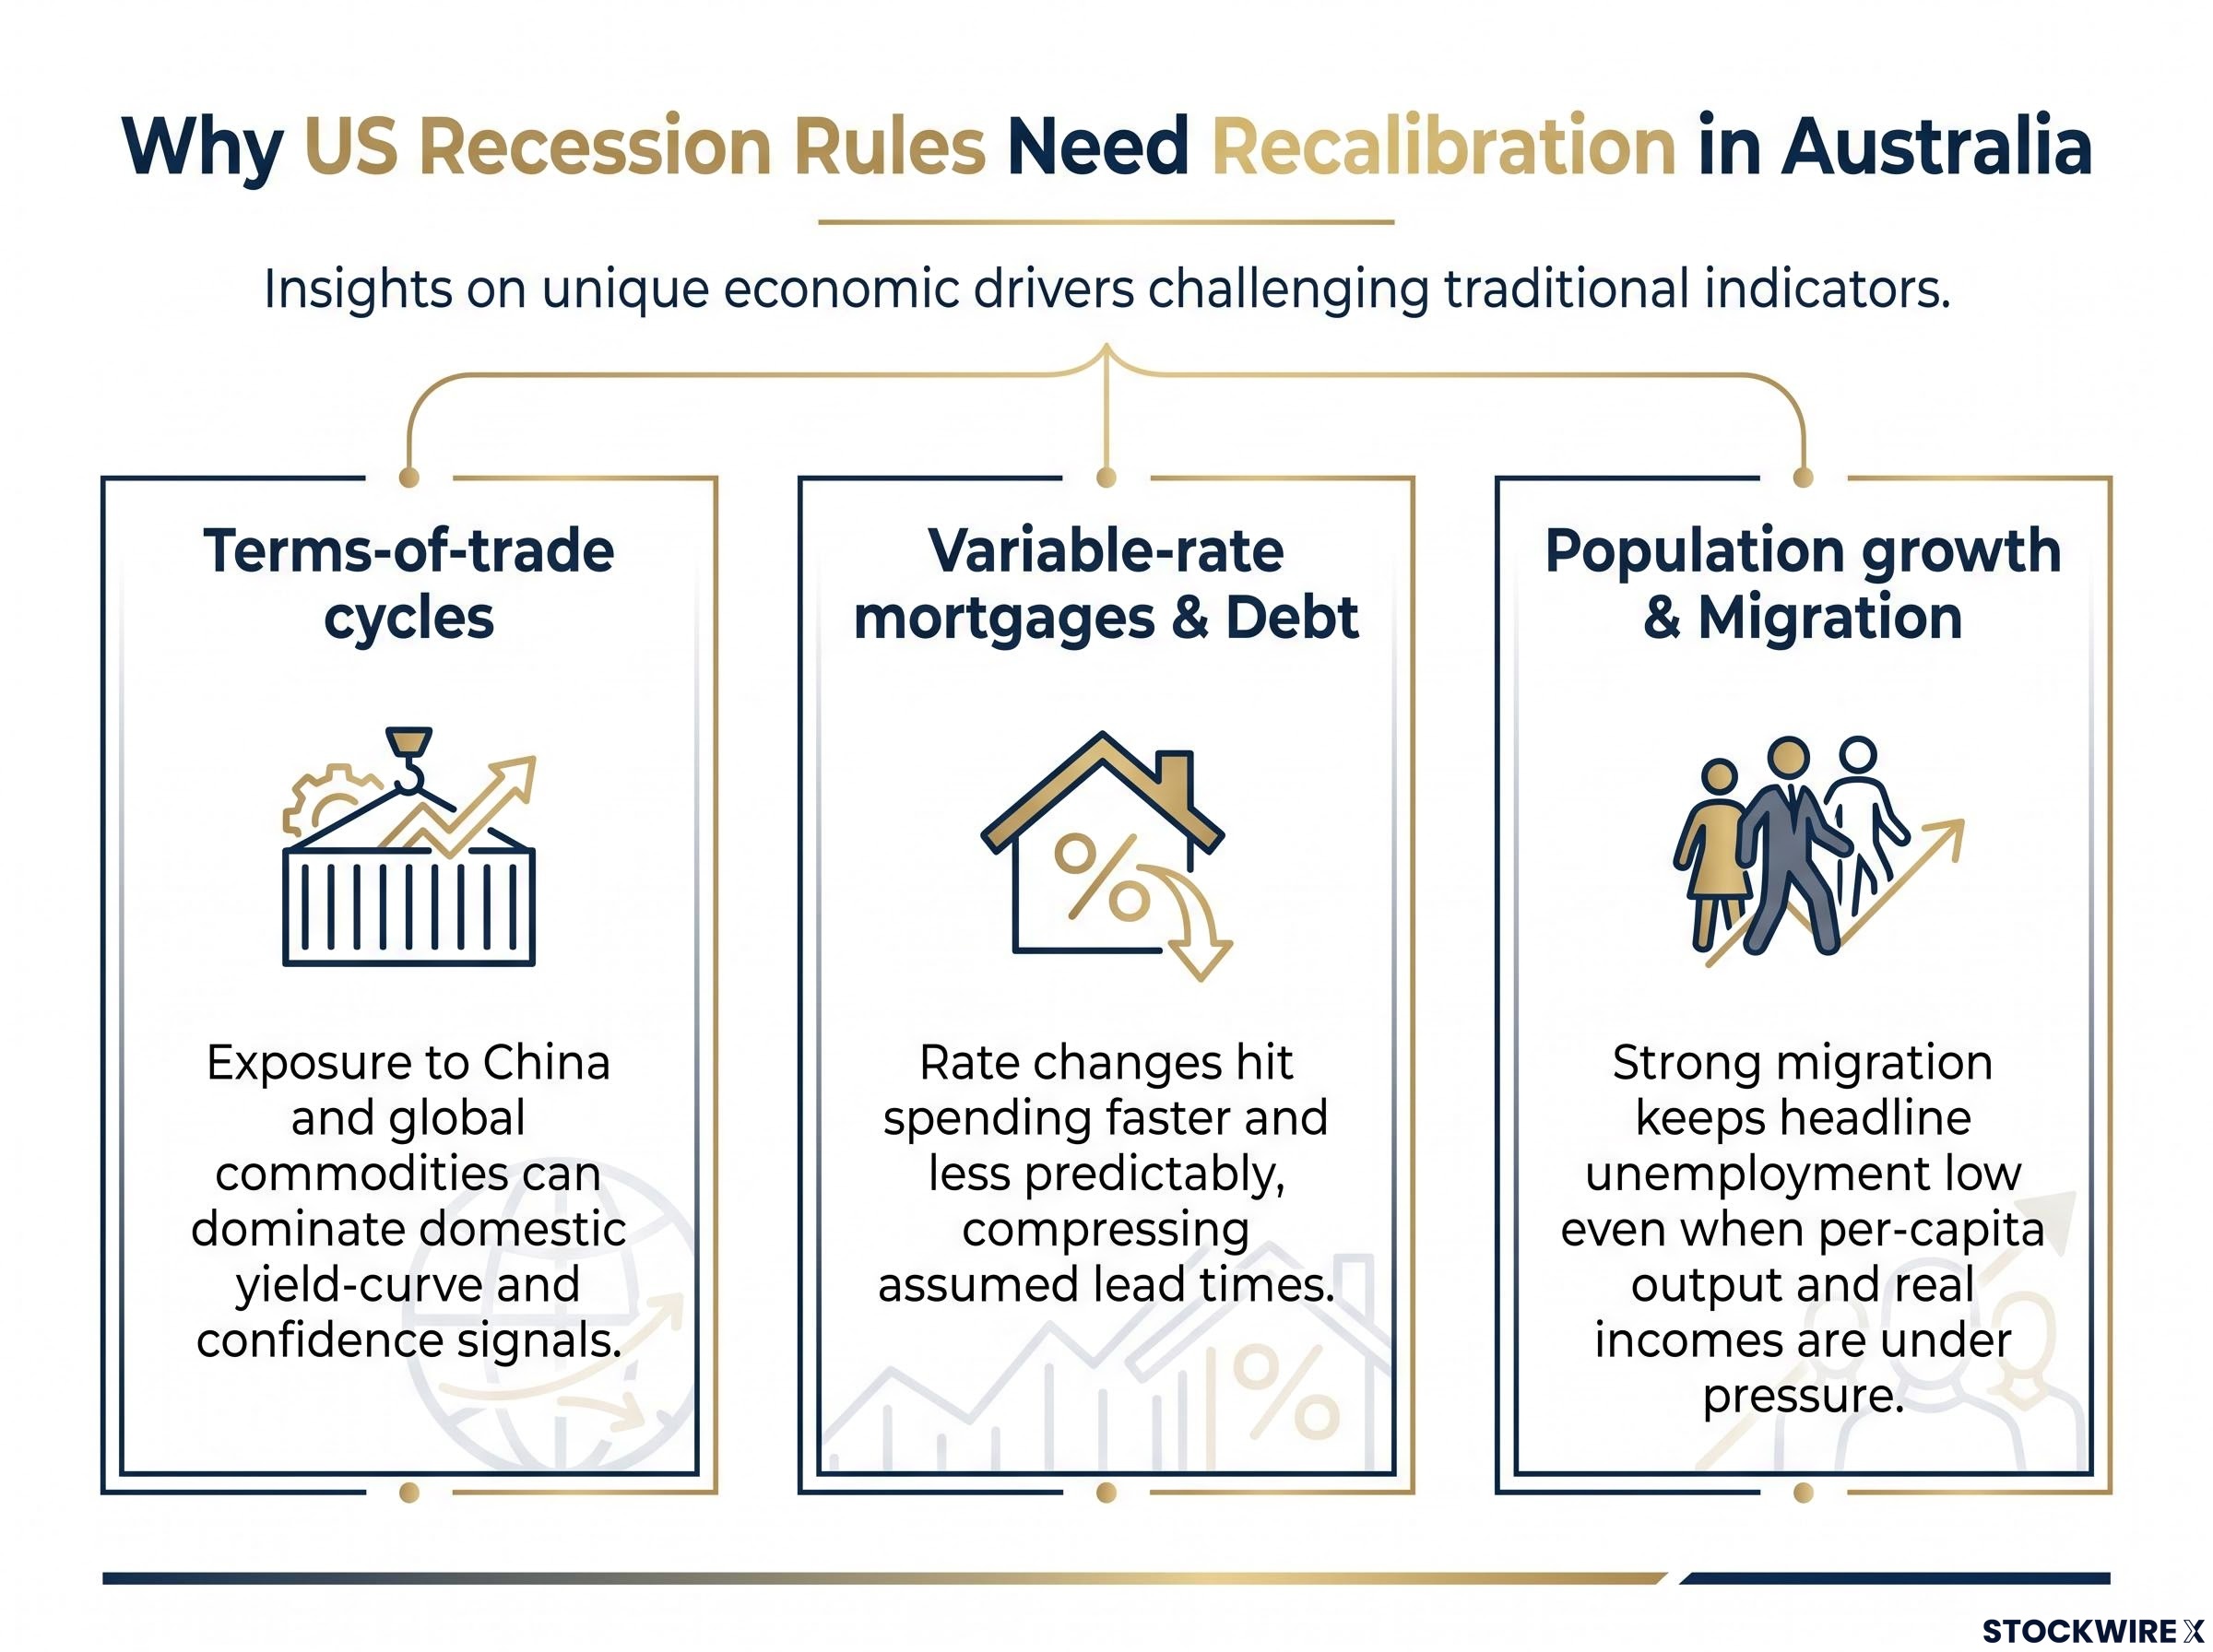
Australian bank economists have argued that US-calibrated indicators are structurally less reliable here for three reasons:
- Terms-of-trade cycles. Australia’s exposure to China and global commodities can dominate domestic yield-curve and confidence signals in ways US models never anticipate.
- Household debt and variable-rate mortgages. Rate changes hit spending faster and less predictably than in the US, compressing the lead time that yield-curve signals assume.
- Population growth and migration. Strong migration can keep headline unemployment low even when per-capita output and real incomes are under pressure, muting a rule like the Sahm.
The Sahm Rule and yield curve: what changes when you cross hemispheres
The RBA-adapted 0.75-point Sahm threshold is conceptually sensible, but it was calibrated on US data and is statistically less tested in the Australian context. It also carries a quieter risk: unemployment data gets revised, and revisions can retroactively change whether the rule was ever triggered. Treating a 0.76-point rise as fundamentally different from a 0.74-point rise ignores real measurement error.
The yield curve has its own local weakness. In a small, open economy, the slope is heavily influenced by global rates, risk appetite and term-premium dynamics rather than domestic credit conditions alone. Global risk events and structural changes in bond markets, including the legacy of quantitative easing, can flatten or steepen the local curve independent of what is happening to Australian households.
Term premia and yield levels interact with the yield curve in ways that can mislead investors who rely on the slope alone: the 2026 rise in Australian 10-year bond yields is driven primarily by real rates and budget dynamics rather than collapsing growth expectations, which changes the recession signal materially.
RBA officials have repeatedly stressed that no single indicator is sufficient for recession prediction in a small, open, commodity-exposed economy. If a rule was built on US data, calibrated on US institutions and tested against US cycles, applying it to an economy shaped by iron ore prices, variable-rate mortgages and migration requires you to carry an explicit adjustment factor, not just plug in the local number. That protects you from false precision: the feeling of rigour that comes from applying a quantitative rule to data it was never designed to handle.
Reading the mix without letting the mix read you
Pull it together and the picture as of late September 2026 is clear enough. The Sahm Rule is not triggered, the yield curve is not inverted, insolvencies are elevated but not classified as accelerating, and the labour market is softening only gradually.
Yet every condition that makes confirmation bias dangerous is present: mixed signals, cautious investor sentiment, and vivid alternative indicators competing for your attention. The risk is not that a recession is impossible. It is that a cautious investor, the most common type in that Morningstar survey, is already primed to find one everywhere.
A three-part discipline keeps the mix from reading you:
- Identify what each indicator actually measures before you react to it.
- Ask whether two apparently independent signals share a common cause, so you do not mistake one stress for three.
- Seek out the strongest contrary interpretation before you act on your preferred one.
The absence of a triggered threshold is not permission to dismiss the signals. It is permission to hold them more lightly than the most anxious reading demands, and to keep updating as new data arrives. The same signals will look different as conditions change, and your job is to update, not to confirm.
For investors wanting to translate the bias framework into concrete portfolio discipline, our full explainer on investing biases at the sell decision covers the four exit-stage mechanisms, including loss aversion and the disposition effect, with evidence on how predefined rules counteract reactive selling.
This article is for informational purposes only and should not be considered financial advice. Investors should conduct their own research and consult with financial professionals before making investment decisions.