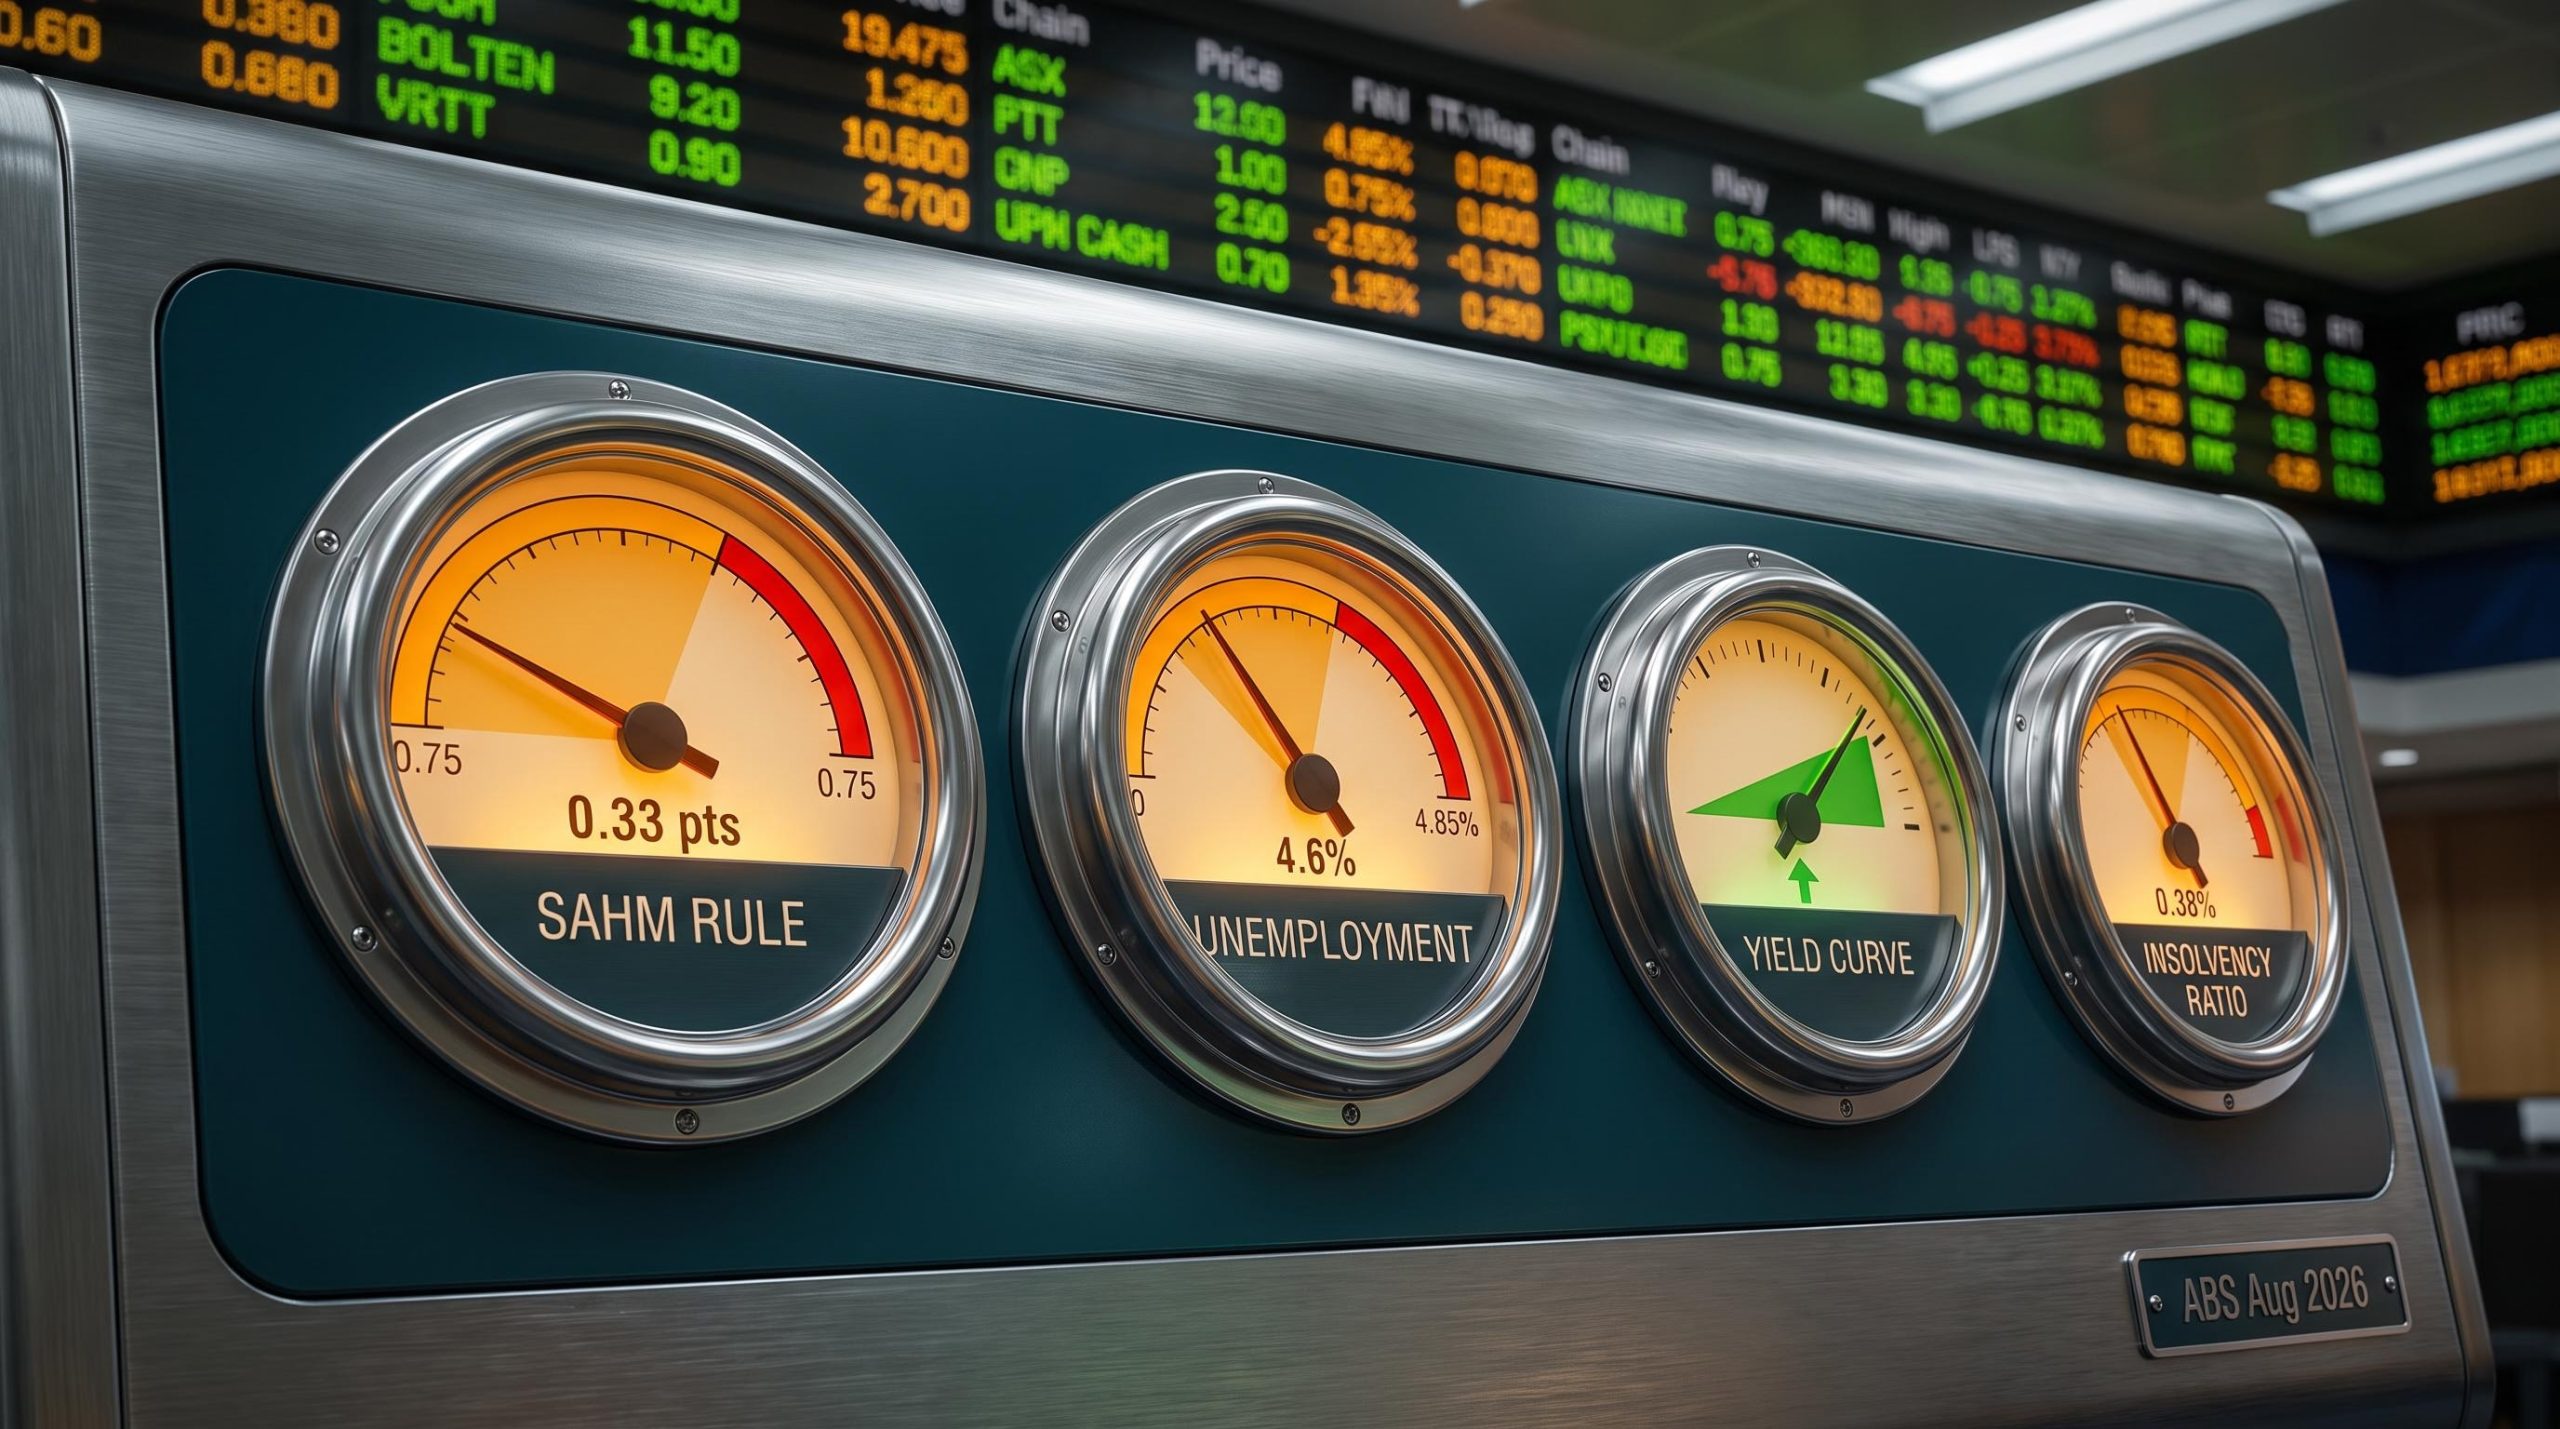
Here is a habit worth noticing in yourself. When a trade idea arrives, where does your attention go first? For most people, the answer is the instrument. You pull up a chart, you look at the pattern, you decide. Experienced futures traders do almost the opposite. They spend the bulk of their analytical effort long before a single ticker is on the screen.
That inversion is not a quirk. It reflects a specific view of how markets work, and the last eighteen months have made the view hard to argue with. The Federal Reserve cut rates three times in 2025, the March 2026 BIS Quarterly Review flagged a sharp rise in single-stock volatility beneath calmer index readings, and there were stretches where the major US indexes pulled in opposite directions. Undisciplined trade selection got punished in exactly those conditions.
This is the case for a top-down trading framework: a replicable process that filters out noise before you commit capital. By the time you finish this, you will be able to trace a trade idea through the same layers professionals use, from central bank policy all the way down to instrument choice, instead of starting at the instrument and reasoning backward.
Why professional traders start with central bank policy, not stock charts
The single most important trading decision often gets made before a chart is ever opened. That sounds backwards until you understand what central bank policy actually controls: it sets the volatility regime, the trend structure, and the sector correlations that every downstream decision inherits.
Raghee Horner, Managing Director of Futures Trading at Simpler Trading, applies this macro-first lens no matter what she is trading. She is product-agnostic by design, moving between futures, spot foreign exchange (FX), stocks, and ETFs. Her instrument selection criterion is not asset class but liquidity, the ease with which you can enter and exit a position without moving the price against yourself. FX is her benchmark for liquidity quality.
The logic runs one direction only. When rates, inflation expectations, and balance-sheet policy shift, equity beta, sector correlations, and implied volatility all move together. Read the regime first, and you already know whether to favour options or futures, swing trades or day trades, before you size anything.
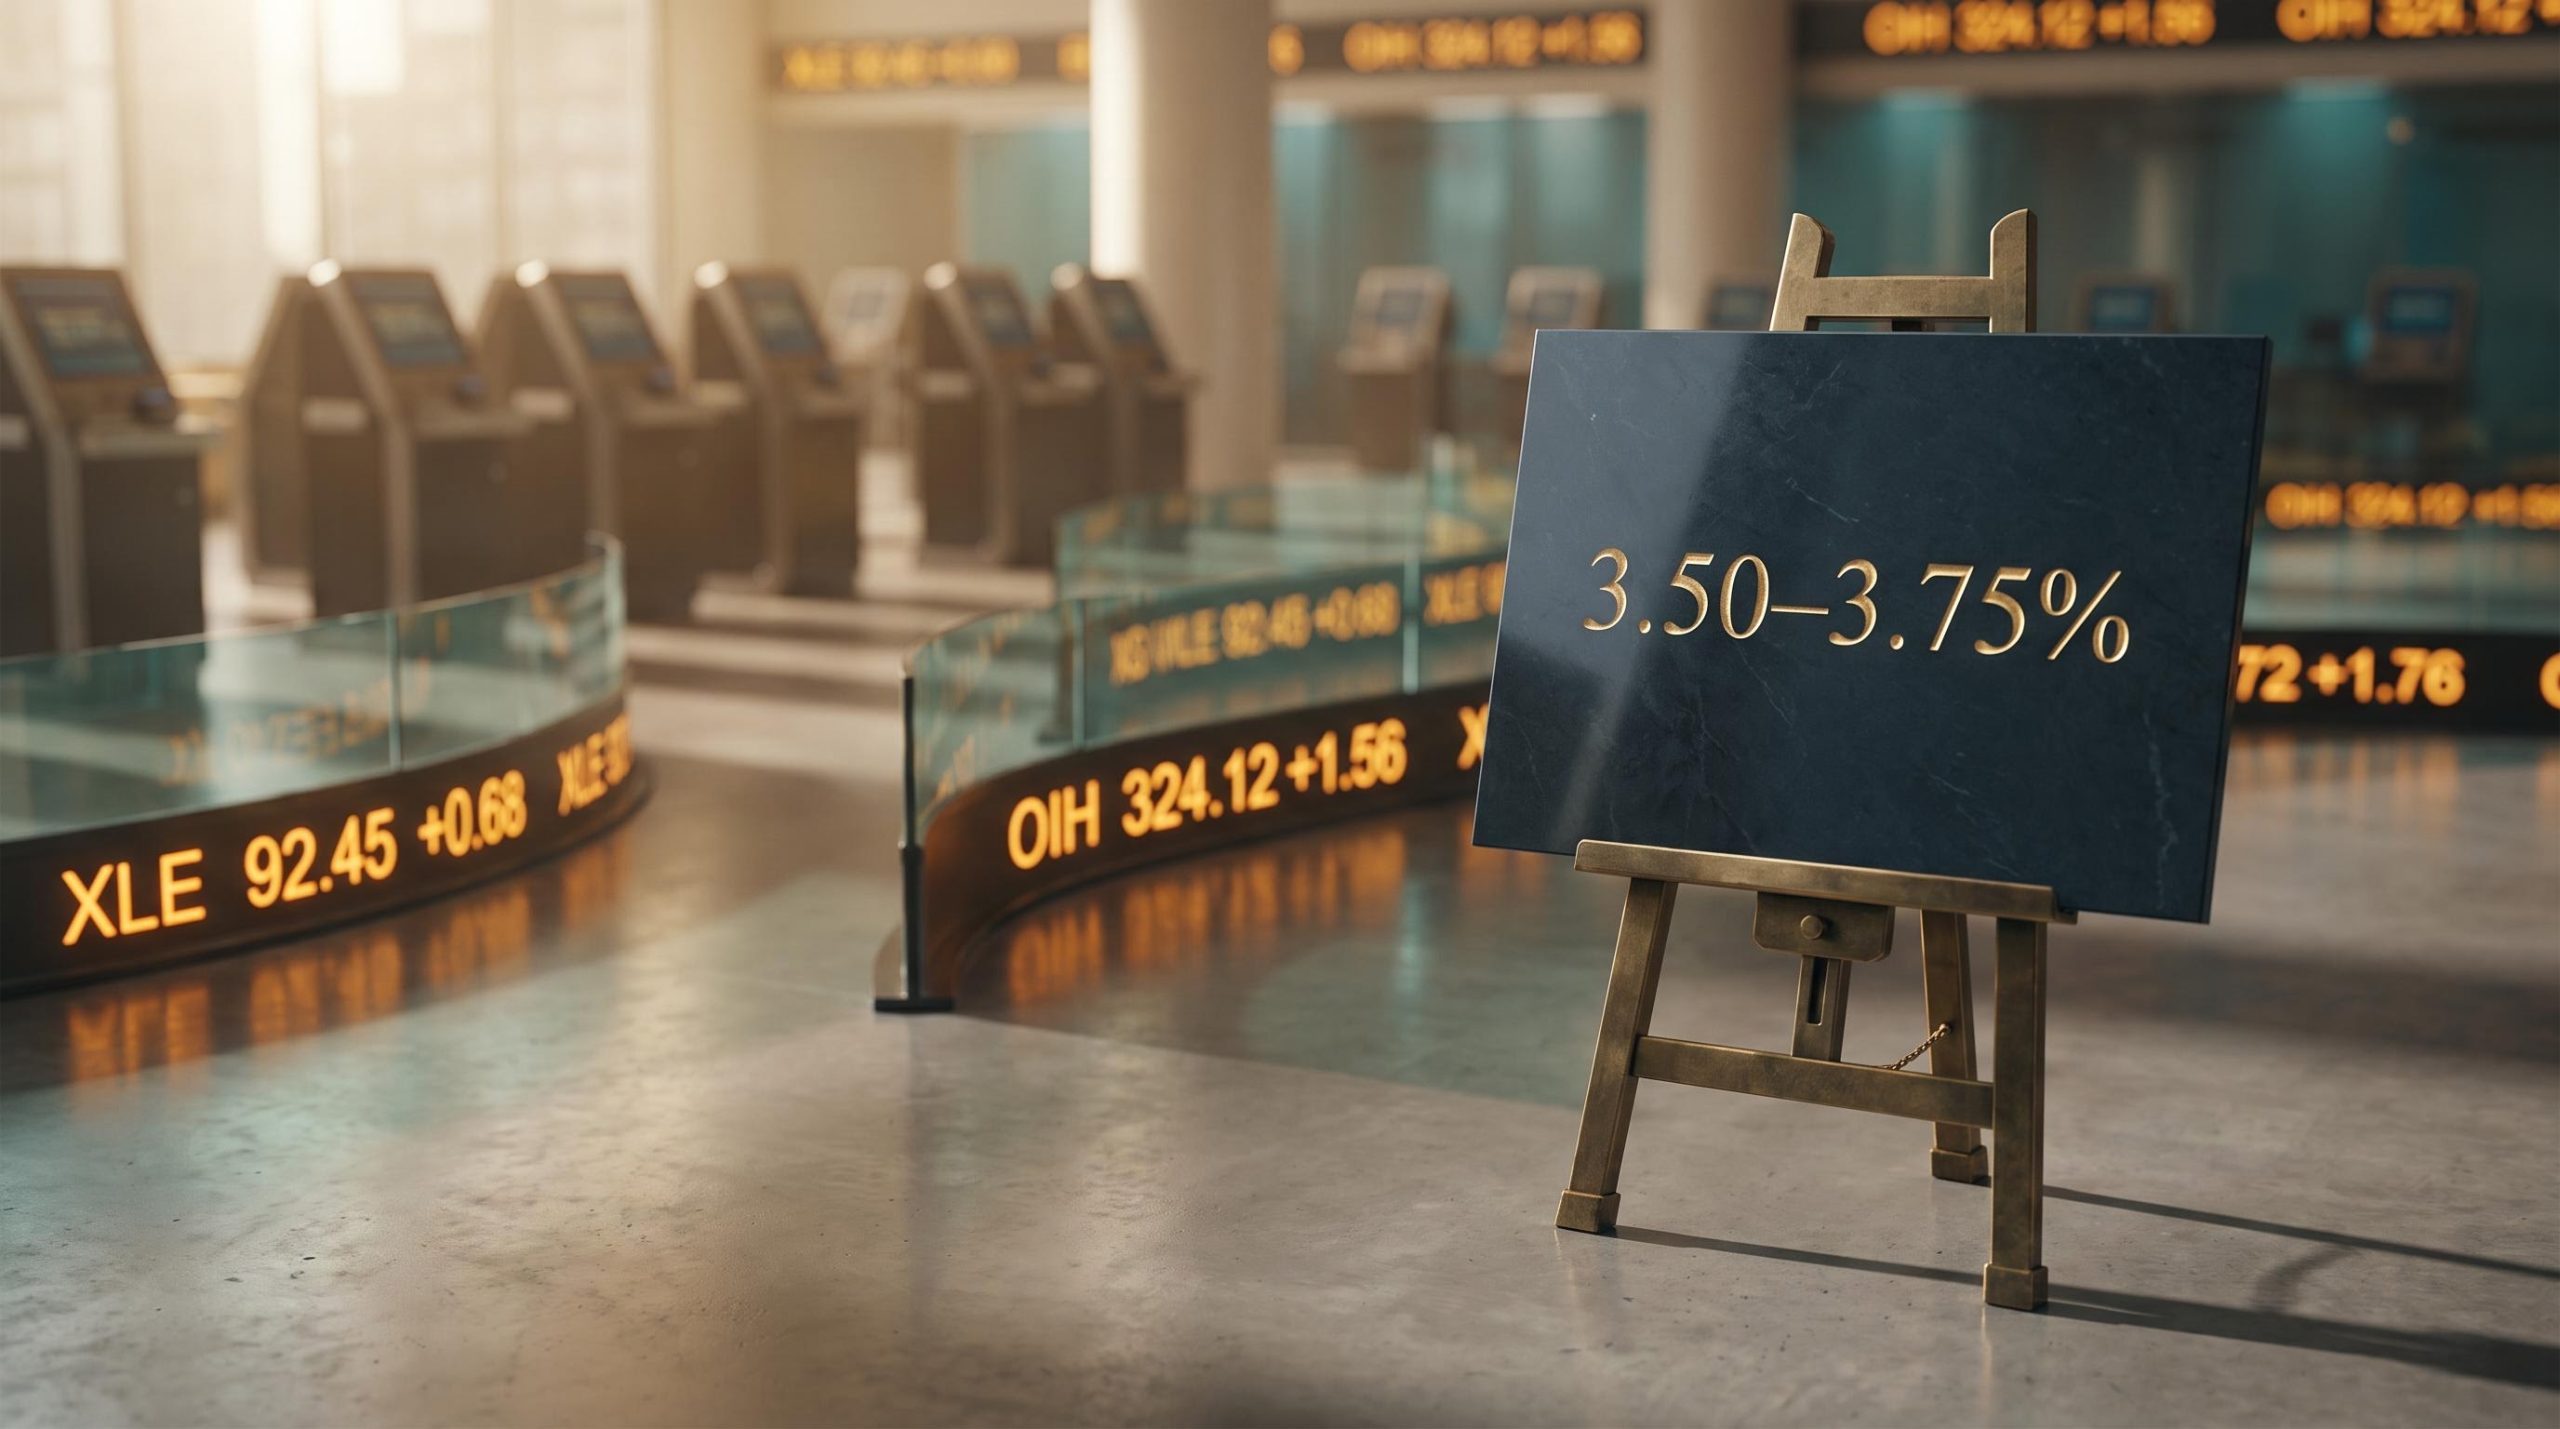
The Fed’s own path over 2025 shows why this matters. The federal funds rate started the year at 4.25-4.50% and finished at 3.50-3.75% after cuts in September, October, and December. Chair Jerome Powell had signalled the turn in August.
The FOMC structure determines whose voices actually move markets: only 12 members vote at any given meeting, and public commentary from non-voting regional presidents carries context rather than binding policy weight, a distinction that matters when you are using Fed communications to set your macro filter.
“Now 100 basis points closer to neutral than it was a year ago,” Powell said of the policy rate on 22 August 2025, framing the shift from restrictive policy toward cautious easing.
A trader who updated their macro filter in mid-2025 was operating in a genuinely different regime from one who did not. That gap in awareness translates directly into which strategies carry acceptable overnight risk and which quietly do not.
What skipping the macro filter actually costs you
Skip the macro layer and you tend to repeat one of three patterns that professionals recognise on sight:
- Structurally long in the wrong sectors. Buying high-beta growth into a tightening cycle exposes you to both valuation compression and adverse rotation, even when your individual stock pick is sound.
- Sizing for the wrong volatility. Position for a calm regime in a volatile one and a single Fed event can produce gaps large enough to force liquidation.
- Hidden concentration risk. A stack of positions that are all effectively the same macro bet only looks diversified until a policy shock hits every one of them at once.
Each of these is avoidable. Checking the macro filter first is the check that avoids them.
When big ASX news breaks, our subscribers know first
What the top-down framework looks like in practice, layer by layer
Walk through the process the way a practitioner actually experiences it and each step justifies itself. You do not start at the stock. You start wide and narrow down.
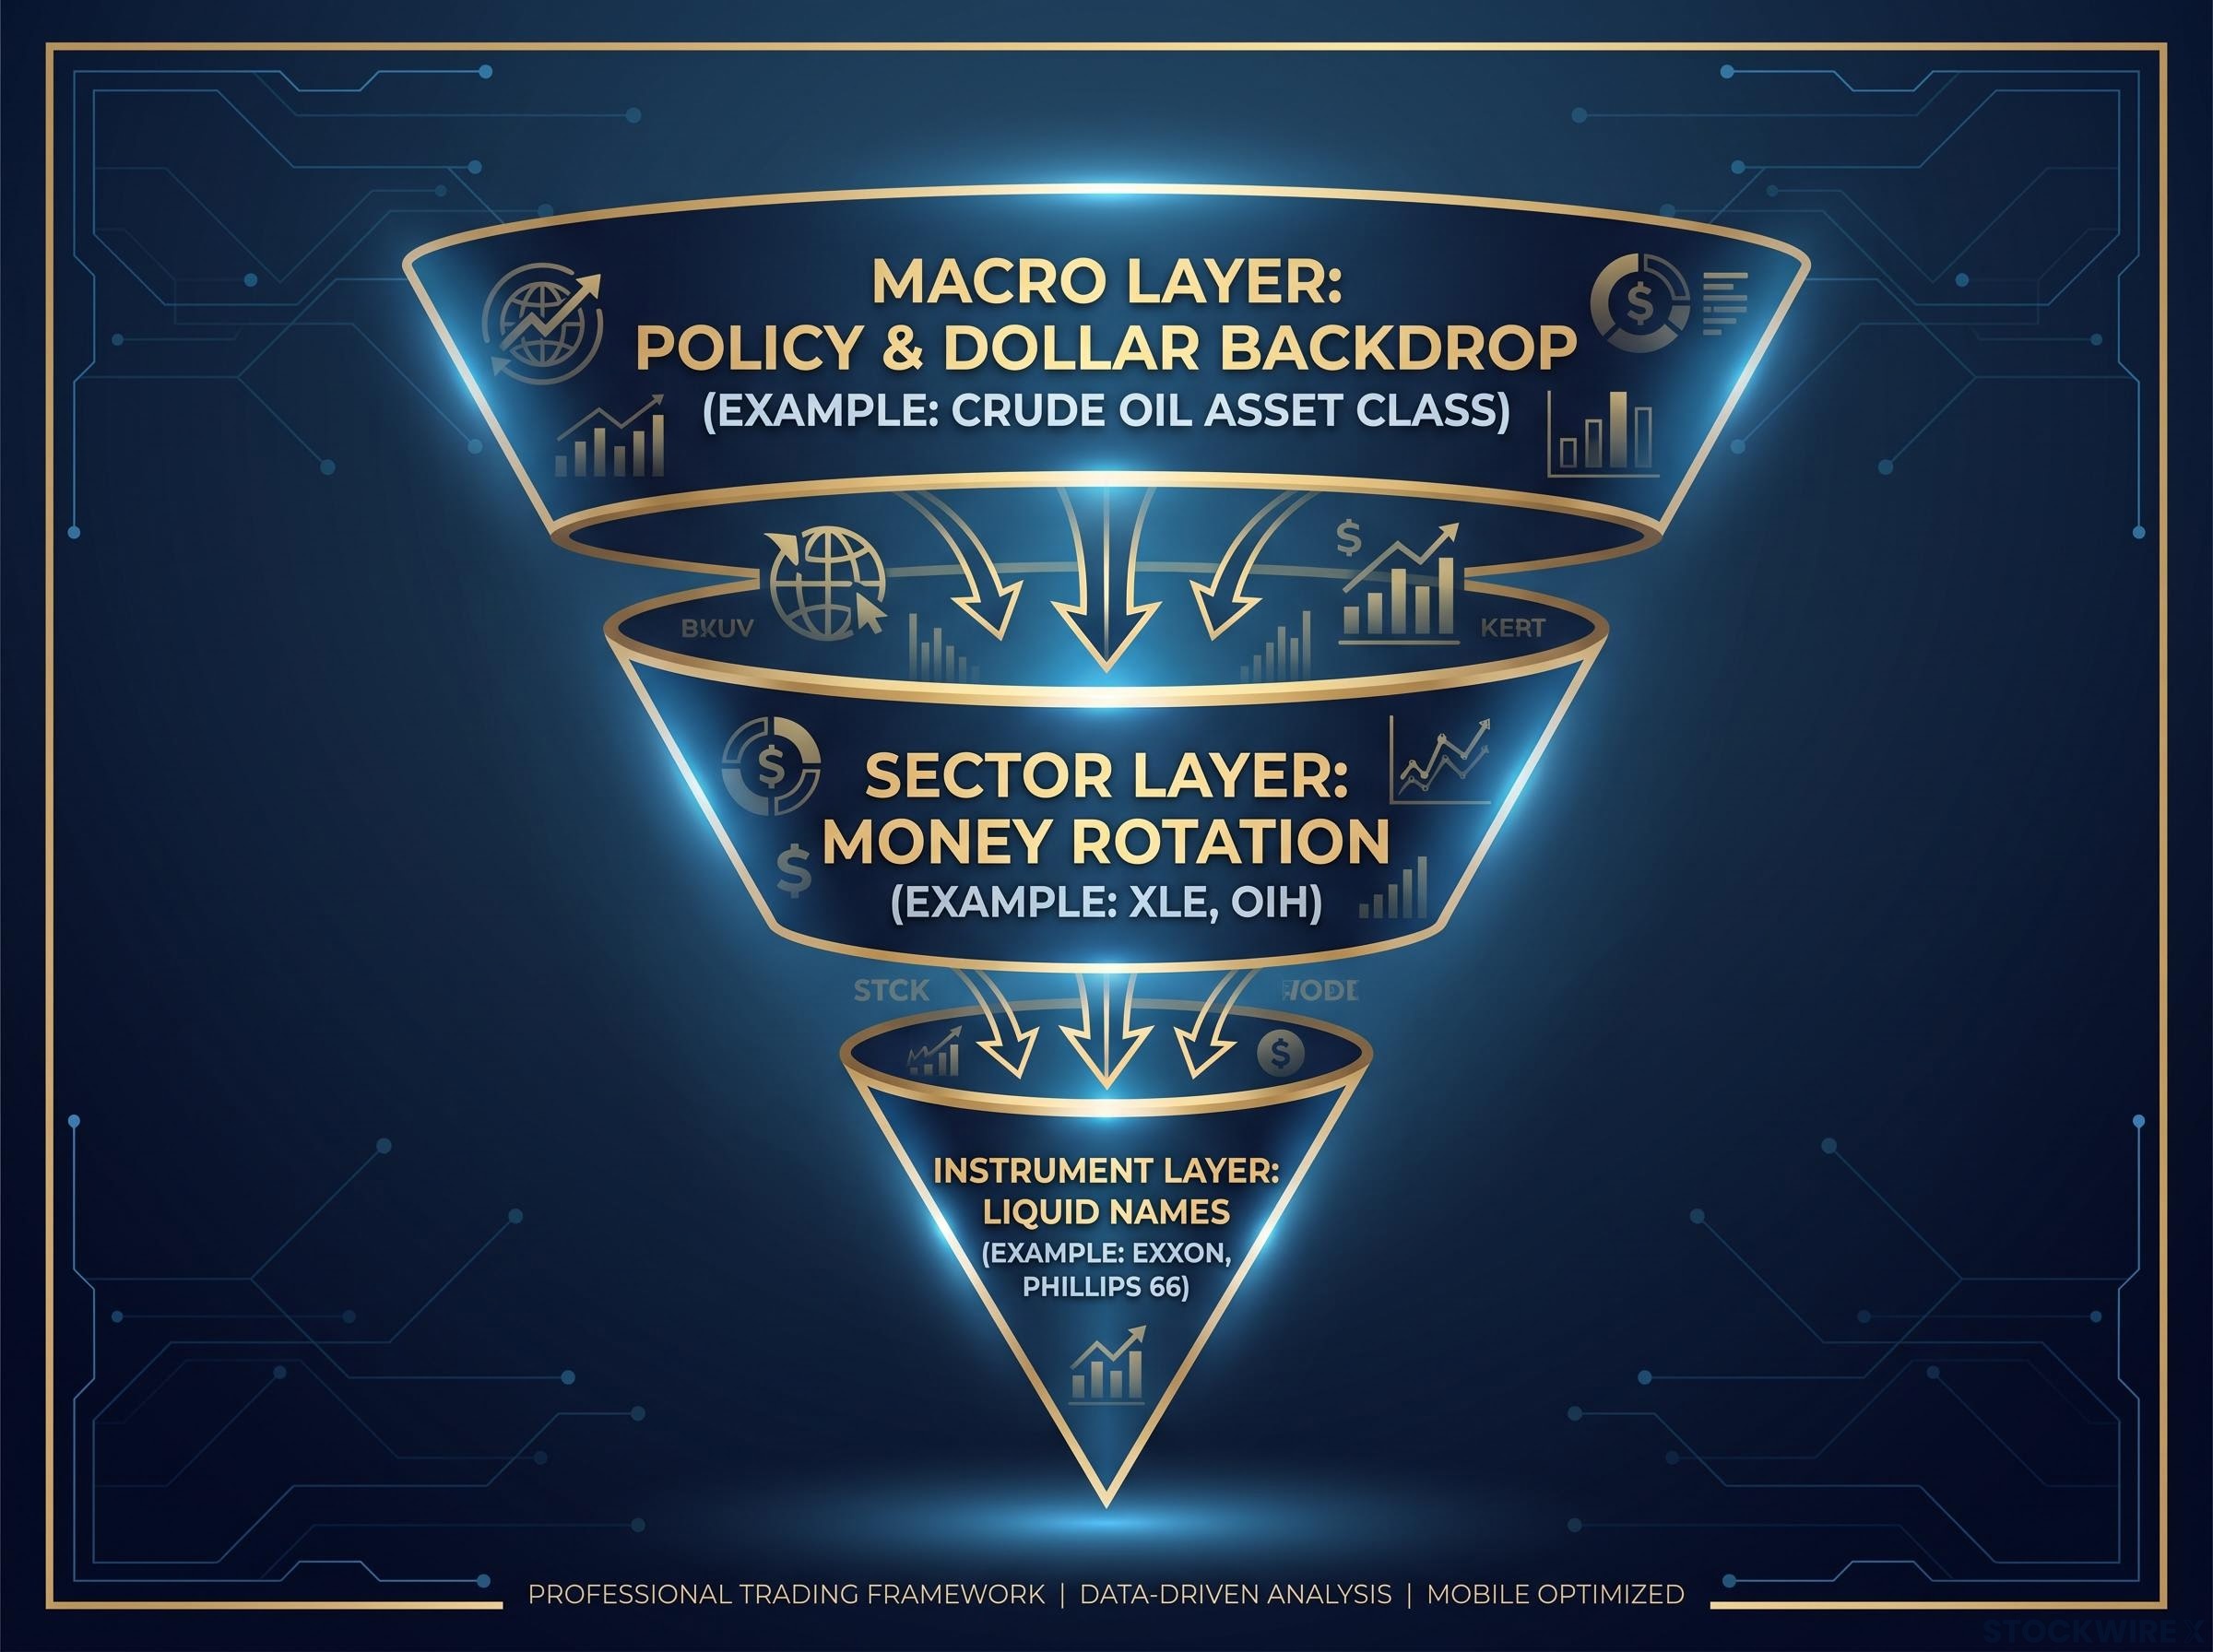
The sequence runs in three layers. First, macro conditions: central bank direction and whether the dollar is strengthening or weakening. Second, sector-level analysis using ETFs. Third, individual instrument selection, but only once both filters above have confirmed the direction.
A well-developed sector rotation strategy maps each business cycle phase to the sectors that structurally benefit from it, giving the second layer of the top-down framework a forward-looking basis rather than a reactive one built on recent price performance alone.
- Macro filter. Establish the regime. Is policy easing or tightening, is the dollar strong or weak, is volatility high or low?
- Sector confirmation. Identify where money is rotating using sector ETFs, moving from the broad commodity or theme down to the relevant fund.
- Instrument selection. Choose the specific liquid instrument inside a sector the first two layers have already validated.
Horner’s crude oil example makes the descent concrete. You begin with crude as an asset class, drop to energy sector ETFs such as XLE or OIH, then examine individual equities like Exxon or Phillips 66.
| Layer | What you are asking | Example instrument |
|---|---|---|
| Macro layer | Is the policy and dollar backdrop supportive of the commodity complex? | Crude oil as an asset class |
| Sector layer | Is money actually rotating into energy right now? | XLE, OIH |
| Instrument layer | Which liquid name inside the confirmed sector do I trade? | Exxon, Phillips 66 |
The reason the order matters is that the upstream layers make the downstream analysis productive. Macro sets the regime, sectors tell you where capital is moving, and studying a single stock only pays off once both filters agree. This is a process-first, product-agnostic method: the same steps apply whether the eventual trade lands in futures, FX, stocks, or ETFs, with liquidity always the deciding factor.
There is one documented exception. Day trading operates without heavy macro reliance, focusing instead on intraday price action and sentiment, because the time horizon is short enough that macro conditions sit in the background rather than driving the trade.
So if you are eyeing an energy name today, the framework reframes your first question. It is not “does Exxon look good on this chart?” It is “what is the macro environment doing to the commodity complex, and does sector flow confirm it?” Answer those two, and the chart becomes the last step rather than the first.
The S&P 500 alignment rule that most retail traders have never heard of
Some rules look too simple to matter until you see the mechanism underneath. This is one of them.
Avoid S&P 500 trades unless the Dow Jones and the NASDAQ are moving in the same direction.
Horner’s reasoning is structural. The S&P 500 blends industrial and blue-chip exposure with growth and technology exposure. When the Dow (industrial-heavy) and the NASDAQ (growth-heavy) trend together, that broad participation makes S&P 500 breakouts and trend signals more reliable. When they split, the index can look directional on your screen while actually masking a rotation between opposing segments.
Index divergence signals carry more diagnostic content than a single misaligned session: in August 2026, semiconductors fell 20.6% in a single month while the equal-weighted S&P 500 outperformed the Nasdaq 100 by 7.6 percentage points, the widest gap since 2003, confirming that rotation beneath the surface can persist long enough to invalidate multiple swing-trade setups.
Reading the two divergence patterns
Two divergence patterns show up repeatedly, and each tells you something different.
When the NASDAQ advances while the Dow lags, you are usually looking at a narrow, growth-led move with weak breadth. When the Dow rallies while the NASDAQ lags, capital is rotating toward value and cyclicals. In either case the S&P 500 can chop as large segments cancel each other out, and that is exactly when directional trades whipsaw.
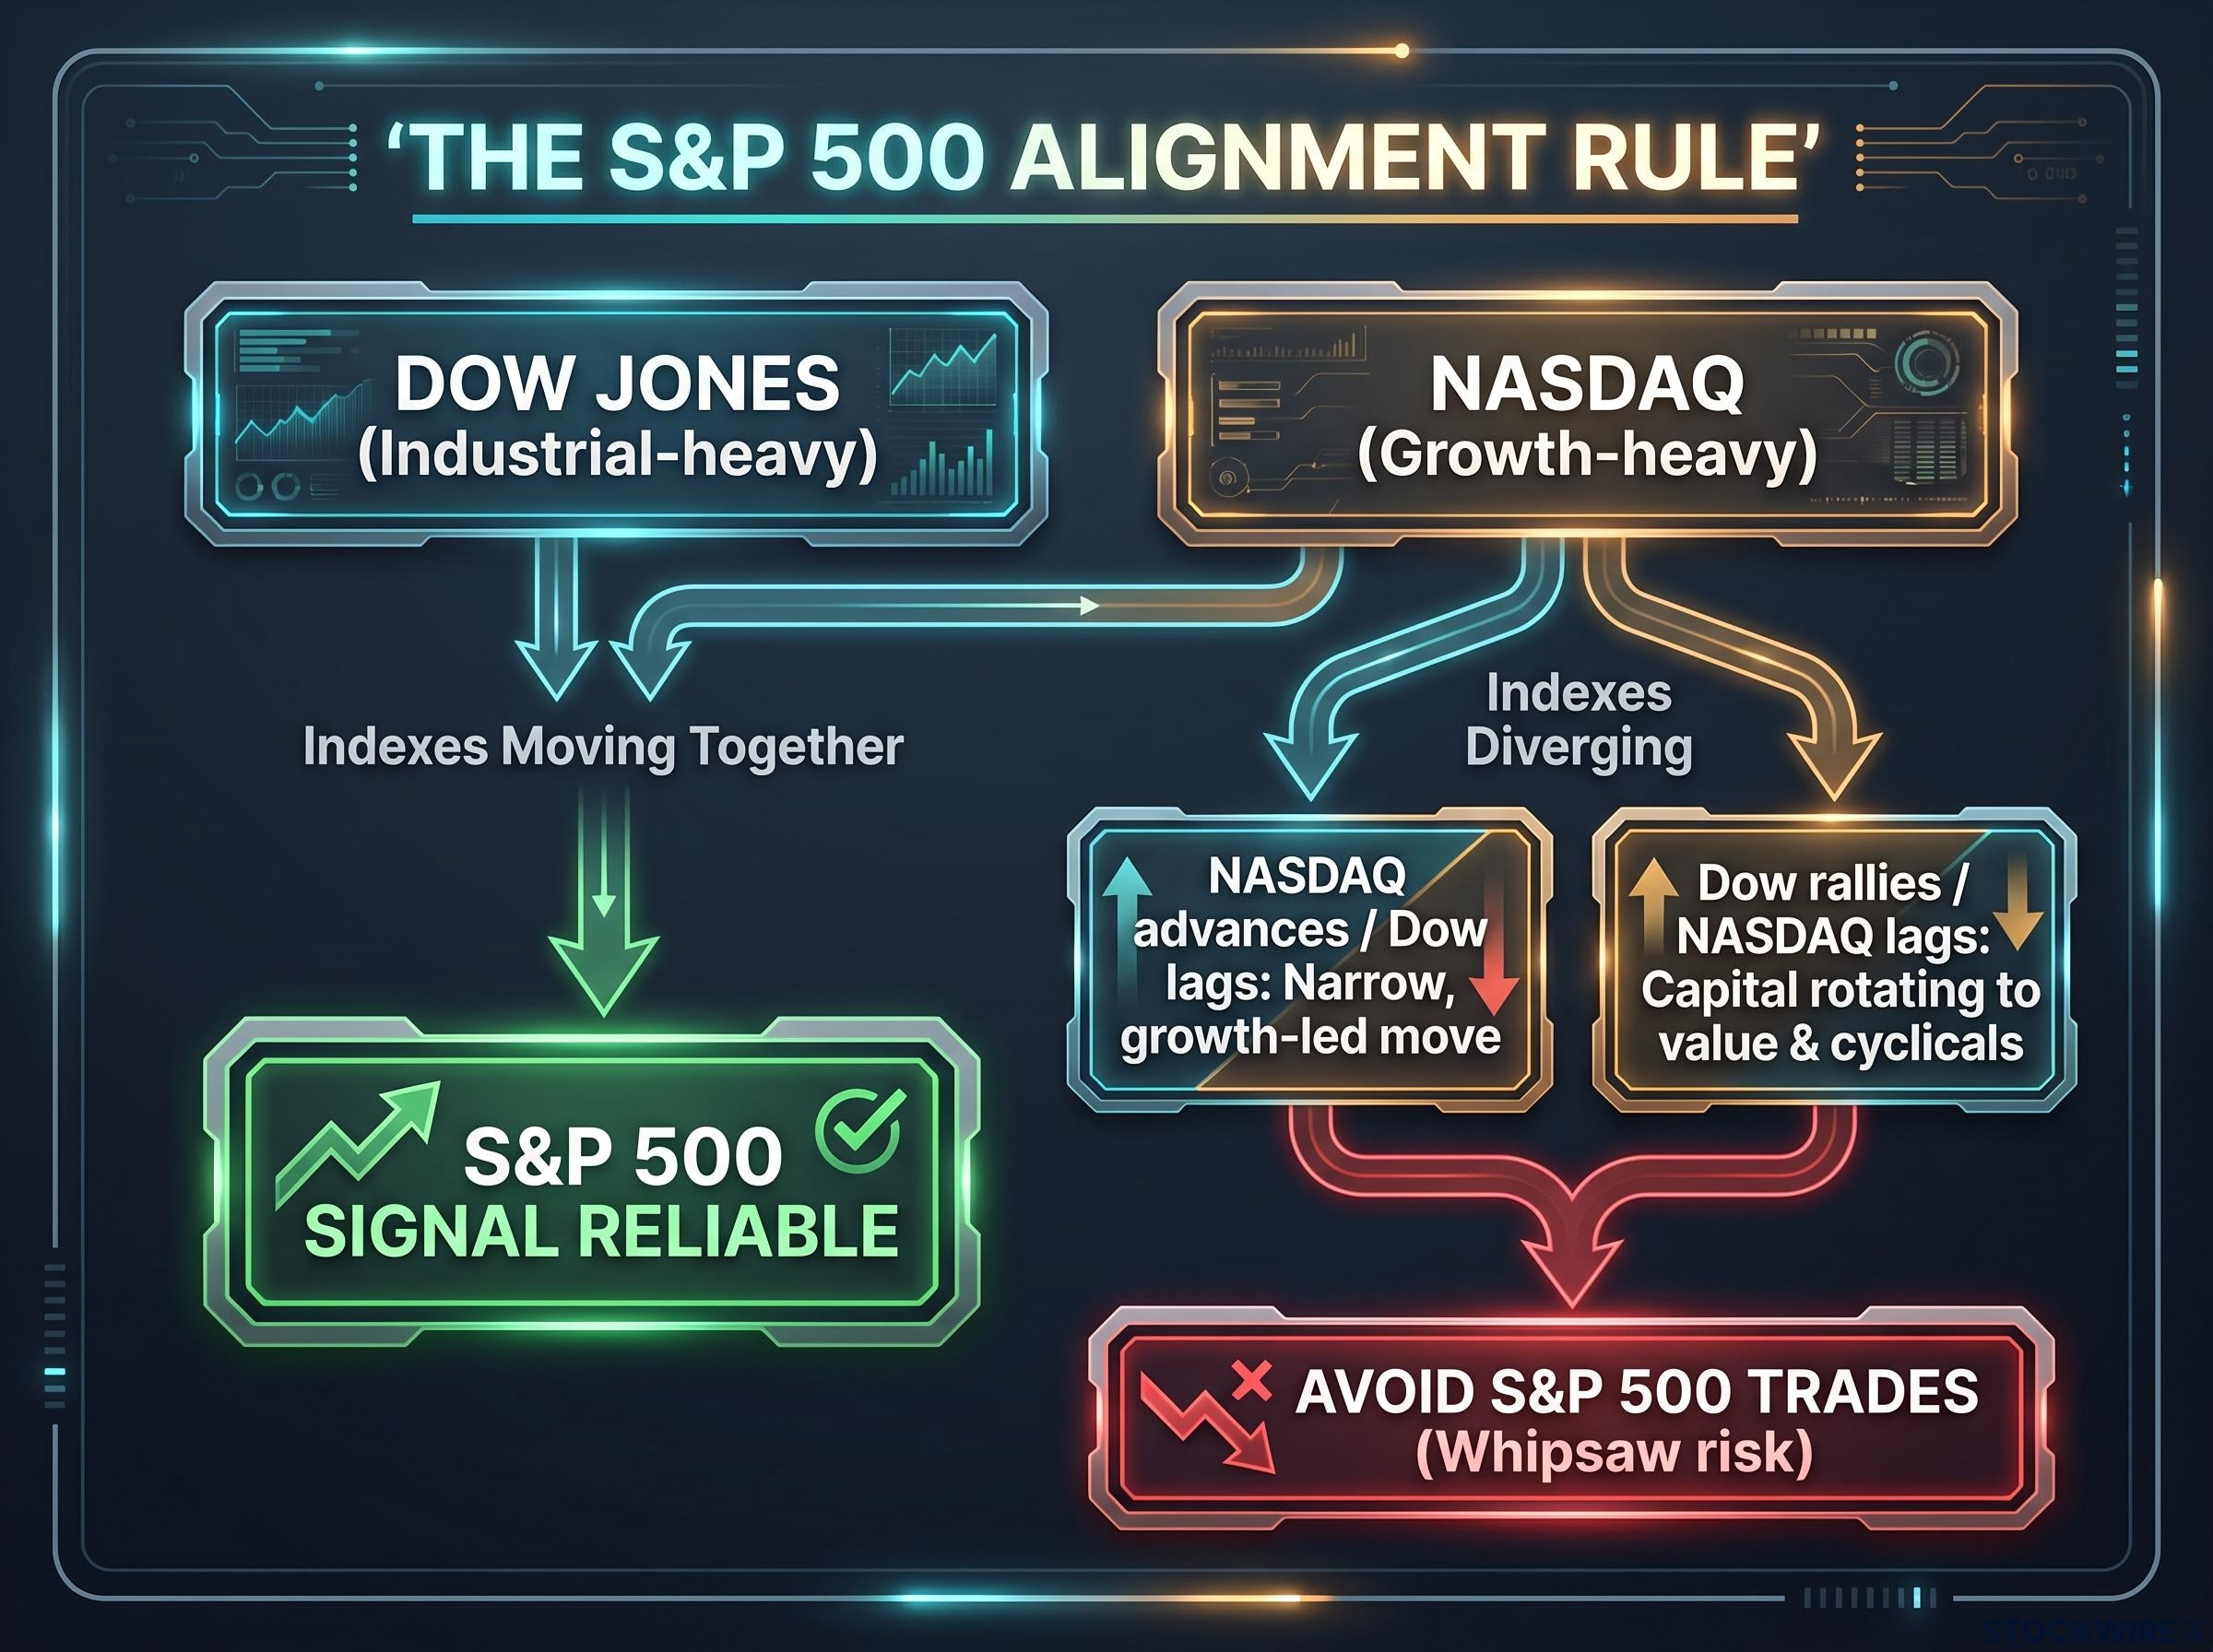
The Dow is the larger, more stable reference index in this framework; the NASDAQ is the more volatile counterpart. A valid S&P 500 setup is expected to coincide with a comparable setup visible in one of the two. If it does not, the signal is suspect.
Ignore the alignment check and you invite a specific set of risks:
- False breakouts driven by a handful of mega-cap names while the broader market lags.
- Underestimated rotation risk hidden by the index’s blended exposure, leaving you exposed as the rotation completes.
- Poor timing at inflection points, where indexes desynchronise temporarily during regime transitions and early entries meet chop and stop-outs.
When the Dow and NASDAQ pull apart, any apparent S&P 500 signal on your screen is more likely reflecting rotation beneath the surface than a clean move worth trading. That single distinction can prevent a whole category of failed trades: setups that looked pristine on the S&P 500 chart and reversed without warning because the underlying move was a rotation, not a trend.
What to do when the indexes diverge
Divergence is not only a warning; it is information. Treat it as a live signal about what the market is doing under the hood.
In practice, that means leaning toward shorter-duration or more tactical trades while the indexes disagree, and waiting for realignment before committing to a swing position. The realignment itself becomes your entry cue.
How the Fed’s policy stance should change what you trade and how long you hold it
The framework tells you to watch the Fed. Here is how that watching changes the actual mechanics of a trade.
Horner documented the adjustment directly during a hawkish stretch in the second half of September. As a more hawkish Fed stance and ongoing geopolitical uncertainty disrupted momentum, she shifted from swing trading to short-term day trading, avoided overnight positions, and used the morning geopolitical tone as a short-term directional guide, while recognising that market mood often flipped around late morning.
That behaviour reflects a general pattern hawkish regimes produce:
- Higher gap risk. Policy announcements and data releases (CPI, jobs, FOMC) drive large overnight moves that punish carried positions.
- Regime uncertainty. Rapid shifts in rate expectations cause frequent trend reversals and failed breakouts, eroding swing-trade reliability.
- Options repricing. Implied volatility spikes around events, making premium selling riskier and pushing traders toward short-dated, tactical usage.
Dovish or neutral regimes invert this. Trends persist longer, gap risk falls, and you can extend holding periods and lean less on pure intraday execution.
| Policy regime | Typical market conditions | Tactical adjustment |
|---|---|---|
| Hawkish / tightening | Higher gap risk, frequent reversals, spiking implied volatility around events | Shorten holding periods, favour day trades, avoid overnight exposure, use short-dated options tactically |
| Dovish / easing or neutral | Longer-lasting trends, lower gap risk, more contained volatility | Extend holding periods, allow swing positions, rely less on intraday execution |
History backs the pattern. During the 2022 hiking cycle, repeated 50-75 basis point hikes lifted implied volatility and produced large swings around FOMC meetings, a period educators and strategists described as structurally difficult for swing trading. In the fourth quarter of 2018, with the Fed signalling ongoing balance-sheet runoff, discretionary traders reportedly shortened holding periods to sidestep overnight gap and policy risk.
The current context is calmer. The Fed closed 2025 with a 3.50-3.75% target range and projections pointing to a shallow, gradual downward path into 2026 and 2027.
Here is the read for your own default mode. If you naturally swing trade, the Fed’s current path is not a guarantee of continuation. Knowing which conditions would push the framework back toward day-trading-only is the difference between adapting in time and being caught mid-position when the regime turns.
Applying the framework today: what the current rate environment tells you before you open a chart
Put the layers together and you can describe the current setup before looking at a single price.
The Fed ended 2025 at 3.50-3.75% with a shallow easing trajectory. Per the September 2025 dot plot summarised by JPMorgan Asset Management, one cut is projected in each of 2026 and 2027, reaching a terminal rate gradually rather than sharply.
The September 2025 dot plot pointed to a terminal rate of 3.125%, held unchanged through 2028, an anchor for reading the current regime as neutral-to-easing rather than aggressively hawkish.
Operationally, that places the macro filter far from the 2022 peak or the hawkish September stretch Horner described. Swing positions are more defensible in a neutral-to-easing regime than in a tightening one. The framework still requires you to check sector alignment and index confirmation before you enter; a supportive macro backdrop is a green light for the process, not a bypass of it.
It is worth being honest about the framework’s limits, because practitioners are. Macro can be priced in before discretionary traders act. Strict macro filters can cause you to miss strong idiosyncratic setups such as turnarounds or special situations. And price action often anticipates policy before official communications confirm it. This is why many practitioners run a hybrid: macro as a regime filter, not a rigid gate, with price action and relative strength timing the entries.
The March 2026 BIS Quarterly Review finding sharpens the point. Even as index-level volatility moderated, single-stock volatility rose faster beneath it, which tells you idiosyncratic risk stays elevated and sector-level filtering keeps its value in a calmer macro regime.
For readers wanting a real-time application of the sector confirmation layer, our dedicated guide to 2026 sector rotation documents how institutional capital moved from AI and mega-cap technology into energy, industrials, and healthcare, with specific ETF price levels marking where the reallocation gained structural rather than tactical weight.
So the portable takeaway is a four-step sequence you can run yourself on any trade idea:
- Identify the current Fed policy regime.
- Confirm the target sector aligns with that macro direction.
- Check cross-index alignment before trading the S&P 500.
- Adjust holding period and position structure to match the regime’s risk level.
The environment today is meaningfully different from 2022. The framework’s value is precisely that it gives you an explicit, updated read on the regime instead of assuming last year’s conditions still apply.
This article is for informational purposes only and should not be considered financial advice. Investors should conduct their own research and consult with financial professionals before making investment decisions.
Past performance does not guarantee future results, and rate projections are subject to change based on incoming data and market developments.