
A stock trading on a single-digit price-to-earnings (P/E) ratio with a dividend yield somewhere between 6% and 9% should, by conventional logic, draw every income and value investor within reach. Kaspi.kz carries both of those characteristics, and yet the market has declined to re-rate it toward the multiples its business metrics might otherwise justify.
That gap is the puzzle worth sitting with. The numbers are not fictional. The question is what those numbers are actually compensating for.
This piece uses Kaspi as a live case study in reading emerging market valuation metrics correctly, not as an investment recommendation. The framework applies to any frontier or emerging market equity with a similar surface profile: cheap on the multiple, generous on the yield, and quietly ignored by the wider market.
Here is what the analysis gives you. By working through Kaspi’s own financial data, you will be able to distinguish between a valuation discount that represents genuine mispricing and one that represents fair compensation for structural risk. The two look identical on a screener. They are not identical in outcome.
What Kaspi’s headline numbers actually show
Start with the metrics as they appear, before any judgment is applied. Kaspi trades on a single-digit P/E, a price-to-sales ratio of roughly 2x, and a dividend yield reported at approximately 6-9% depending on the source and the timing. On paper, that is a value investor’s shortlist entry.
The dividend is real and rising. For Q1 2026, the Board recommended KZT 850 per ADS, subsequently approved by shareholders. For Q2 2026, that was lifted 18% to KZT 1,000 per ADS, formally approved at an Extraordinary General Meeting in September 2026. This is not a phantom yield built on a single lucky payment; it is a payout that has been reinstated and escalated over consecutive quarters.
Revenue is growing at pace. Q1 2026 revenue reached KZT 1,080,630 million, up roughly 31% year-on-year from KZT 821,851 million a year earlier. Marketplace gross merchandise value (GMV), the total value of goods sold across the platform, hit KZT 2.3 trillion (approximately US$4.8 billion) in Q2 2026, a 15% rise on a constant-currency basis.
Then comes the figure that should make a careful reader pause.
Net income has gone nowhere. H1 2026 net income of KZT 510,796 million came in fractionally below the KZT 512,678 million reported in H1 2025, a decline of approximately 0.4% year-on-year. Revenue surged 31%. Profit flatlined.
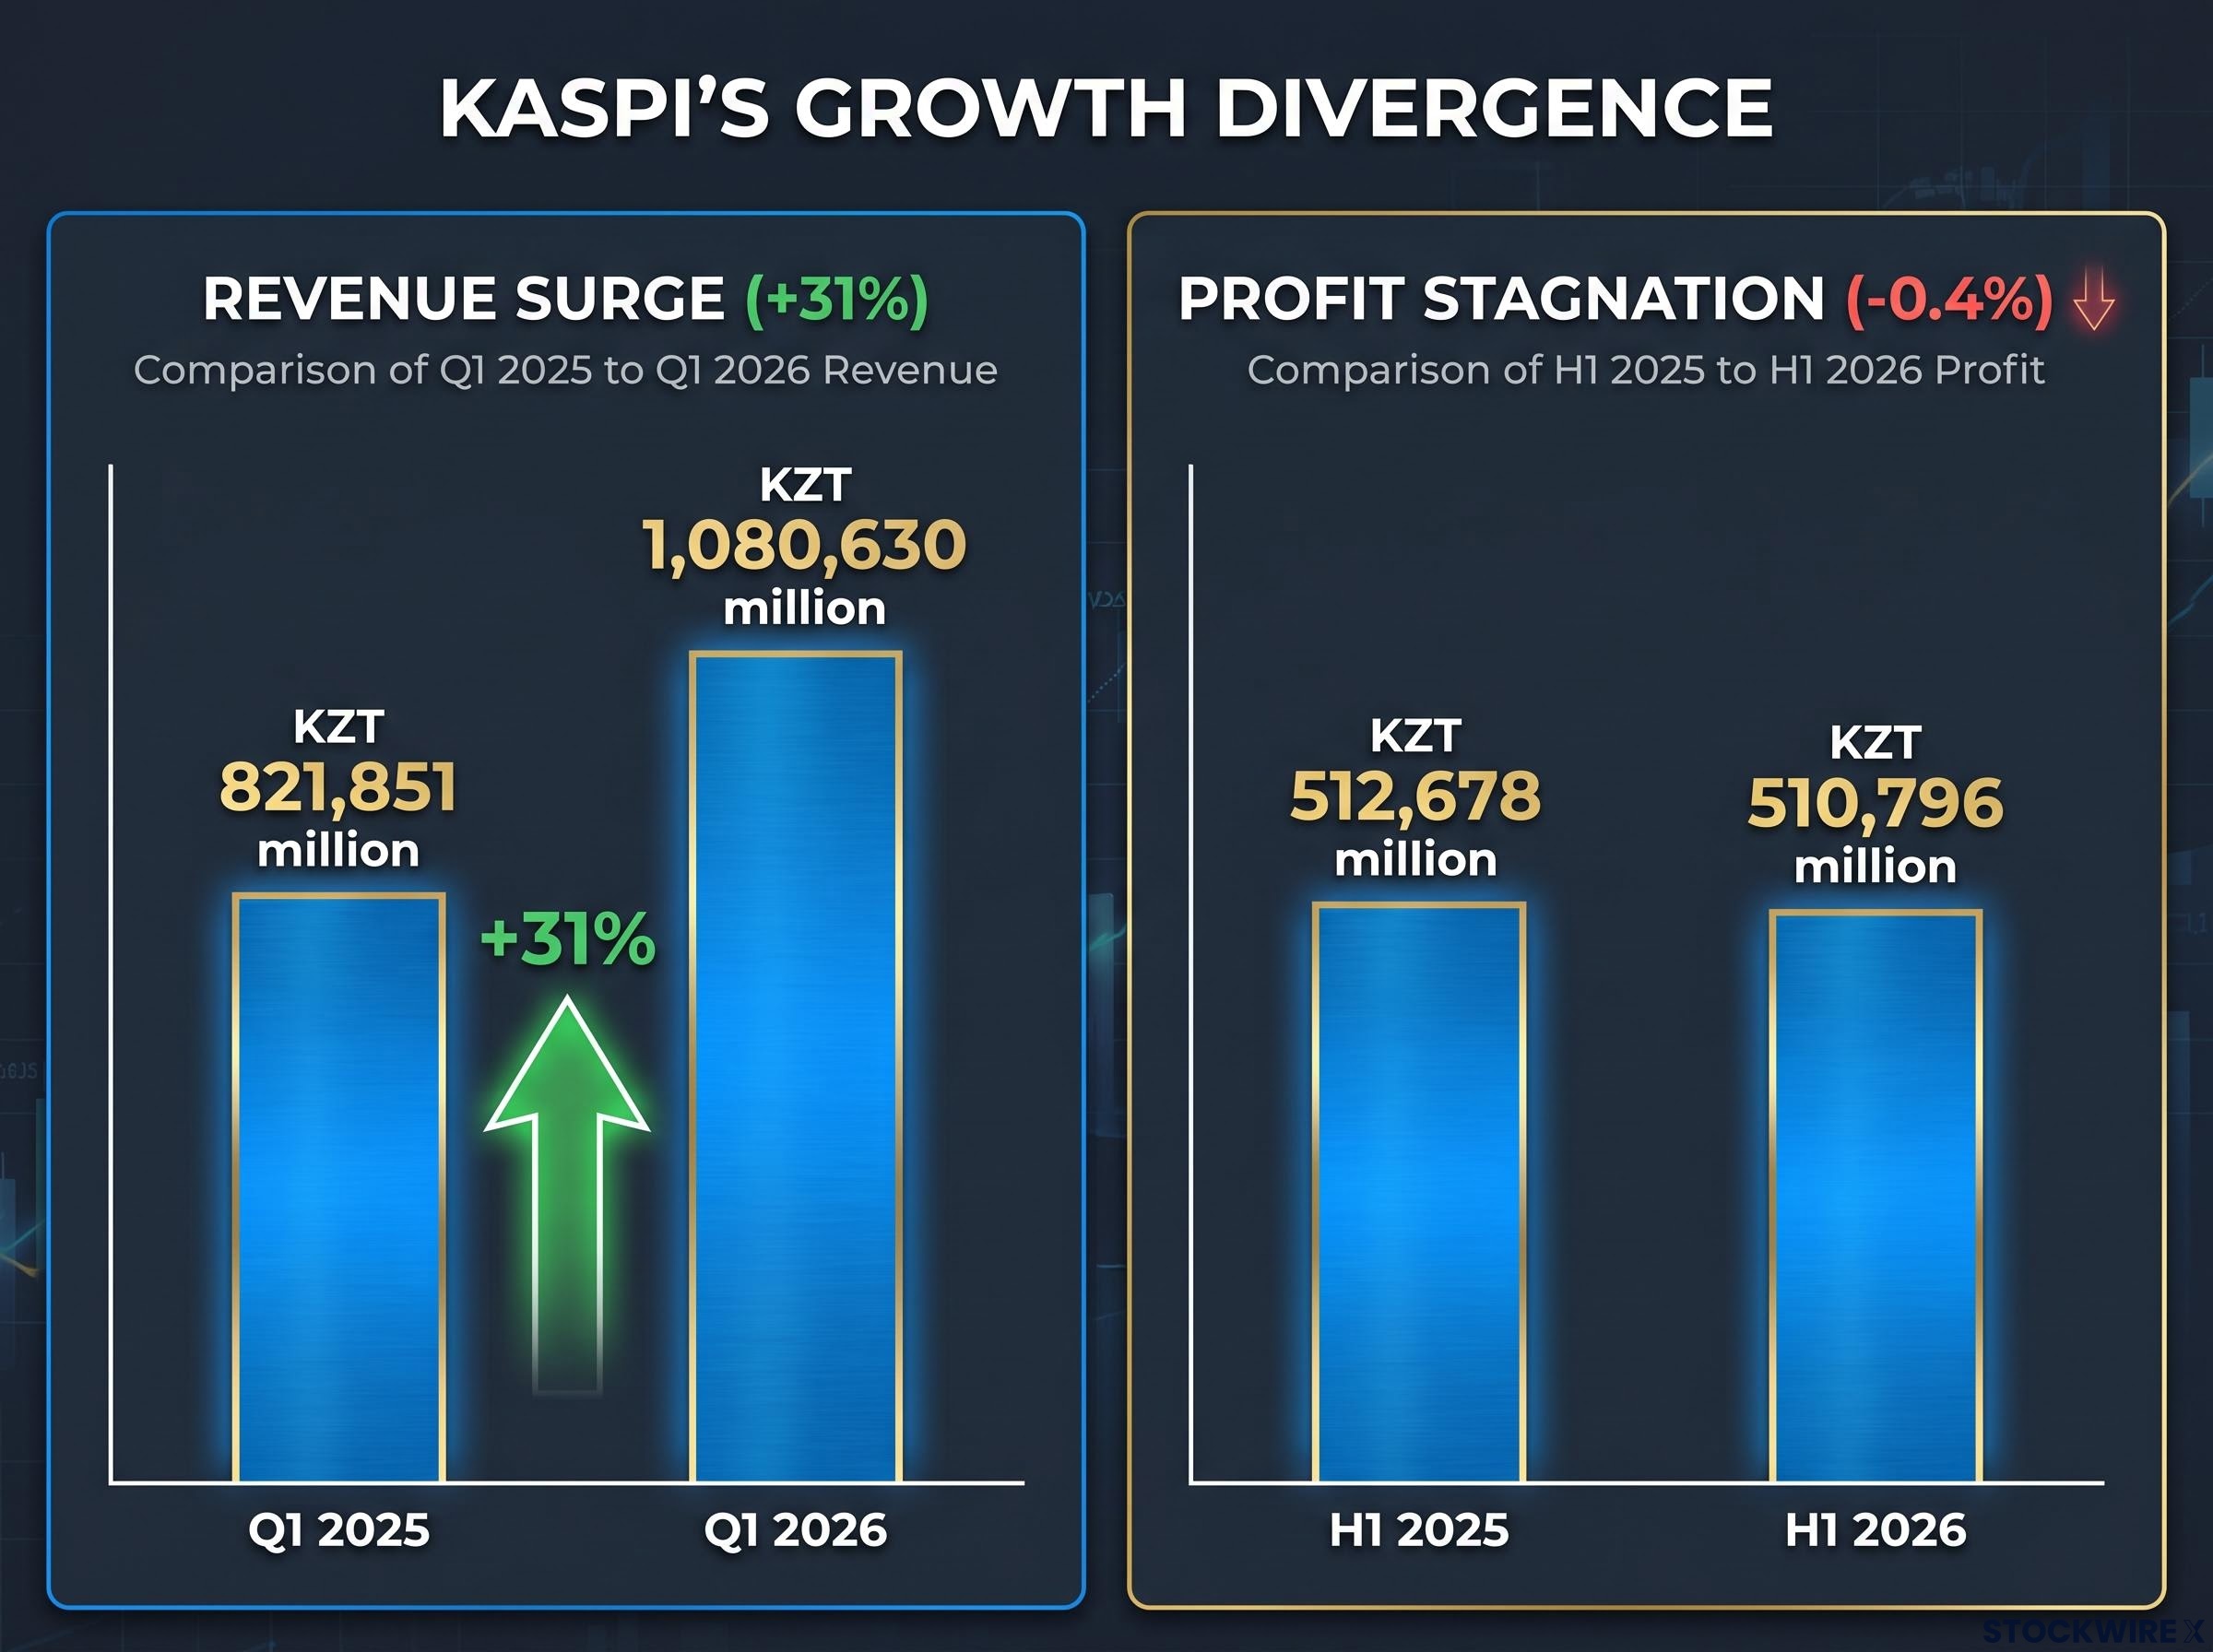
| Metric | H1 2025 | H1 2026 | Change |
|---|---|---|---|
| Net income (KZT million) | 512,678 | 510,796 | -0.4% |
| Revenue (Q1, KZT million) | 821,851 | 1,080,630 | +31% |
| Dividend per ADS (Q1 to Q2 2026) | – | KZT 850 to KZT 1,000 | +18% |
| Payout ratio (Q1 2026) | – | 64% | – |
What this divergence tells you is that Kaspi is now generating less incremental profit for each additional unit of revenue than it once did. Growth is arriving at the cost of margin, credit expense, or operating cost.
The Kaspi Q1 2026 earnings release is the source document for the revenue and net income figures underpinning this divergence, confirming that the 31% revenue rise and flat profit were reported under consistent accounting standards across both periods.
And here is the part that matters for anyone drawn in by the yield: a rising dividend paid out of flat earnings, against a 64% payout ratio in Q1 2026, is a narrowing margin of safety. The income looks generous today. The buffer behind it is thinning.
When big ASX news breaks, our subscribers know first
Why emerging market multiples compress, and what Kaspi’s discount is actually pricing
The instinct on seeing a single-digit P/E is to assume the market has made a mistake. With frontier and emerging market equities, that assumption is usually wrong. The discount is rarely an oversight. It is a deliberate pricing of specific, nameable risks, and understanding each one is how you assess whether you are being paid enough to carry them.
Emerging market valuations have fallen to historically compressed levels relative to US equities, a structural context that matters when assessing whether any individual EM discount reflects genuine mispricing or simply the starting-point cheapness that now characterises the asset class broadly.
Emerging and frontier market equities trade at lower multiples than developed-market peers for structural reasons. Each component of that discount can be broken out and evaluated on its own:
- Country-risk premium: investors demand higher returns to offset political instability, weaker rule of law, and abrupt policy shifts.
- Currency risk: earnings and dividends denominated in local currency expose foreign holders to translation losses and potential capital-control changes.
- Regulatory unpredictability: fee caps, lending rules, and data laws can change quickly, with little of the stable precedent developed markets offer.
- Governance assumptions: concentrated ownership and local legal frameworks raise questions about minority-shareholder protection.
- Liquidity constraints: smaller free floats and thinner infrastructure limit institutional participation and depress valuations.
Kaspi checks most of these boxes in concrete ways. Its earnings and dividends are paid in Kazakhstani tenge, so a foreign shareholder wears currency risk on top of business risk. The dividend itself is discretionary, requiring explicit Board recommendation and shareholder approval each quarter rather than flowing automatically.
The sharpest illustration came in 2022. During Kazakhstan’s civil unrest that January, Kaspi’s share price fell roughly 30%. Actual operational damage was minimal: write-offs attributable to the unrest totalled approximately US$1.5 million, a rounding error against the group’s scale.
That episode is instructive precisely because the damage was trivial while the repricing was severe. It showed how fast frontier-market political risk can reset a stock regardless of fundamentals. That is exactly the kind of risk that gets priced permanently into the multiple, not just during a crisis.
Where Kaspi departs from the typical frontier-market profile
Kaspi does not sit neatly inside the frontier bucket. It reports to Nasdaq listing standards, has issued US$600 million in 5.900% senior notes due 2031, and runs an integrated super-app combining payments, marketplace commerce, and lending, the sort of model usually associated with developed-market platforms.
Yet its governance framework remains fundamentally Kazakhstani rather than EU or US-style, which many global investors read as less protective of minority holders. So the access to international capital markets is real, but it does not erase the domestic governance question.
A company’s governance framework shapes how minority shareholders are protected and how credibly management communicates during adverse periods, and the market’s persistent discounting of Kaspi reflects precisely the uncertainty that arises when international listing standards coexist with domestic legal structures that offer fewer protections.
This is where the valuation argument actually lives. Kaspi is neither a straightforward frontier-market company nor a developed-market equivalent, and that ambiguity is itself a risk that has to be priced. The discount is not evidence the market is asleep. It is the market pricing an uncertainty it cannot fully resolve.
The domestic ceiling and what it means for dividend sustainability
Every growth story eventually runs into arithmetic. For Kaspi, the arithmetic is stark, and it reframes how you should read that generous yield.
Kazakhstan’s total population is approximately 20.6 million, of whom an estimated 14.2 million are adults aged 16 and above, the pool of people who could realistically use Kaspi’s services. Against that, Kaspi reports 15.7 million active users.
Kaspi’s domestic user base has already surpassed the estimated size of the entire eligible adult market: 15.7 million active users against roughly 14.2 million eligible adults. There is, in practical terms, no one left at home to sign up.
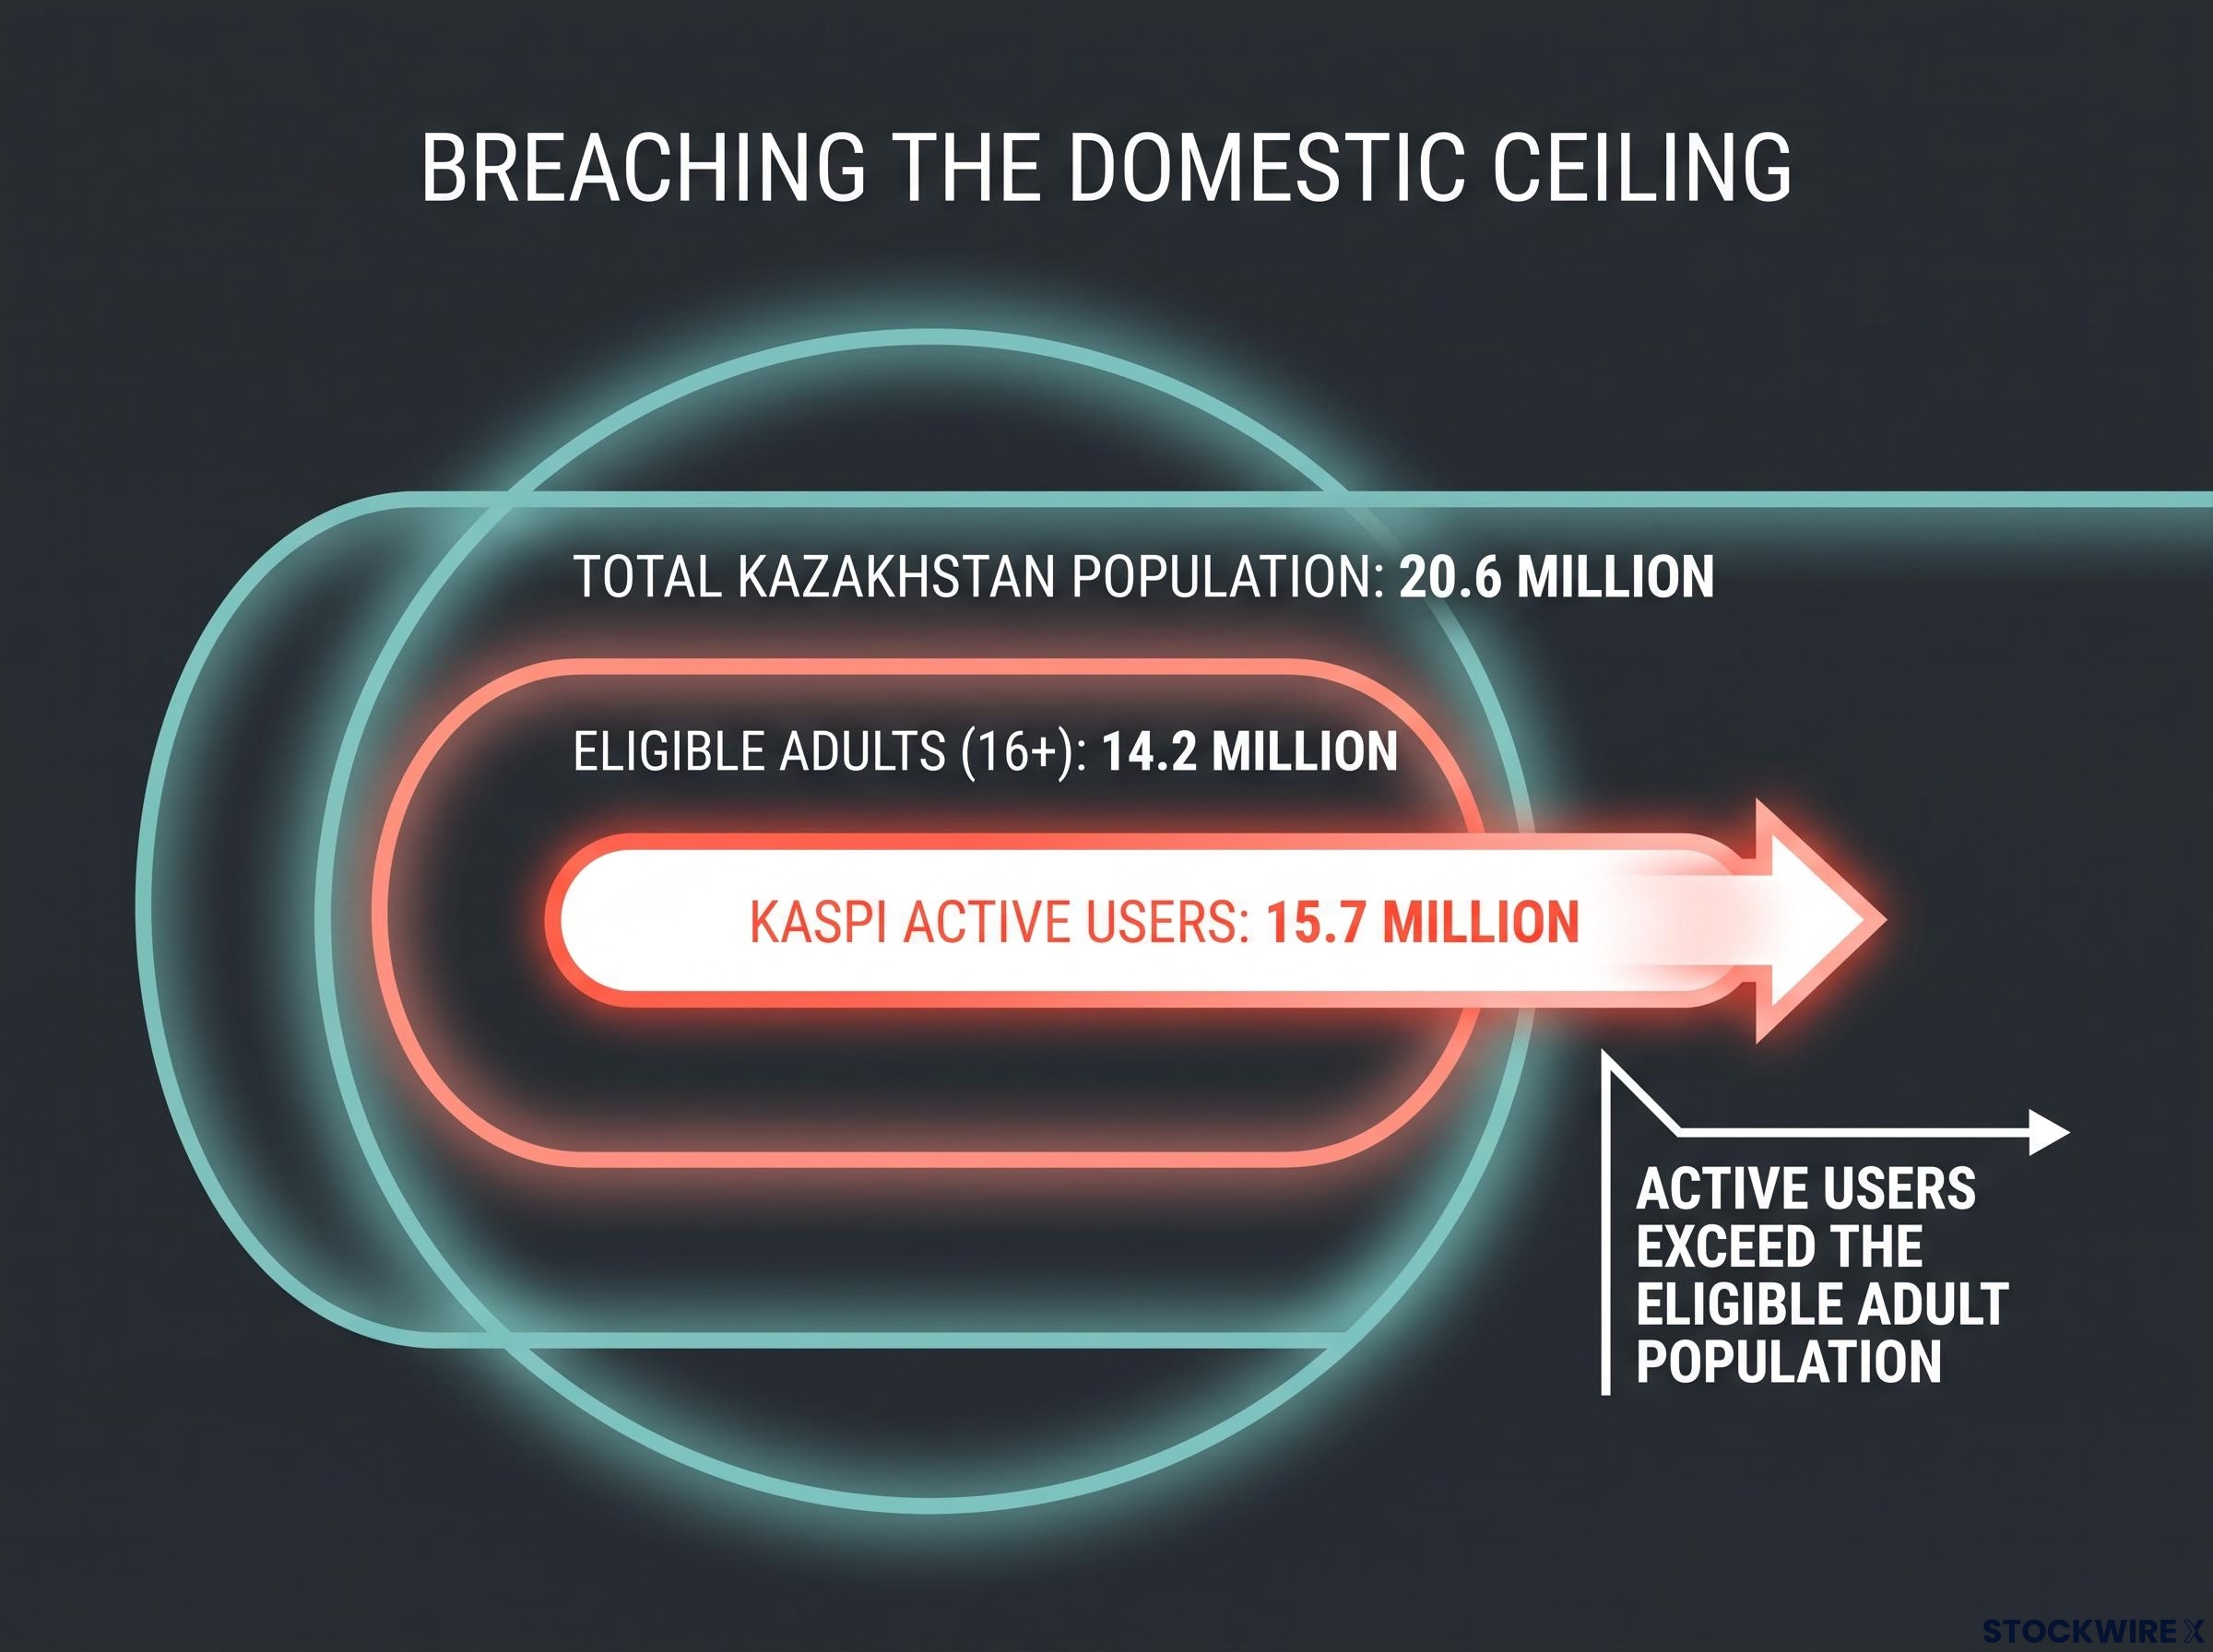
That is the clearest possible signal that Kazakhstan alone cannot power the next earnings cycle. Any investor banking on domestic user growth to sustain or grow the dividend is working from an assumption the data no longer supports.
Now connect that to the profit picture. Net income is flat at roughly KZT 510-512 billion across H1, the payout ratio sits at 64%, and the quarterly dividend has just been raised 18% to KZT 1,000 per ADS. With no domestic user growth left, the dividend can only keep rising if one of two things happens:
- Deeper monetisation per user: raising take rates, extending loan durations, or selling more services to the same customers. The execution risk is that these levers meet regulatory limits or consumer resistance, and they cannot expand indefinitely.
- Successful international replication: exporting the model into new markets to restart earnings growth. The execution risk here is substantial and largely unproven, which is the subject of the next section.
Understanding where domestic growth capacity has run out is not optional before projecting income from a 6-9% yield. It is the starting point.
International expansion as catalyst and complication
International expansion into Turkey, Azerbaijan, and neighbouring markets is Kaspi’s primary growth lever beyond a saturated home base. It is also a double-edged development.
Porting a super-app abroad is considerably harder than growing one at home. New markets bring unfamiliar regulators, entrenched local competitors including incumbent banks and international platforms, different consumer behaviour, and fresh currency and legal exposure. The expansion is arguably necessary to justify the growth assumptions embedded in any long thesis, yet it introduces precisely the kind of risk that can justify keeping the discount in place until execution is proven.
There is a balance-sheet tension underneath all of this. Kaspi is paying out 64% of earnings while simultaneously carrying US$600 million in senior notes. That raises a fair question about how much capital flexibility remains to fund an expensive, multi-market expansion without straining either the dividend or the balance sheet.
Applying the framework: bargain, value trap, or something more specific?
Both interpretations of Kaspi can be built entirely from real data. That is what makes it a genuine analytical case rather than an easy call. Take each view at its strongest.
The genuine-bargain case:
- A dominant super-app with strong cash generation across payments, marketplace, and lending.
- Top-line evidence that it still behaves like a growth company: ~31% Q1 revenue growth and 15% constant-currency GMV growth in Q2.
- Nasdaq-standard reporting and access to international debt markets.
- A compressed multiple that may reflect the market over-penalising frontier risk rather than any genuine business weakness.
The value-trap case:
- A structural discount built from identifiable, persistent risks that will not simply evaporate.
- Earnings growth that has stalled domestically, with H1 net income down 0.4% year-on-year.
- A 64% payout ratio that leaves limited buffer if profits decline.
- International expansion that remains unproven, and a 2022 reminder that sentiment can strip 30% off the price even when operational damage is negligible.
Country-specific EMEA equity theses in markets like Turkey and Poland show that investors are already making deliberate choices to absorb known FX and political risk in exchange for asymmetric upside, the same trade-off structure that makes Kaspi’s risk-reward positioning genuinely contestable rather than obviously wrong.
The honest resolution is not to average these two views into a lukewarm verdict. It is to identify the specific variables that would tip the balance of evidence one way or the other.
The same discount can represent mispricing or fair compensation for risk. Which one it is depends on observable variables, not on the headline number. Watch net income over the next two to three quarters, the concrete signals of international traction, tenge stability, and the regulatory environment.
Here is the read to carry away. If net income resumes meaningful growth while the overseas expansion shows evidence of traction, the current discount starts to look like mispricing worth exploiting. If net income stays flat while the payout ratio remains elevated, the yield begins to look like capital erosion dressed up as income. The data over the coming quarters, not the screener today, settles the question.
What the Kaspi case study teaches about reading frontier market metrics
Lift the analysis off Kaspi for a moment, because the real value here is portable. The next time a frontier or emerging market stock appears with a low P/E and a fat yield, the same interrogation applies.
The questions to ask before the next frontier market opportunity
Run any attractive-looking emerging market equity through this checklist, with Kaspi as the worked example for each:
- What is the discount actually pricing? Break it into country, currency, regulatory, governance, and liquidity risk. Kaspi’s 2022 30% drop on US$1.5 million of write-offs shows how heavily sentiment risk alone can weigh.
- Is the dividend discretionary or contractual? Kaspi’s payout requires Board recommendation and shareholder approval via EGM or AGM every quarter. A yield on a financial platform is simply the last payment annualised, with no guarantee of recurrence.
- Is top-line growth translating into earnings growth? Kaspi’s 31% revenue growth alongside flat net income is the warning that the two can diverge sharply.
- What is the realistic growth ceiling? With 15.7 million users against 14.2 million eligible adults, Kaspi’s domestic ceiling is already breached.
- What are the specific political and regulatory risk factors? Name them, rather than treating “emerging market” as a single undifferentiated risk.
- What is the currency and governance exposure? Tenge-denominated returns and a Kazakhstani governance framework are distinct risks a foreign holder must weigh separately.
An investor who understands the architecture of a dividend, discretionary versus contractual, payout ratio versus free cash flow coverage, and the approval mechanics behind it, is reading a fundamentally different document from one who reads only the yield percentage. The difference in potential outcome is material.
Dividend mechanics complicate the picture further: a rising payout ratio is not evidence of a strengthening income stream if the earnings base supporting it has stalled, and the ex-dividend price adjustment means shareholders receive no net wealth creation at the moment of distribution.
The lesson is not to avoid frontier markets. It is to ask better questions before committing capital to them.
Returning to Kaspi specifically in late 2026, the picture is genuinely contested. Both interpretations rest on real figures. Your job is to hold a view on the specific variables rather than a reflex reaction to a low number.
This article is for informational purposes only and should not be considered financial advice. Investors should conduct their own research and consult with financial professionals before making investment decisions. Past performance does not guarantee future results, and financial projections are subject to market conditions and various risk factors.
A contested valuation in a market that rarely gives clean answers
Pull the threads together and Kaspi resolves into a coherent, if unsettled, picture: attractive headline metrics, a structural discount with clearly identifiable components, flat earnings despite strong revenue growth, a saturated domestic market, and a rising dividend funded from an already-elevated payout ratio.
Whether that discount narrows or deepens depends on variables you can actually track. Successful international expansion, a recovery in net income, tenge stability, and regulatory predictability would argue for the discount closing. Continued flat earnings, a stumbling expansion, or fresh political volatility would argue for it persisting, or widening.
The most durable thing to take from all of this is not a verdict on one Kazakhstani super-app. It is a methodology: read what the discount is pricing, test whether the dividend is built to last, and let the observable variables, not the headline yield, tell you which side of the argument the evidence supports.