Most retail traders wait for a screenshot in a Telegram group to tell them where Bitcoin is heading. They chase the call, not the structure behind it, and they usually arrive after the move has already happened.
There is a better habit worth building, and late September 2026 is a useful moment to build it. Bitcoin is trading in the mid $80,000s, having rallied hard through the quarter, and traders everywhere are hunting for the next reliable continuation or reversal setup.
One of the most dependable of those setups is a chart formation that signals a shift from selling to buying before the crowd catches on.
That formation is the Bitcoin inverted head and shoulders, a bullish reversal pattern that maps the exact moment sellers run out of steam.
Here is what you will walk away with: a clear framework for spotting the pattern on your own charts, a mathematical method for setting price targets, a disciplined way to time your entry, and a checklist of warning signs that tell you when the whole thing has fallen apart. No screenshots required.
Decoding the psychology behind the three troughs
Before you can trade a pattern, you need to see it, and seeing it properly means understanding the human behaviour that carves it out.
The inverted head and shoulders is described by Investopedia as a major reversal signal that typically forms at the end of a downtrend. It is built from three successive troughs, with the middle one being the deepest, capped by a line of resistance called the neckline.
Here are the four pieces you are looking for:
- Left shoulder: The first trough. Sentiment is still pessimistic and sellers are firmly in control, pushing price to a new low. A small rally follows from short-covering and early bargain hunters, but it stalls under the neckline because the mood is still bearish.
- Head: The deepest trough. Selling resumes and drives price below the left-shoulder low, reinforcing the fear that the downtrend is intact. The rally that follows, however, is noticeably stronger, a sign that value buyers and sophisticated participants view the sell-off as overextended and begin accumulating.
- Right shoulder: A third decline that fails to make a new low. This shallower trough is the tell. It signals that selling pressure is fading and buyer conviction is building, often interpreted as stealth accumulation by stronger hands.
- Neckline: The horizontal or slightly sloping resistance line that connects the peaks between the troughs. Breaking above it is what confirms the reversal.
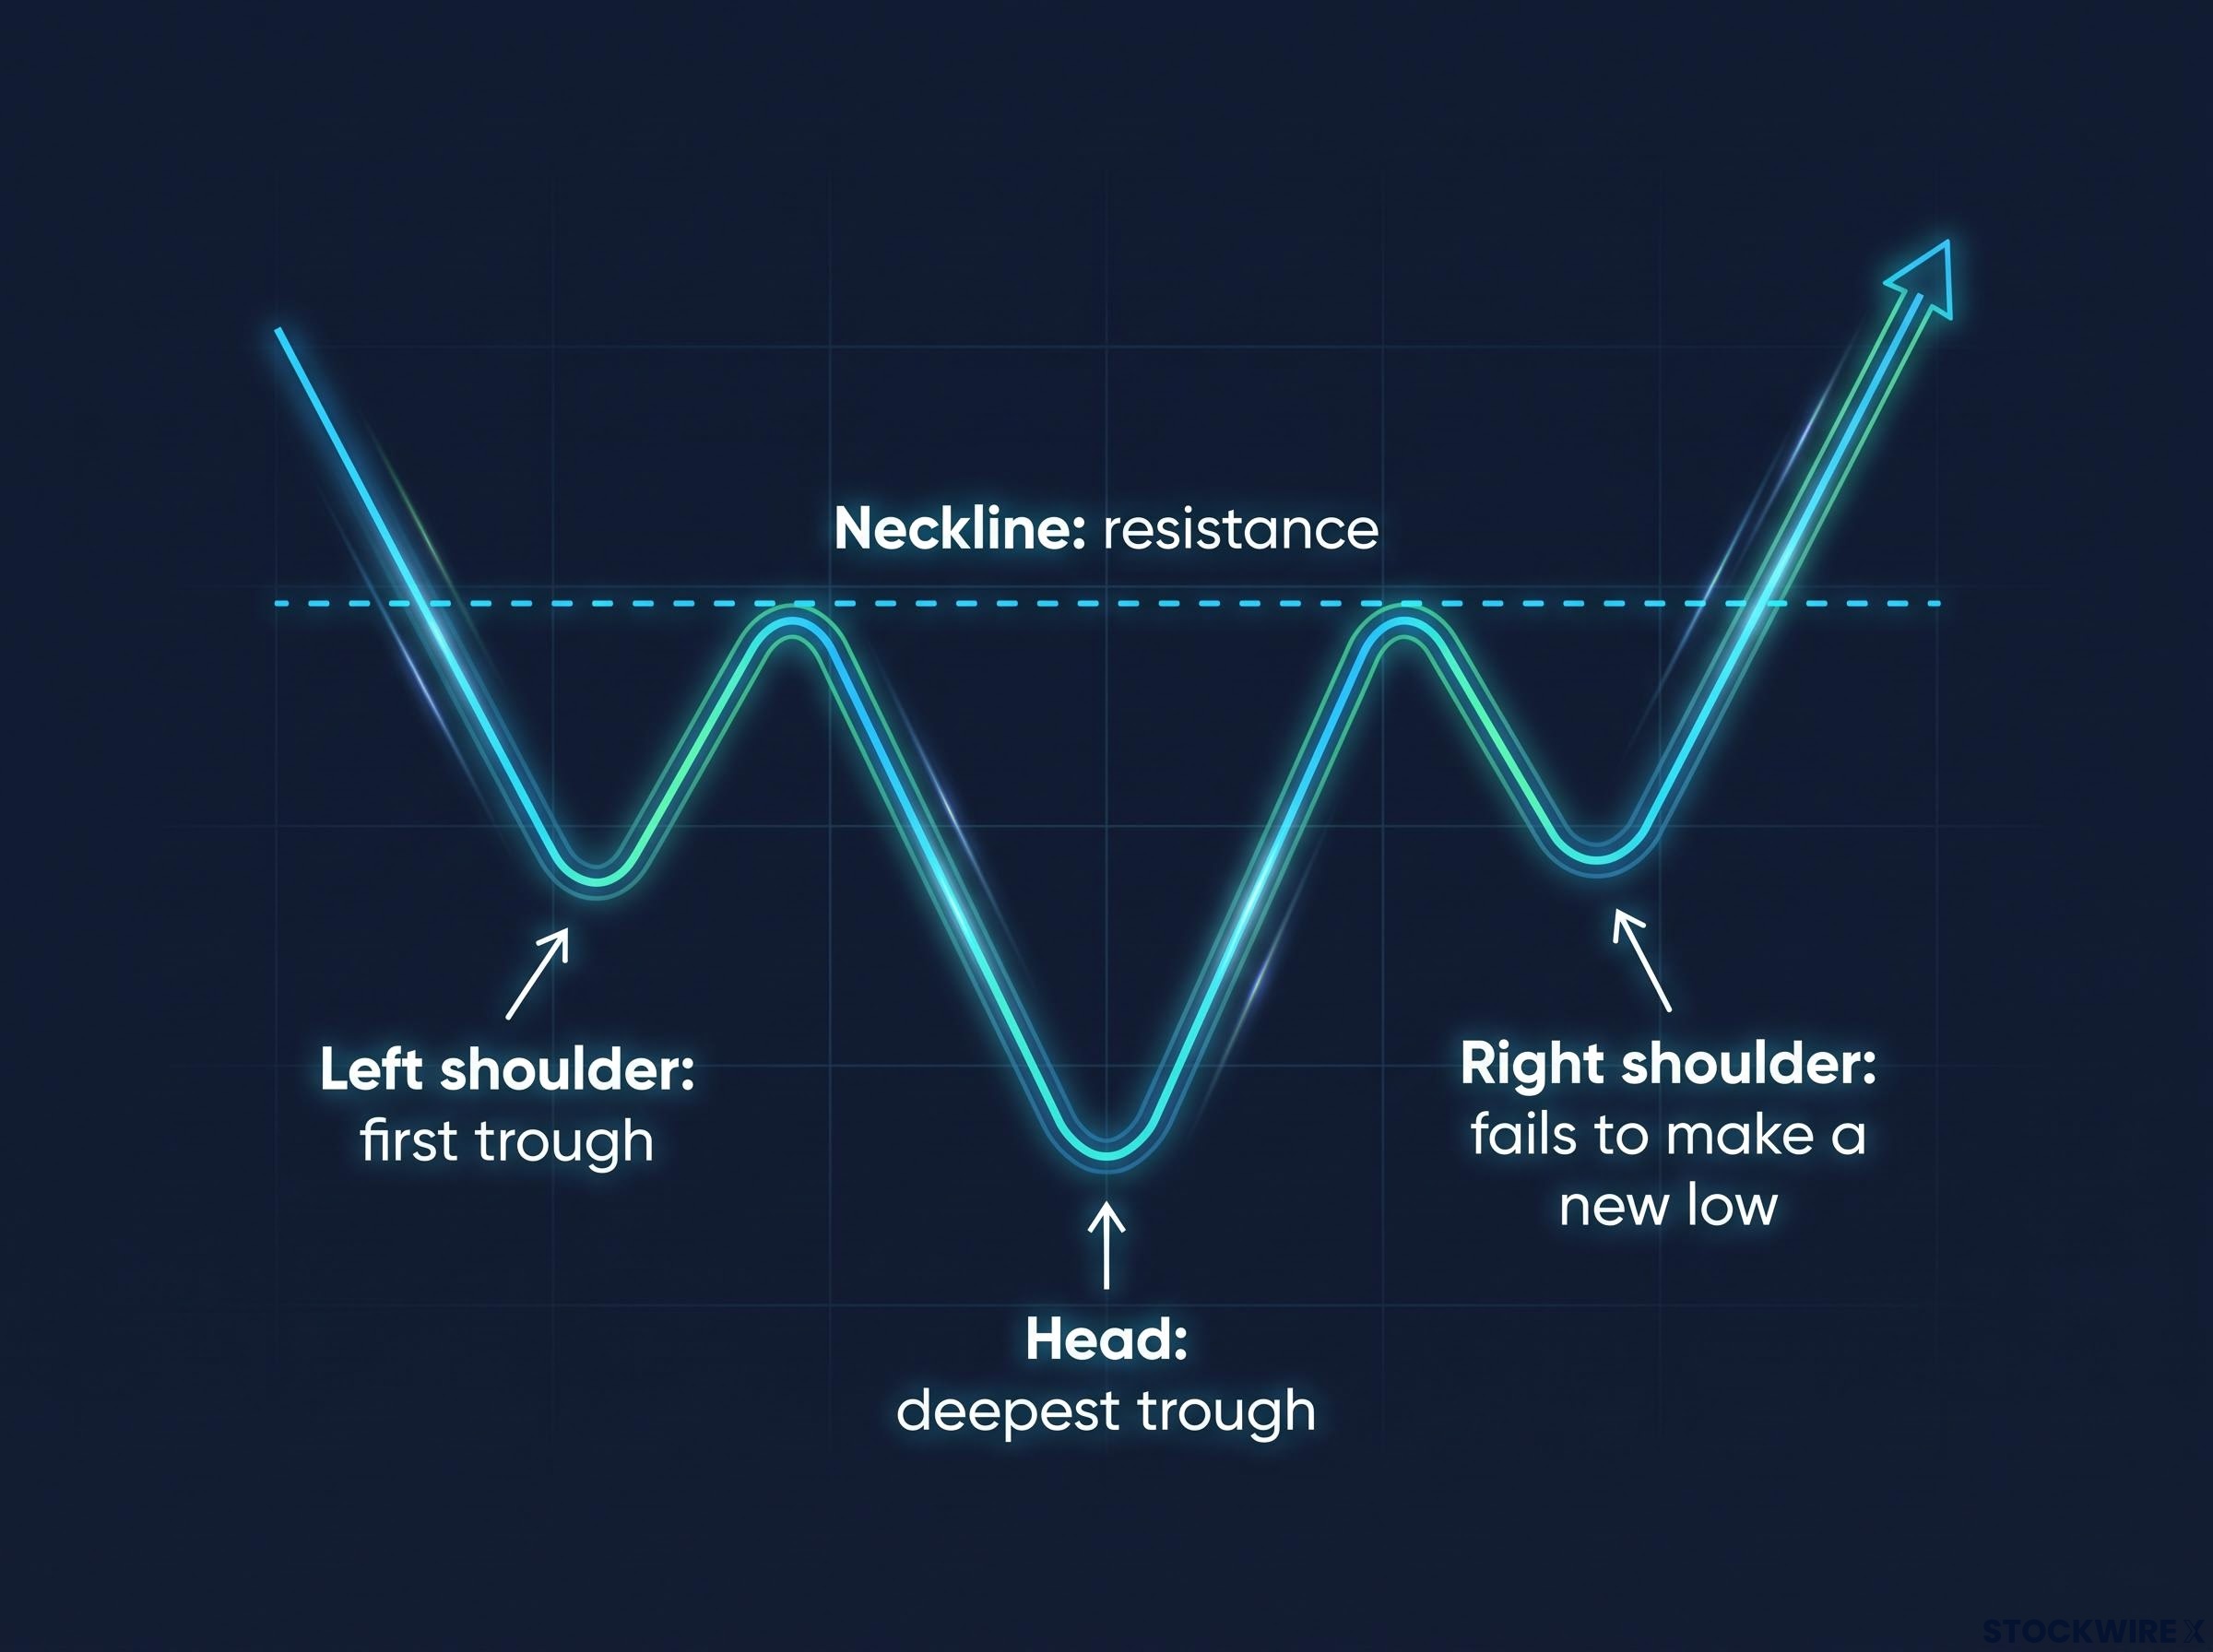
The movement from left shoulder to head to right shoulder is essentially a story of sellers gradually losing their grip. Each low becomes less severe than the last, which is the market telling you the balance of control is shifting toward buyers.
Investopedia connects this directly to behavioural finance, pointing to herd behaviour: once enough traders recognise the shape, they anticipate the bullish outcome and trade toward it, which can make the breakout partly self-fulfilling.
The August 2026 Bitcoin inverted head and shoulders breakout, which drove a nearly $4,000 single-session gain toward $84,000, offers a live case study in how the pattern performs under real market conditions, including the specific volume confirmation and Fibonacci confluence levels that separated the genuine move from a potential false signal.
Here is why the right shoulder matters most to you. A shallower right shoulder means sellers are exhausted, and recognising that gives you a structural edge over traders who only buy once the news turns good. You are reading the shift in sentiment before it becomes obvious, which is precisely what stops you from shorting into a quiet accumulation phase.
When big ASX news breaks, our subscribers know first
Plotting the measured move and defining your price targets
Once you can see the pattern, the next question is obvious: how far might price actually travel? This is where the pattern stops being a picture and becomes a plan.
The measured move gives you the answer. You take the vertical distance from the lowest point of the head up to the neckline, then project that same distance upward from the point where price breaks through the neckline. That projection is your target.
A worked example makes this concrete. Lawton, an analyst at Verified Investing, mapped an inverted head and shoulders on Bitcoin’s daily chart that formed over roughly 241 days from the start of the year, treating it as the primary setup for the week.
In that analysis, price had already broken above the neckline, with a pullback to retest it flagged as the entry point for a long position. The targets stacked up as follows.
| Target level | Price point | Rationale |
|---|---|---|
| Initial upside | ~$98,000 | First waypoint after the confirmed breakout |
| Anticipated resistance | $100,000 | Psychological barrier expected to cap price before any extended move |
| Measured move target | ~$107,500 | Head-to-neckline distance projected from the breakout, aligned with a prior high pivot from early November |
That final target is stronger because it lines up with an independent level, a prior high pivot. When a measured move and a separate structural level point at the same price, your confidence in the target should rise.
One detail matters enormously here: timeframe. Because this analysis sits on a daily chart, Lawton expects the full move to unfold over roughly 20-30 days, not a handful of sessions. Higher timeframes demand patience.
Projecting the measured move is what keeps you from selling a winning trade far too early, or clinging on for gains the structure never supported. You are scaling out based on chart geometry rather than hope, which takes a great deal of emotion out of the exit.
Measured move completion rates matter more than most guides acknowledge: Bulkowski’s study of over 2,800 head and shoulders patterns found only 51% reached the full projected target, a figure that rises substantially when volume confirmation and a neckline retest are applied as filters before entry.
Timing the entry and navigating the neckline retest
Mapping the target is the theory. Getting into the trade well is the practice, and the practice tends to punish impatience.
When price breaks above the neckline, the move often looks violent. Buy-stop orders sitting above resistance fire off, short sellers rush to cover their positions, and the combination creates a sudden surge in demand and volume that can spike price higher in minutes.
This is where two approaches diverge. The aggressive trader buys the exact moment the neckline breaks, accepting the risk of a false move in exchange for the best possible entry. The conservative trader waits for price to pull back and retest the neckline, letting former resistance prove itself as new support before committing capital.
Bitcoin’s 2025 price action shows what a clean, confirmed breakout looks like. CoinDesk reported on 10 September 2025 that Bitcoin surged past $113,600, confirming a bullish inverted head and shoulders and ending a pullback from record highs above $124,000.
Crucially, that breakout was not acting alone. It aligned with the 50-day simple moving average around $114,700 and was supported by ascending 50-, 100-, and 200-hour moving averages, evidence that the shorter-term trend had turned upward across multiple timeframes.
That is the concept of flipping prior resistance into a runway of support: the level that once blocked price becomes the floor it launches from.
The hardest part of this pattern is not spotting it. It is waiting. A breakout on thin volume can reverse just as fast as it rose, trapping everyone who chased the spike. Waiting for a confirmed retest of the neckline forces you to trade validated support rather than the fear of missing out.
Patience at entry directly reduces your odds of being caught in a false breakout. You are letting the market demonstrate its strength before you put money behind it.
Adding confluence and spotting invalidation warning signs
A perfect-looking pattern can still fail, and the traders who survive crypto are the ones who assume it might. Healthy scepticism is a position, not a weakness.
Volume is your first filter. Investopedia stresses that a decisive neckline break should come with rising trading volume, because a low-volume move lacks the broad participation needed to hold. In thinly traded conditions, a brief spike through the neckline without follow-through can whipsaw straight back and trap breakout buyers.
Timeframe is your second filter. Patterns on daily and weekly charts are considerably more reliable than intraday formations, because they reflect deeper shifts in sentiment rather than short-lived noise.
Macro context is your third. The chart pattern needs the broader regime to agree with it. In late September 2026, that regime turned constructive: Bitcoin printed a golden cross, where the 50-day moving average crossed above the 200-day, and delivered a weekly close above its 50-week moving average at $78,786, its first such close in 45 weeks. Galaxy Research head Alex Thorn told CoinDesk that a weekly close above the 50-week moving average “has historically preceded major bull runs.”
Golden cross signals, like the one Bitcoin printed heading into late September 2026, always arrive after prices have already trended in the new direction for weeks, which is precisely why pairing them with a price-structure pattern like the inverted head and shoulders gives you an earlier and higher-conviction entry than the moving average crossover alone.
The three most common ways an otherwise clean setup falls apart:
- Low volume: A neckline break with weak participation is prone to failure, especially in speculative crypto markets.
- Timeframe noise: Intraday formations produce far more false signals than daily or weekly structures.
- Macro overrides: A hostile macro backdrop or shifting positioning can invalidate a technically sound pattern regardless of how tidy the shape looks.
Critical invalidation triggers to watch
Some price action breaks the pattern outright, and when it does, the bullish thesis is simply wrong. Abandon it.
Two moves are decisive. The first is price dropping substantially below the right shoulder, which shatters the rising sequence of higher lows the pattern depends on. The second is a loss of structural symmetry, such as a right shoulder that stretches far too long or too deep relative to the left, distorting the shape past recognition. A sustained move back below the neckline after a breakout is a classic warning of a failed reversal.
This is exactly why you place your stop-loss just below the right shoulder. That level defines the point at which your read has been proven incorrect, and having it set in advance lets you exit with a small, controlled loss rather than a catastrophic one.
Knowing where a thesis is wrong is what turns a trade setup into a defensive position. It is the difference between a bruise and a wipeout.
Building a disciplined approach to technical trade setups
An inverted head and shoulders is a roadmap for shifting market psychology, not a prophecy. It tells you where sellers exhausted themselves and where buyers took control, but it never guarantees the next move.
The setups worth trading are the ones where the evidence stacks: the chart geometry, the volume behind a neckline break, and a moving average regime pointing the same way. When those three agree, as the golden cross and the 50-week close did in September 2026, your conviction rests on more than a single line on a screen.
Stacking technical indicators from genuinely independent analytical families, trend, volume, and price structure, raises the estimated probability of a trade moving in the anticipated direction from roughly 60% with one factor to approximately 85% with three, which is the statistical foundation for the confluence approach this guide recommends.
So do the work yourself. Map your own charts, measure your own targets, wait for the retest instead of chasing the spike, and cut the trade the moment it invalidates below the right shoulder. Discipline, not prediction, is what compounds.
This article is for informational purposes only and should not be considered financial advice. Investors should conduct their own research and consult with financial professionals before making investment decisions. Past performance does not guarantee future results, and price targets discussed are analyst projections subject to market conditions and various risk factors.