
#
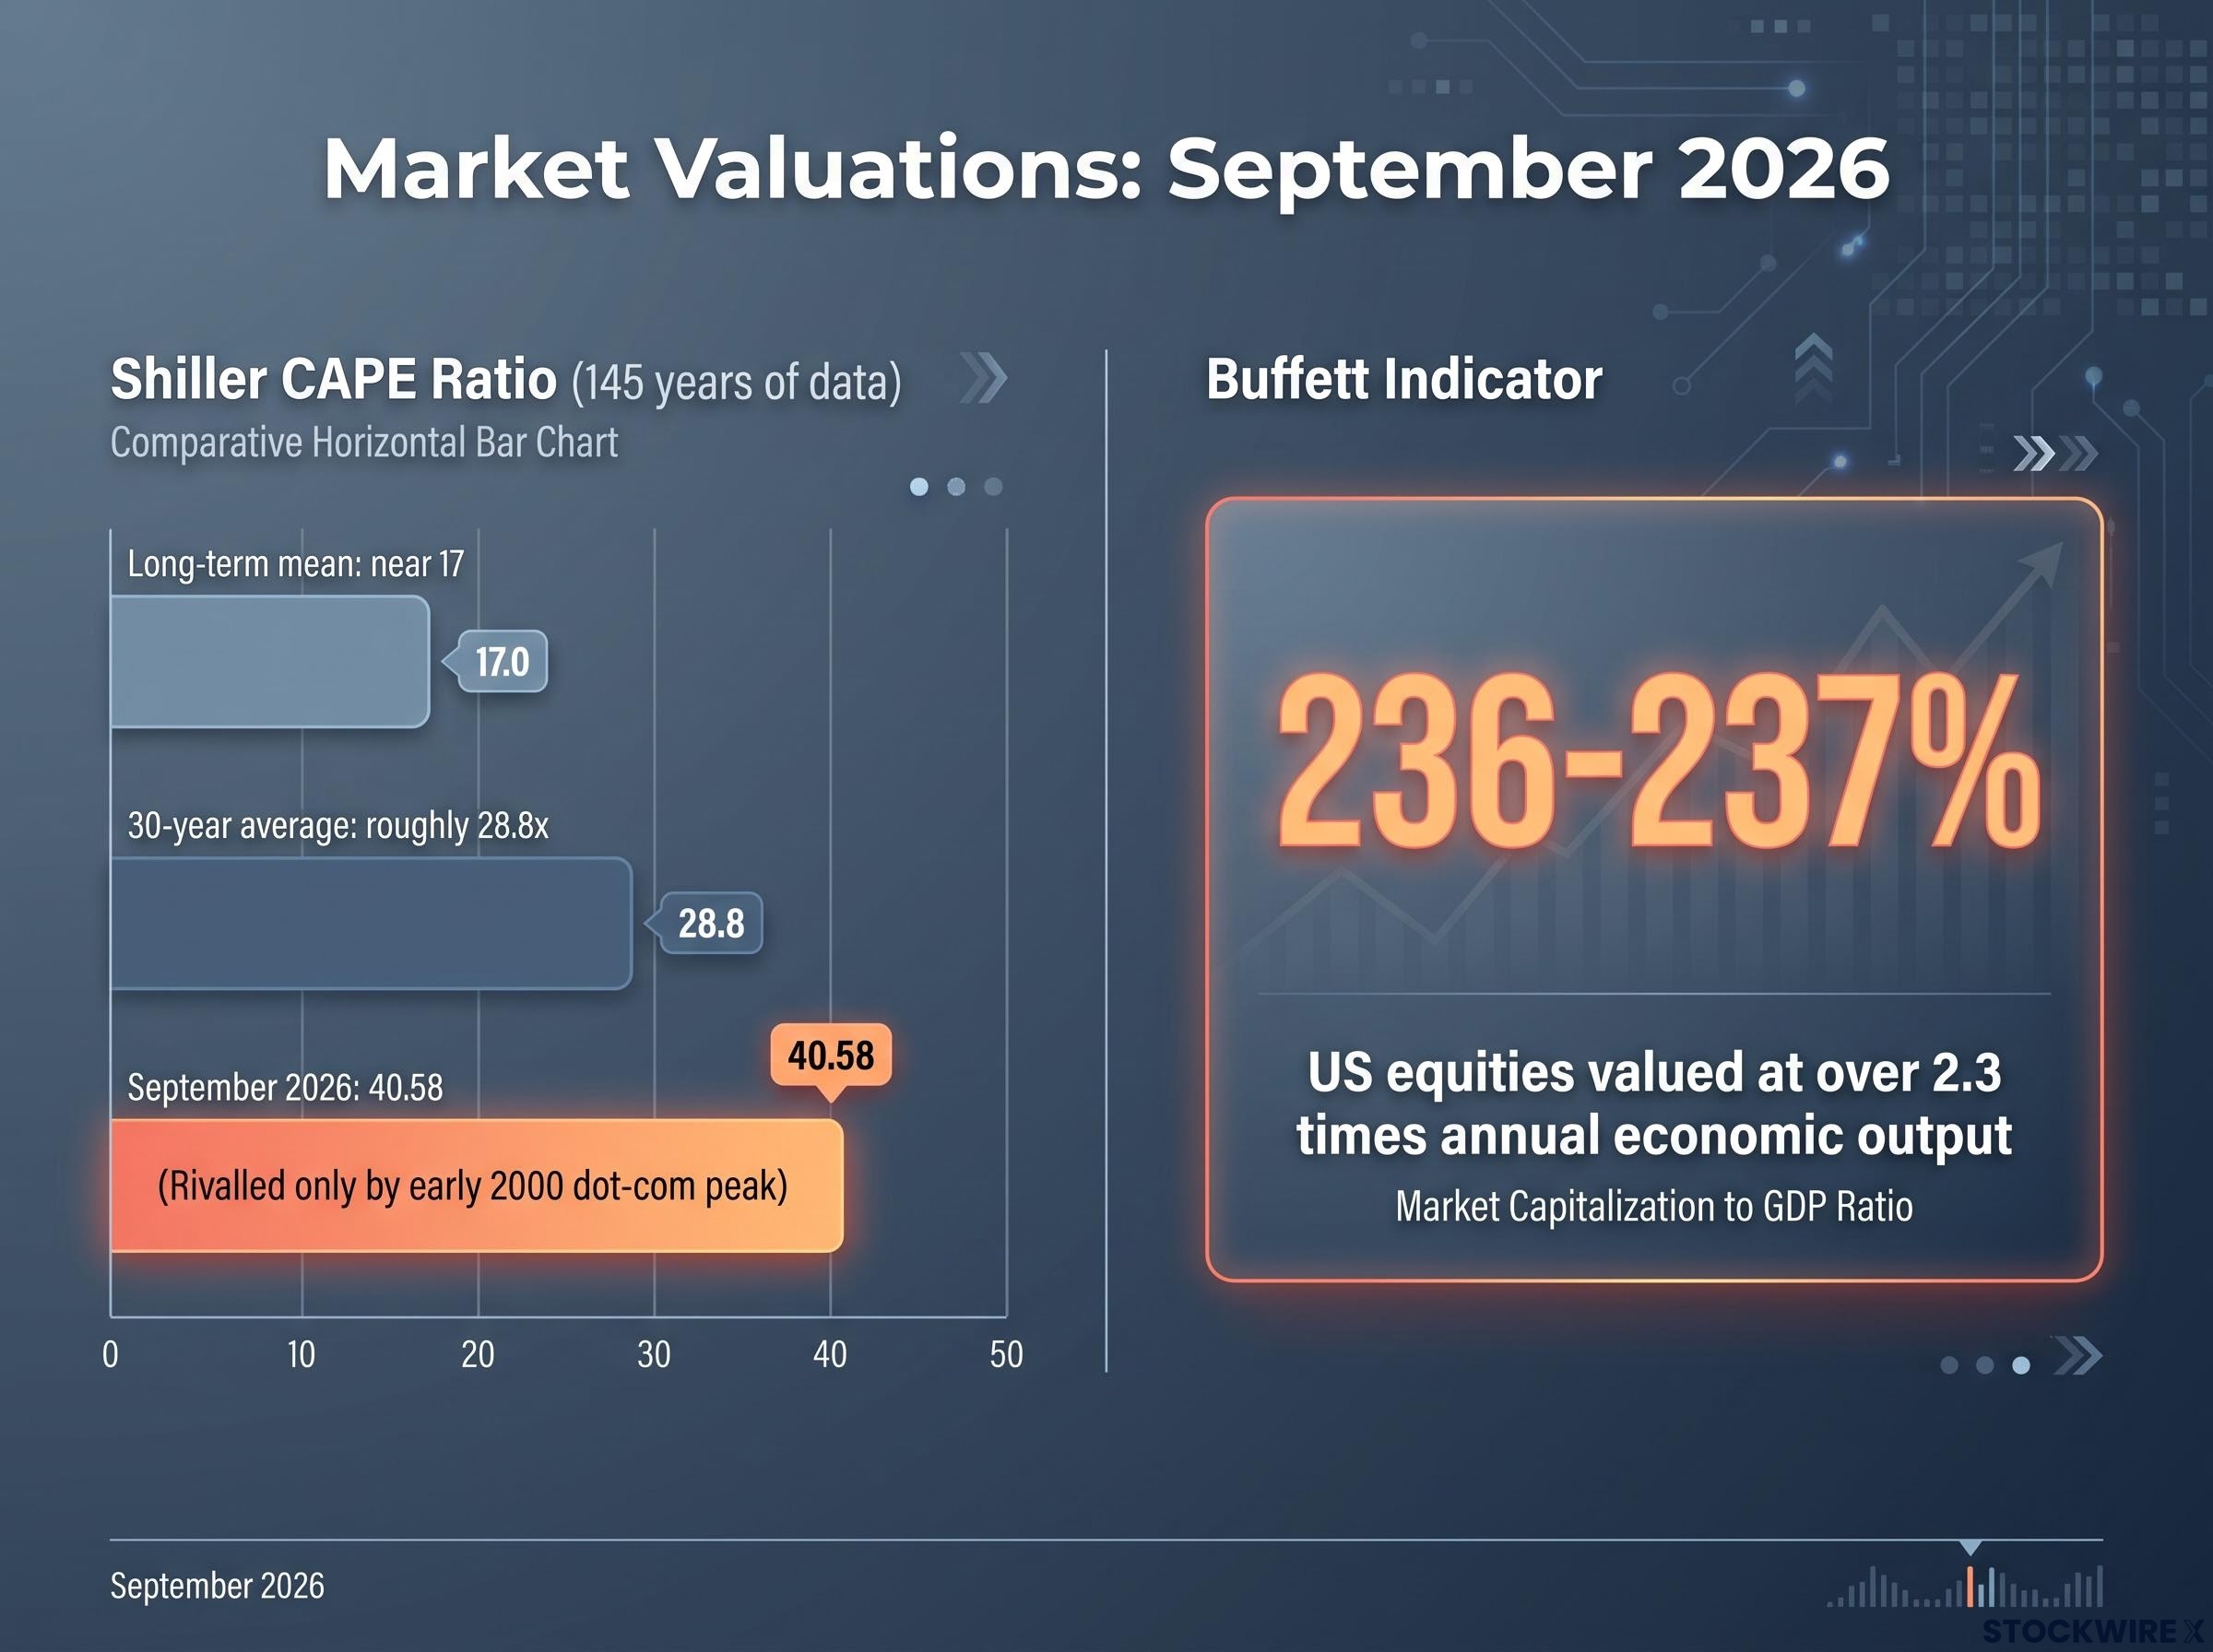
The Shiller CAPE ratio, a valuation measure that compares stock prices to a decade of inflation-adjusted earnings, sat at 40.58 in September 2026. That is near the second-highest reading in 145 years of data, rivalled only by the dot-com peak of early 2000.
Here is the uncomfortable part. Investors who sold a decade ago because the same signal looked stretched then missed one of the longest bull markets in recorded history. The alarm was real, and acting on it was the wrong move.
That is the paradox you have to resolve. When the metrics flash red, when analysts contradict each other, and when the market feels expensive, your instinct is to freeze, to overtrade, or to chase a story that promises the numbers do not matter. Every one of those instincts has a measurable cost, paid in compounding returns destroyed over years.
What follows here is different: a rational investing strategy built as a principle-anchored framework that functions regardless of where the market heads next. You will leave with specific tools, a tested decision architecture, and the ability to act deliberately instead of reactively.
Why your brain is working against your portfolio
You have probably done it at least once. The market drops, the headlines turn ugly, and you either sell to stop the bleeding or freeze in cash waiting for clarity that never quite arrives. That reaction feels like prudence. It is actually your biology.
The primary threat to your long-term returns is not the market. It is your own hardwired response to watching it move. The good news is that these responses are documented, predictable patterns, which means you can build defences against them.
The foundational work here comes from psychologists Daniel Kahneman and Amos Tversky, whose research on loss aversion showed that losses hurt far more than equivalent gains feel good. The pain of a $10,000 loss registers roughly twice as intensely as the pleasure of a $10,000 gain. That asymmetry is why selling during a drawdown feels urgent even when it destroys value.
Three patterns follow from this, and each one compounds the last:
- Loss aversion: Losses register as roughly twice as painful as equivalent gains feel good. In practice, this pushes you to capitulate at the bottom, exactly when selling costs you the most.
- Recency bias: You overweight the most recent market move and extend it into the infinite future. In practice, this is why a strong year makes people pile in and a bad year makes them flee.
- Action bias: Volatility triggers a need to do something to feel in control. In practice, this shows up as overtrading, sector rotation, and timing attempts that raise costs and taxes while lowering returns.
Fund flow data confirms this is not theoretical. Retail investors consistently pour net money into equities after strong multi-year bull runs and pull it out after bear markets. That is the exact inverse of buying low and selling high, and it is very likely a description of something you have already done.
Naming that pattern is the point. Once you can see it, you can stop repeating it.
The deepest trap is market timing itself, because it demands you be right twice.
To time the market successfully, you must exit near the peak and re-enter near the bottom. But market bottoms arrive wrapped in maximum fear and relentlessly negative news, which makes buying feel excruciating at the precise moment it is most rewarding. Being right once is hard. Being right twice, against your own psychology both times, is close to impossible.
The cost of market timing is not abstract: missing just 10 of the S&P 500’s best trading days over a decade converted a $272,000 portfolio into a $153,000 one, and seven of those 10 best days occurred within two weeks of the 10 worst days, making it structurally impossible to dodge crashes without also missing the recoveries.
When big ASX news breaks, our subscribers know first
The systematic answer to a problem you cannot think your way out of
If you cannot reliably override your emotions in the moment, the practical fix is to remove the decision from the moment entirely. That is what dollar-cost averaging (DCA) does. You contribute a fixed amount on a fixed schedule, and the market’s mood becomes irrelevant to whether you invest.
Let us be honest about the mathematics first, because the honest version makes the case stronger. Research from Morgan Stanley Wealth Management’s Davis Yost Group in 2026 examined 1,099 rolling seven-year periods and found that lump-sum investing beat DCA in more than 56% of them, with an average annualised advantage of 0.04% to 0.42%.
The reason is simple. Equity markets drift upward over time, so holding cash to deploy gradually creates drag: less of your money is working early. Stretch a DCA schedule too long and you increase that drag while raising the odds you abandon the plan halfway through.
Lump-sum investing outperformed DCA in more than 56% of 1,099 historical seven-year periods, according to Morgan Stanley’s Davis Yost Group. If you have a windfall to deploy, the maths favours investing it at once.
So why recommend DCA at all? Because most people are not deploying a windfall. They are investing from monthly income, and for that situation DCA is not a compromise on a better strategy. It is the correct tool. The maths above is being chosen for your actual circumstances, not sold to you as universally optimal.
The lump-sum versus DCA evidence across major markets consistently shows that capital held on the sidelines during a deployment schedule forfeits expected upside in roughly 70-75% of historical 12-month windows, which is the structural reason DCA optimises for behaviour rather than pure mathematics.
The engine of DCA’s power is what it does when prices fall. Your fixed contribution buys more shares precisely when they are cheapest, which feels awful and works beautifully.
| Share price | Shares bought per $500 | Running total shares | Value at recovery to $100 |
|---|---|---|---|
| $100 | 5.0 | 5.0 | $500 |
| $70 (down 30%) | 7.1 | 12.1 | $1,210 |
| $60 | 8.3 | 20.4 | $2,040 |
Look at what the discipline produces. An investor who kept buying through the decline holds 20.4 shares against $1,500 contributed, a portfolio gain exceeding 40% once the price returns to $100. An investor who paused during the fear merely returns to breakeven.
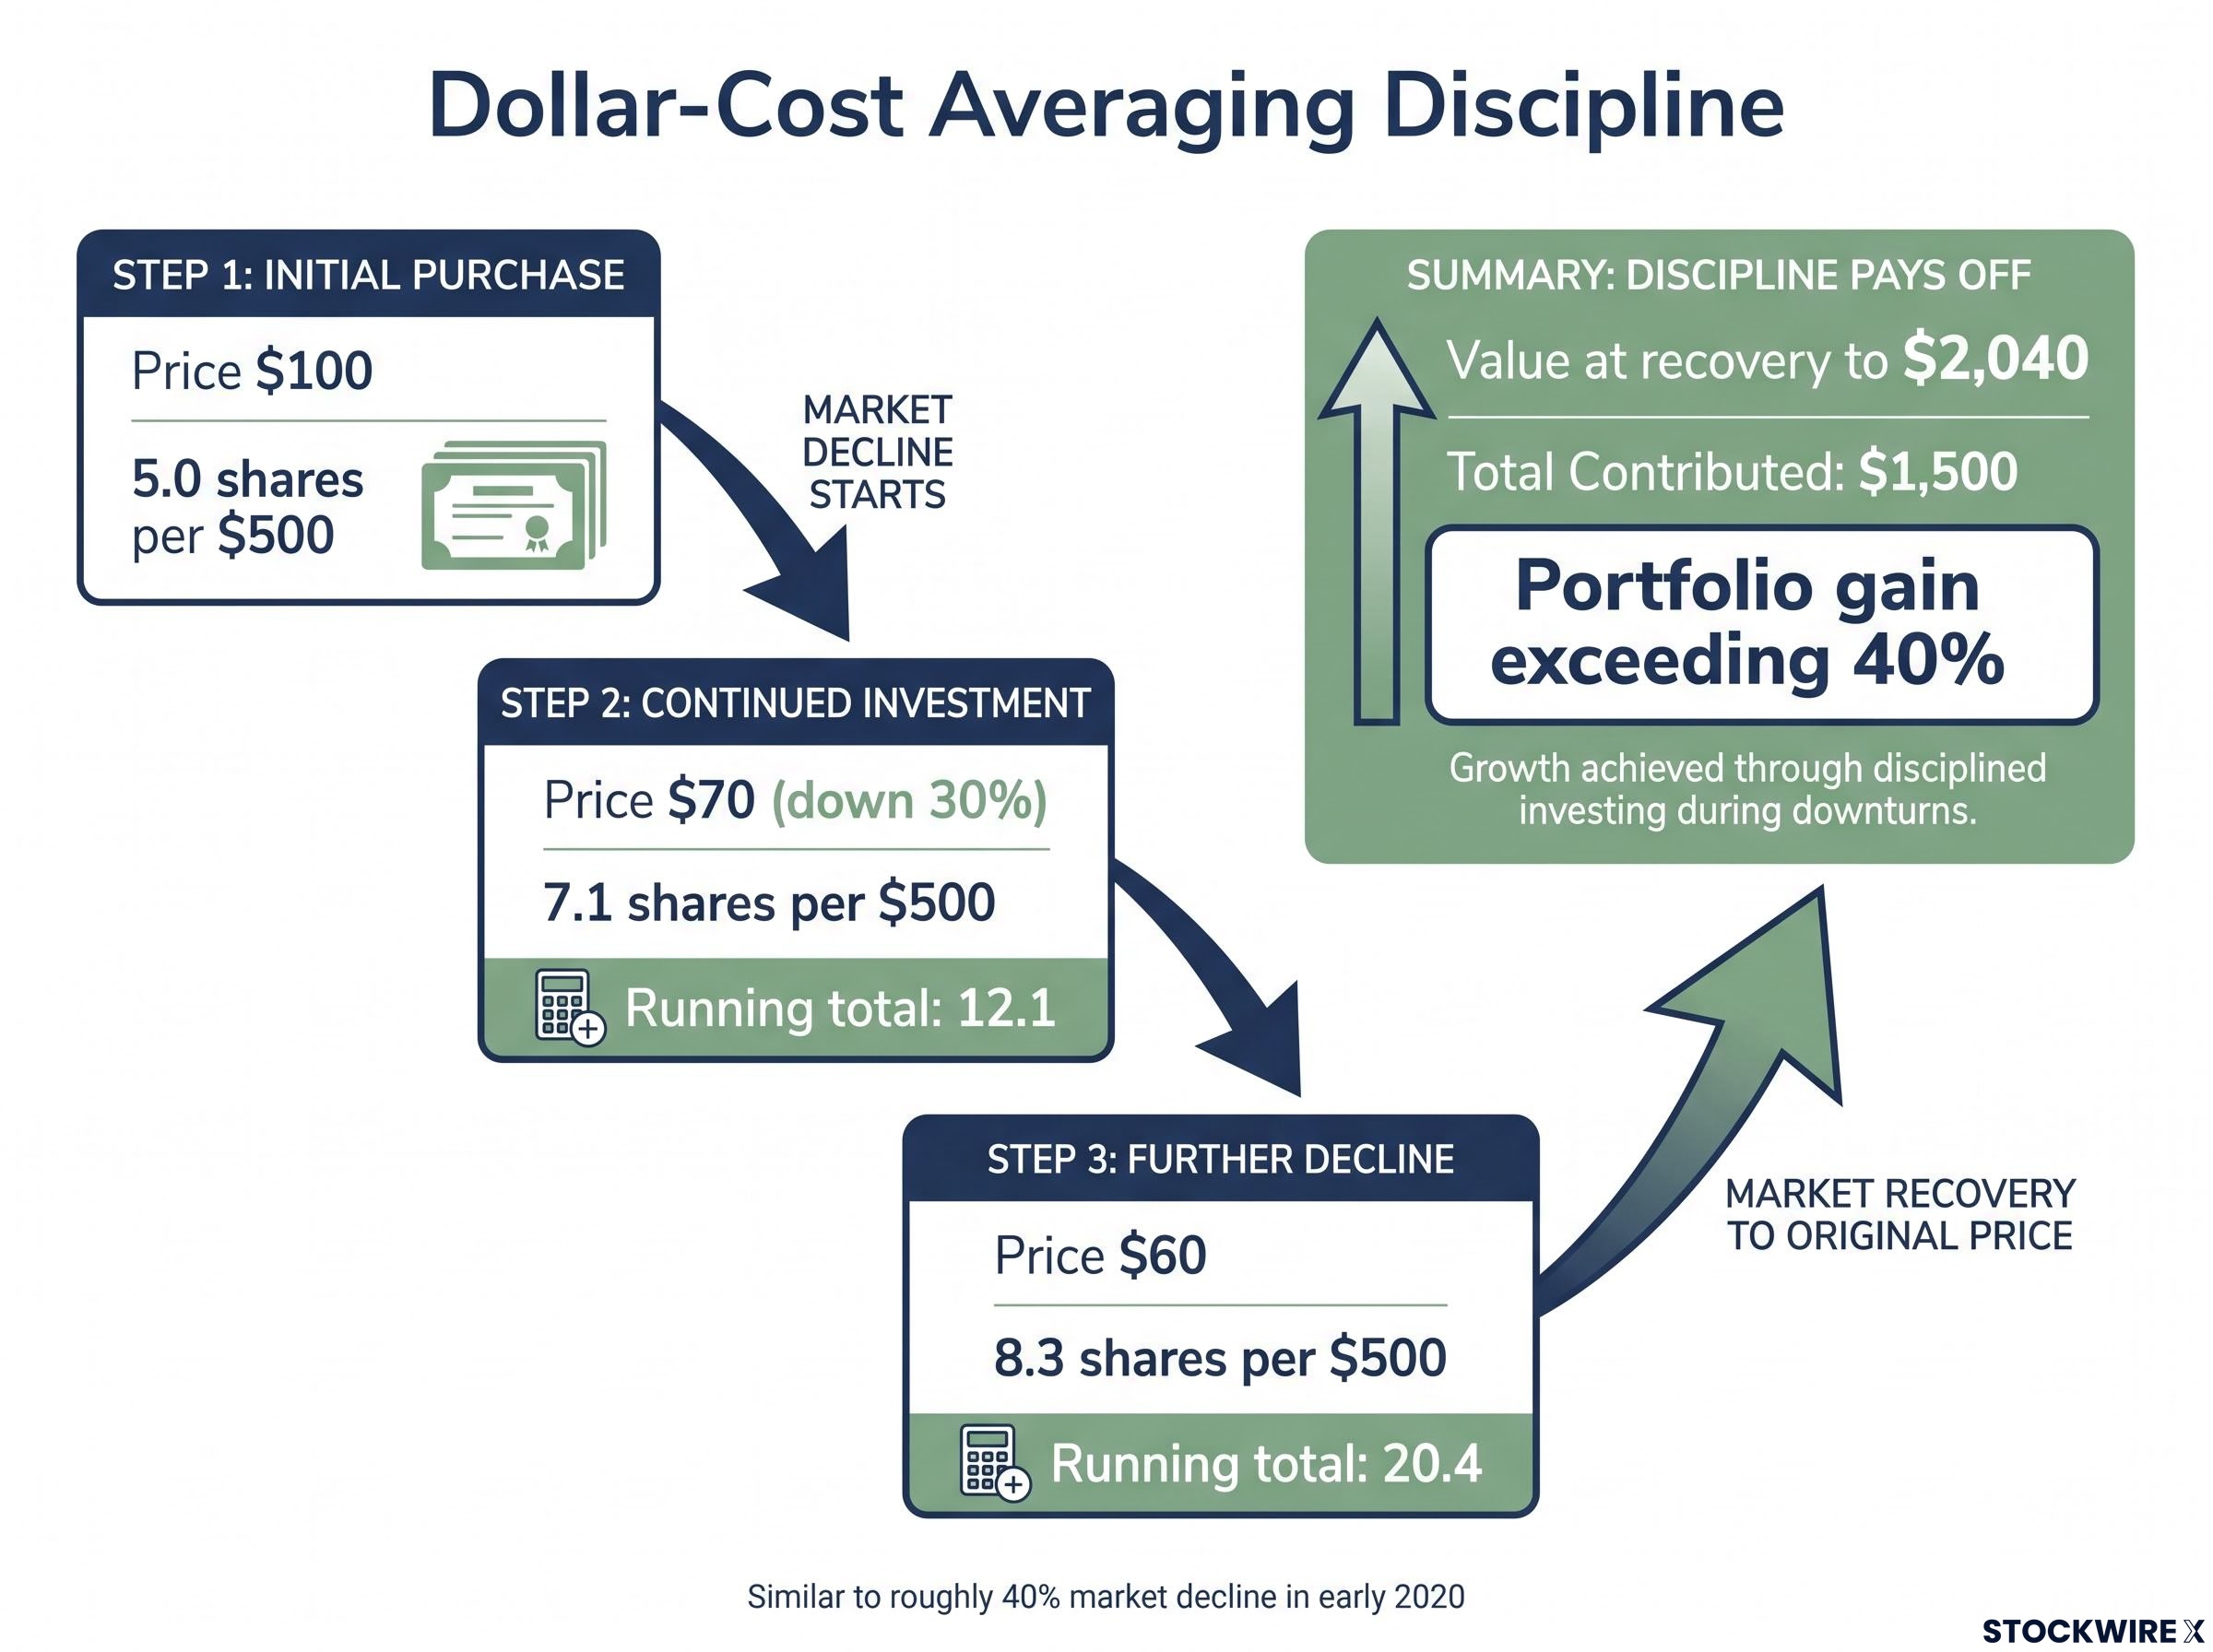
The roughly 40% market decline in early 2020 is the most recent real-world version of this. Automatic purchasers who did nothing but keep contributing captured some of the best entry prices of the decade, entirely by removing the decision from their own hands.
What the price tag tells you, and what it hides
Every investment decision comes down to one distinction that most people never make cleanly: the difference between price and value.
Market price is the number on the screen. It is instantly observable, it moves continuously on sentiment, and it requires no analysis to find. Intrinsic value is something you have to calculate: the present worth of all the future cash a business will generate over its life. The two numbers are rarely the same, and often far apart.
Overpaying has a cost you can measure in years of your life. Pay 30% above intrinsic value and you typically wait around five years just to recover your capital before earning any real return. Someone who paid fair value for the identical business is already compounding meaningfully while you wait to break even.
That cost matters more now than at almost any point in living memory. Alongside the CAPE at 40.58, well above its long-term mean near 17 and its 30-year average of roughly 28.8x, the Buffett Indicator (total market value divided by GDP) sat at approximately 236-237% in September 2026. That means US equities were valued at over 2.3 times the country’s annual economic output.
Neither reading predicts a crash on any timeline. What they tell you is that your margin for overpaying is the thinnest it has been in a generation, which raises the precision required in every individual decision you make today.
When the story outpaces the business
A compelling narrative can talk you into a price that assumes a flawless future, leaving zero room for error if reality disappoints. The years 2020 to 2024 offered a run of case studies in exactly that:
- Pandemic winners: Zoom and Peloton surged on the story of permanently changed behaviour, then collapsed when growth normalised and valuations proved detached from realistic cash flows.
- SPACs and pre-revenue EVs: Nikola and similar names reached multi-billion-dollar valuations on prototypes and forecasts, then fell hard when production and revenue targets were missed.
- Meme stocks: GameStop soared on a social-media narrative of short squeezes and retail power, wholly disconnected from a declining core business, before a severe drawdown followed.
- High-growth tech reratings: Cloud and software stocks priced for perfection suffered large valuation compressions once interest rates normalised.
The live version of this test is playing out now. Elon Musk has projected that Tesla could reach a $30 trillion valuation if its AI and Optimus robotics ambitions fully succeed. Whether or not the technology delivers, the projection carries no cash flow model, no financial timeline, and no price analysis, which makes it a story rather than an input you can actually invest on. The question is never whether a company is excellent. It is whether the price asked is lower than what the business is worth.
Five principles that function as a filter, not a forecast
The five principles below are not a checklist to memorise and forget. Applied together, they work as a pre-decision filter that screens out most of the choices that destroy long-term returns before you ever make them. They do not tell you what will happen. They tell you whether a decision is structurally sound enough to make.
- Investor, not speculator. An investor buys ownership in a real business to share its long-term profits; a speculator bets on what someone else will pay later. Before any purchase, ask which one you are actually being, because most speculation is done by people who believe they are investing.
- Value is future cash flows. An investment is worth the present value of the cash the business will generate over time. Following Warren Buffett’s framework, if you cannot reasonably predict a company’s earnings over a ten-year horizon, treat that as a reason to pass rather than a puzzle to solve.
- Stay inside your circle of competence. If you cannot clearly explain how a company makes its money, that is disqualifying, not a detail. For most people this rules out banks, insurers, utilities, and highly cyclical commodity businesses, and the discomfort of eliminating them is the principle working correctly.
- Voting machine now, weighing machine later. Short-term prices are a popularity contest driven by sentiment; long-term prices reflect real business performance. Hold this in mind and it becomes your defence against both panic selling in crashes and euphoric buying in rallies.
- A great story at the wrong price is a poor investment. Exceptional potential already fully priced in leaves no margin for error. Your success often depends less on the quality of the company than on the price you paid for it.
Applying intrinsic value screening metrics in a high-CAPE environment requires distinguishing a structurally declining business from a temporarily mispriced one, a distinction that separates genuine value from a value trap and is the most common analytical failure point for retail investors working through a five-principle filter.
The most memorable of these deserves to stand on its own.
“In the short run, the market is a voting machine. In the long run, it is a weighing machine.” The framing is attributed to Benjamin Graham, and it is the structural antidote to both panic selling and euphoric buying.
An investment that clears all five criteria has survived a genuine, multi-dimensional test. One that fails even a single criterion carries a structural weakness worth naming out loud before you commit a cent.
What elevated valuations actually tell you, and what to do now
Now the opening paradox resolves. Holding two ideas at once, that the valuation signals deserve to be taken seriously and that timing the market on them is historically destructive, is not a contradiction. It is the correct analytical position, and the framework you have just built is designed to function precisely in that condition.
A CAPE above 40 and a Buffett Indicator above 230% are not timing signals. They are reasons to lower your long-term return expectations, since the September 2026 CAPE of 40.58 sits near the second-highest level in 145 years and points to muted forward returns over the next decade relative to the last one. They are also reasons to raise the precision of every individual selection.
Notice how the two halves of this framework fit together. DCA solves the behavioural problem of when to deploy capital by removing the decision from your hands. The five principles solve the analytical problem of what to deploy it into by applying a structural filter. One guards against emotion, the other against narrative.
Here is where that leaves your immediate position:
- Keep contributing systematically. Do not pause your schedule because valuations make you anxious; the early 2020 drawdown showed that investors who kept buying captured prices the pausers never got.
- Apply the principles more rigorously than usual. In a high-multiple environment, lean harder on circle of competence and intrinsic value than you would when multiples are cheap.
- Disqualify, do not defer. Any opportunity that cannot survive all five principles is out, not parked for later.
For investors ready to apply a full quantitative framework to individual selections, our comprehensive walkthrough of margin of safety valuation shows how to discount ten years of projected free cash flow at a 15% return hurdle and calibrate the required discount to business quality.
If you leave this section with one operational change, replacing ad hoc decisions with a systematic schedule and a five-principle filter, you have made a structural improvement that compounds across any market condition.
This article is for informational purposes only and should not be considered financial advice. Investors should conduct their own research and consult with financial professionals before making investment decisions. Past performance does not guarantee future results, and financial projections are subject to market conditions and various risk factors.
The framework holds when the market does not
Rational investing under difficult conditions was never about achieving certainty. It is about building a decision architecture that stops emotional and narrative-driven errors from compounding into permanent loss.
The three components work as one system, each covering a different way investors fail. Psychological awareness lets you see your own biases before they act on you. Systematic contribution mechanics remove the timing decision that your biases would otherwise corrupt. And the five-principle filter screens the analytical choices that no schedule can make for you.
The expensive market in front of you is not a reason to delay building or maintaining this approach. It is the exact condition the approach was designed for.
Your next step is small and concrete. Take one investment you currently hold or are considering, run it through the five principles, and decide honestly whether it survives all five. That single test is your entry point to the framework in practice.