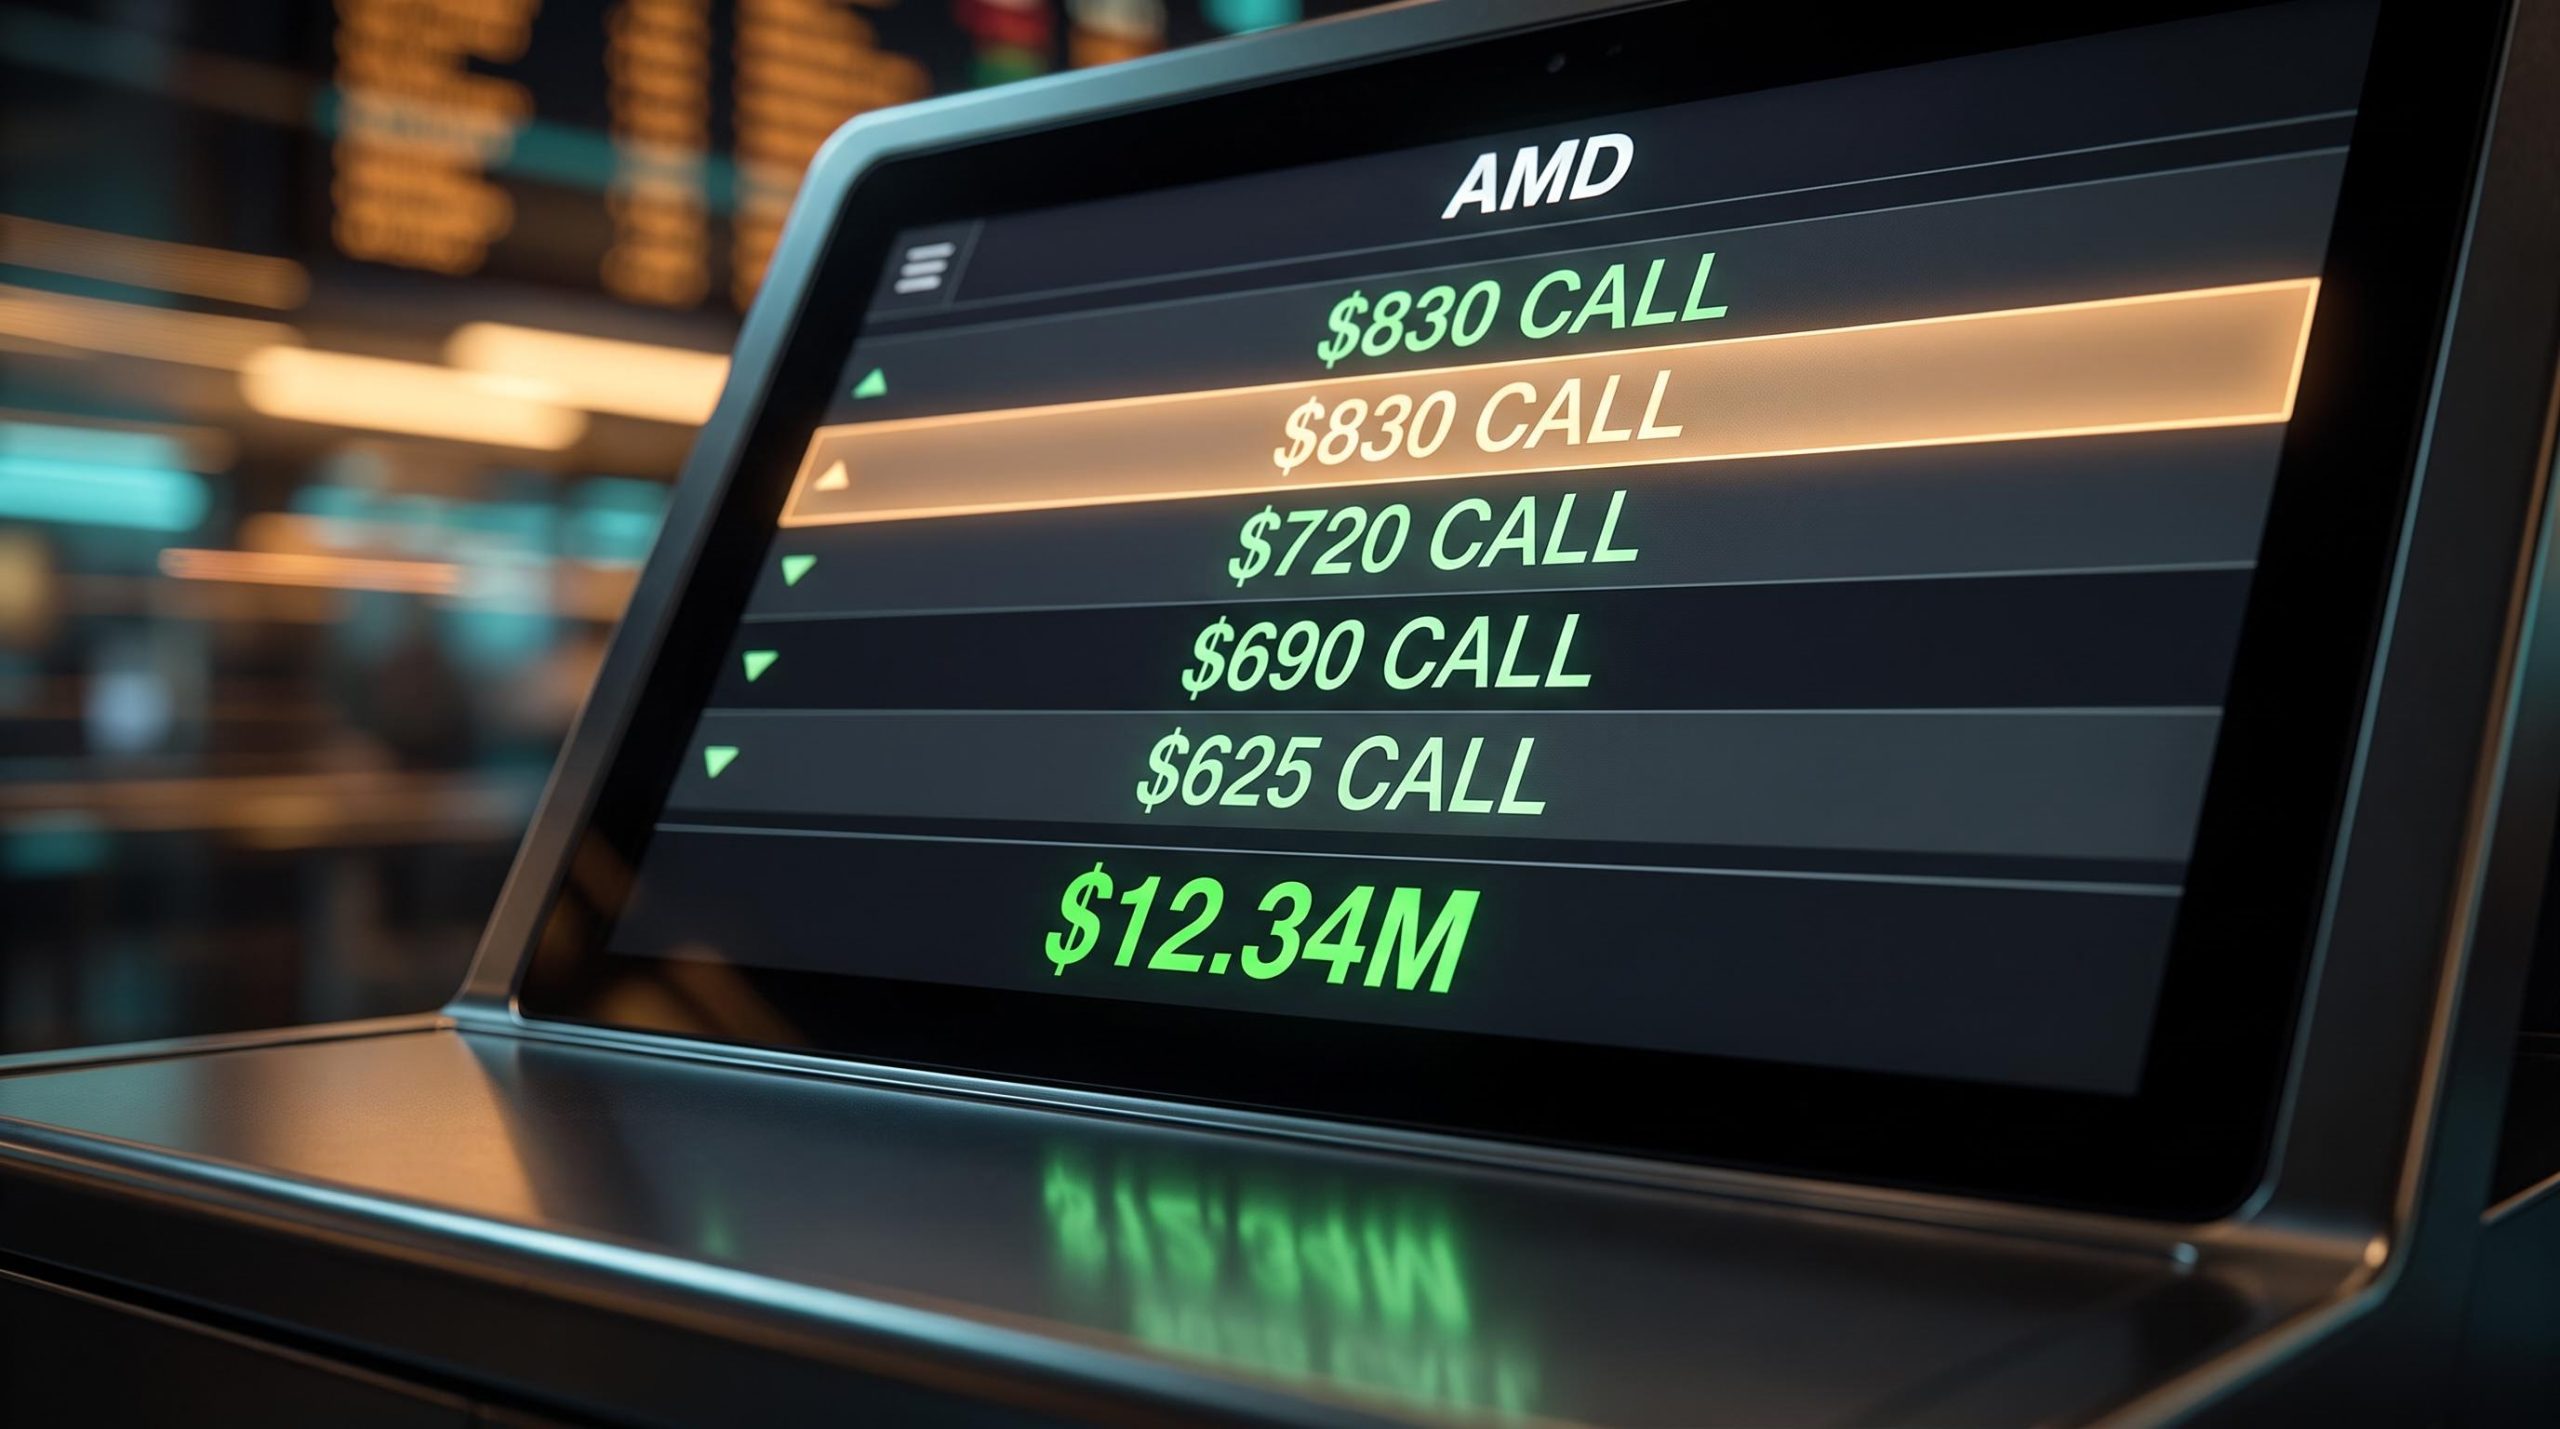
You see the alert flash across your feed: some institution just committed roughly $12 million to bullish AMD call options over the space of a few trading days. Your platform has flagged it as unusual. And now you have a decision to make, except you have no framework for making it.
That gap is the actual problem. Unusual options activity scanners are everywhere now, bundled into brokerage apps and dedicated analytics platforms, but the interpretive layer that turns a raw alert into a usable signal is not. Reading the flow correctly means understanding what strike selection, expiration timing, and premium size each reveal on their own, and then what they reveal when you read them together.
This is a practical toolkit for doing exactly that. Using a real cluster of AMD trades as the worked example, you will learn how to look at any unusual options alert and run through the same interpretive questions experienced traders apply before they act. The stock is just the vehicle. The skill is the point.
What “unusual options activity” actually means, and why it gets misread
Most people assume an unusual options alert is a buy signal in disguise. Someone big is betting on the stock, so you should too. That assumption is where the money gets lost.
Unusual options activity is, at its core, a statistical observation: trading volume at a specific strike price has deviated sharply from its normal daily level. That is all the alert confirms. It does not tell you whether the trade was a bet, a hedge, or one leg of something more complicated. It flags that something happened, not what it means.
Strike selection and premium sizing do not exist in isolation; reading options chain sentiment alongside call-to-put ratios, implied volatility rank, and far-out-of-the-money crowding gives you a more complete picture of whether directional flow reflects genuine conviction or speculative noise.
The three reasons institutions generate unusual flow
Institutions create large, unusual options flow for very different reasons, and they often look identical on a scanner:
- Directional conviction bet: the trader genuinely expects the stock to move a certain amount in a certain direction.
- Portfolio hedge: the options offset risk in an existing position, meaning the flow is defensive, not aggressive.
- Multi-leg structural trade: the visible trade is one piece of a spread or a delta hedge against a short stock position, so a bullish-looking call could be part of a neutral or even bearish overall book.
That last point matters most. A large call purchase that reads as bullish in isolation might be the long leg of a spread, or a hedge against a short position the scanner cannot see. The alert shows you the leg, not the strategy.
This is why the AMD case is useful. Options analytics platforms flagged seven bullish trades across four trading sessions, totalling roughly $12.34 million in net-long premium. One useful tell that these were fresh bets rather than rolled-over contracts: open interest at the $720 strike expanded by nearly 199%. Frameworks from the Options Industry Council and Lawrence McMillan’s Options as a Strategic Investment point to four markers of genuine directional conviction: net-long premium, out-of-the-money strikes laddered upward, execution clustered across sessions, and no obvious offsetting flow. The alert tells you something happened. The structure tells you what it might mean, and skipping straight to action without reading that structure is the most consistent way retail traders lose on options flow.
When big ASX news breaks, our subscribers know first
How strike selection reveals the magnitude of conviction
Once you accept that the structure matters, strike selection is the first place to look, because it tells you not just which direction a trader expects, but how far they think the stock will travel.
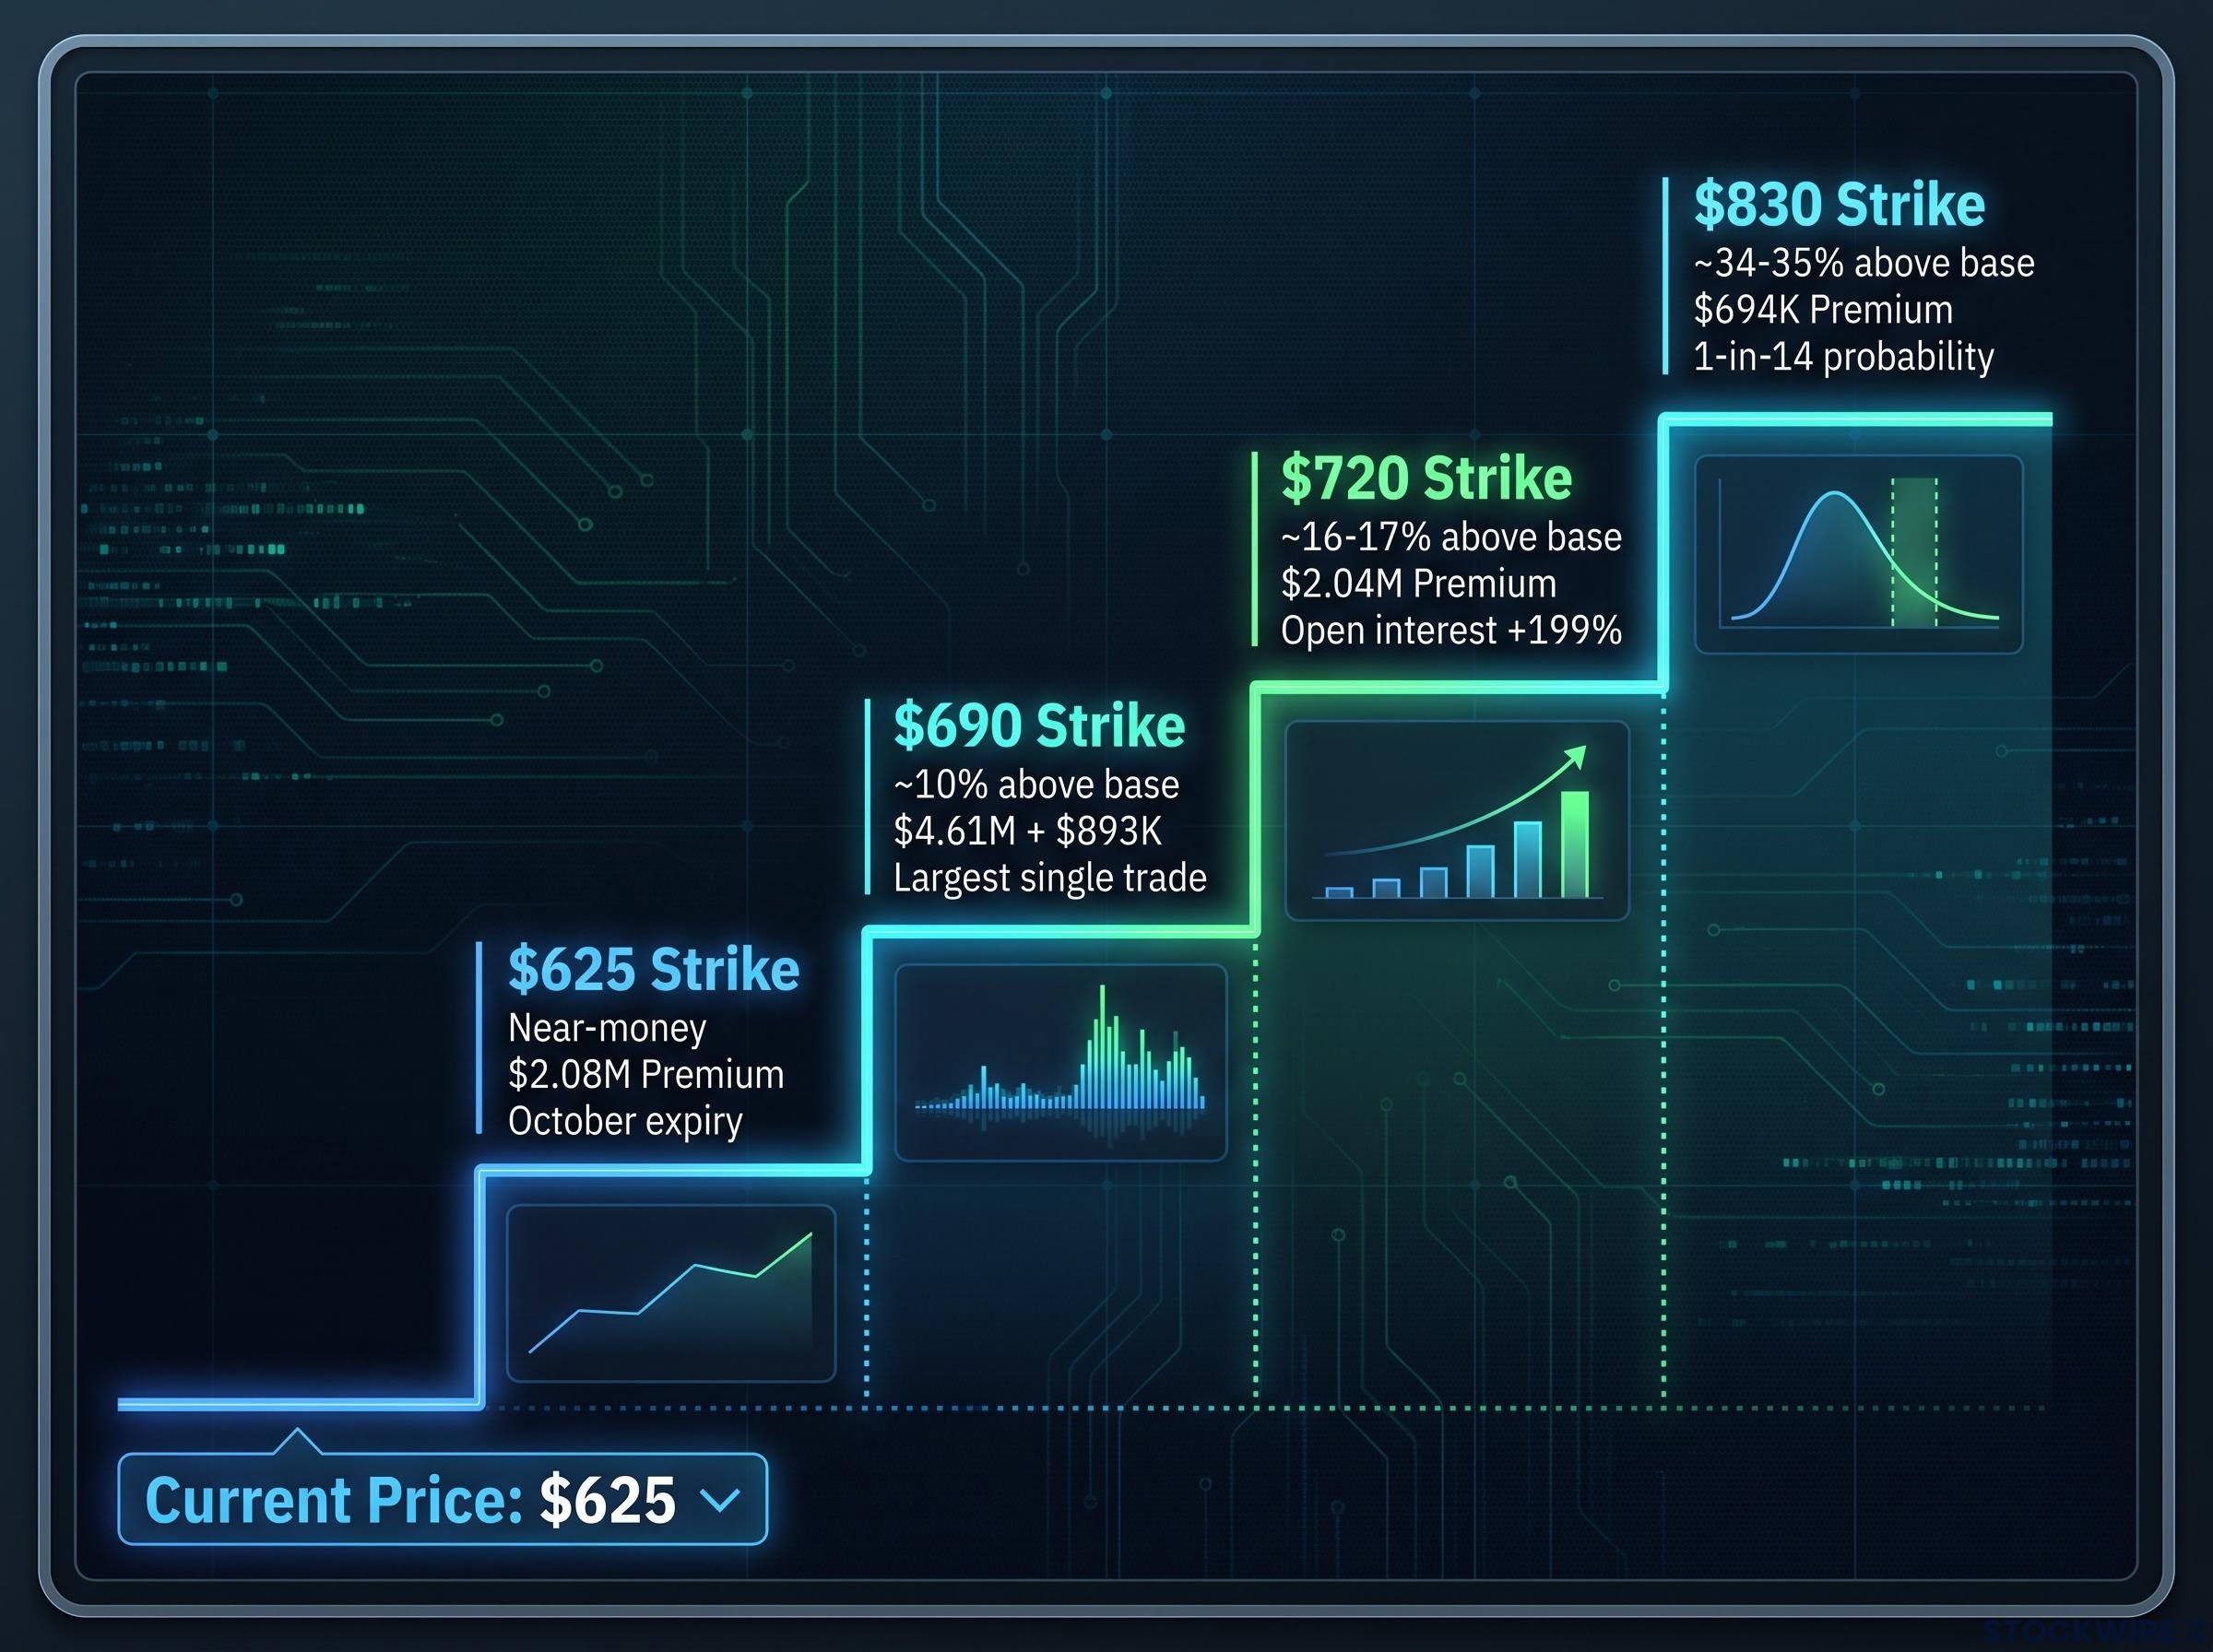
Out-of-the-money call strikes, ones set above the current share price, are a direct statement about the magnitude of an expected move. The further above the share price a strike sits, the bigger the move it needs before it pays off, and the lower the odds of that happening. Reading the AMD strikes in order is like climbing a ladder of increasing ambition, with AMD trading around $625 at the time.
At the bottom rung, near-the-money $625-strike October calls took $2.08 million. Step up to the $690 strike, roughly 10% above the base, and you find the largest single trade of the cohort: $4.61 million in November calls, plus another $893,000 expiring in October. The $720 strike, about 16-17% above the base, drew $2.04 million, with that near-199% jump in open interest confirming fresh positioning.
Then the top rung. The $830-strike November calls, sitting roughly 34-35% above the share price, took $694,000.
| Strike | Approx. distance above $625 | Premium committed | Notable detail |
|---|---|---|---|
| $625 | Near-money | $2.08M | October expiry |
| $690 | ~10% | $4.61M + $893K | Largest single trade |
| $720 | ~16-17% | $2.04M | Open interest +199% |
| $830 | ~34-35% | $694K | ~1-in-14 to finish in the money |
At the time of analysis, the $830-strike calls carried roughly a 1-in-14 probability of expiring in the money.
The 1-in-14 figure cited for the $830-strike calls is an expiration probability, and options pricing probability works in two distinct modes: the chance of finishing in the money at expiration versus the higher probability of touching that level at any point during the life of the trade, a distinction that changes how stop-loss and rolling decisions should be framed.
That figure reframes the whole trade. The $830 strike is not a hedge and it is not a cautious position. It is a low-probability, high-leverage bet that AMD makes a dramatic move, placed by someone willing to lose the entire premium in exchange for outsized upside if they are right. When you read the ladder from near-money to deep out-of-the-money, you are reading the scale of the thesis, not just its direction.
Why expiration timing is the most underread dimension of options flow
Strike selection gets attention. Expiration timing rarely does, and that is exactly why it so often separates a real signal from pattern-matching noise. The date a trader chooses tells you when they expect their thesis to resolve, and clustering premium into one expiration cycle is a deliberate call about catalyst timing.
In the AMD trades, one date does most of the talking. Roughly $7.34 million, about 60% of the total premium, landed in the 20 November 2026 expiration. AMD’s Q3 2026 earnings are expected around 2-3 November 2026. That places the bulk of the money in a cycle expiring roughly two weeks after the announcement, giving the thesis room to resolve once the results are out.
The shorter-dated trades tell a different story. Here they are in order:
- September expiries: two smaller trades at the $635 and $622.50 strikes, betting on near-term price momentum before earnings.
- 9 October expiry: $2.08 million in $625-strike calls, still a pre-earnings momentum position.
- 16 October expiry: $893,000 in $690-strike calls, expiring before the results land.
- 20 November expiry: $7.34 million, the earnings-resolution bet, and the heart of the cohort.
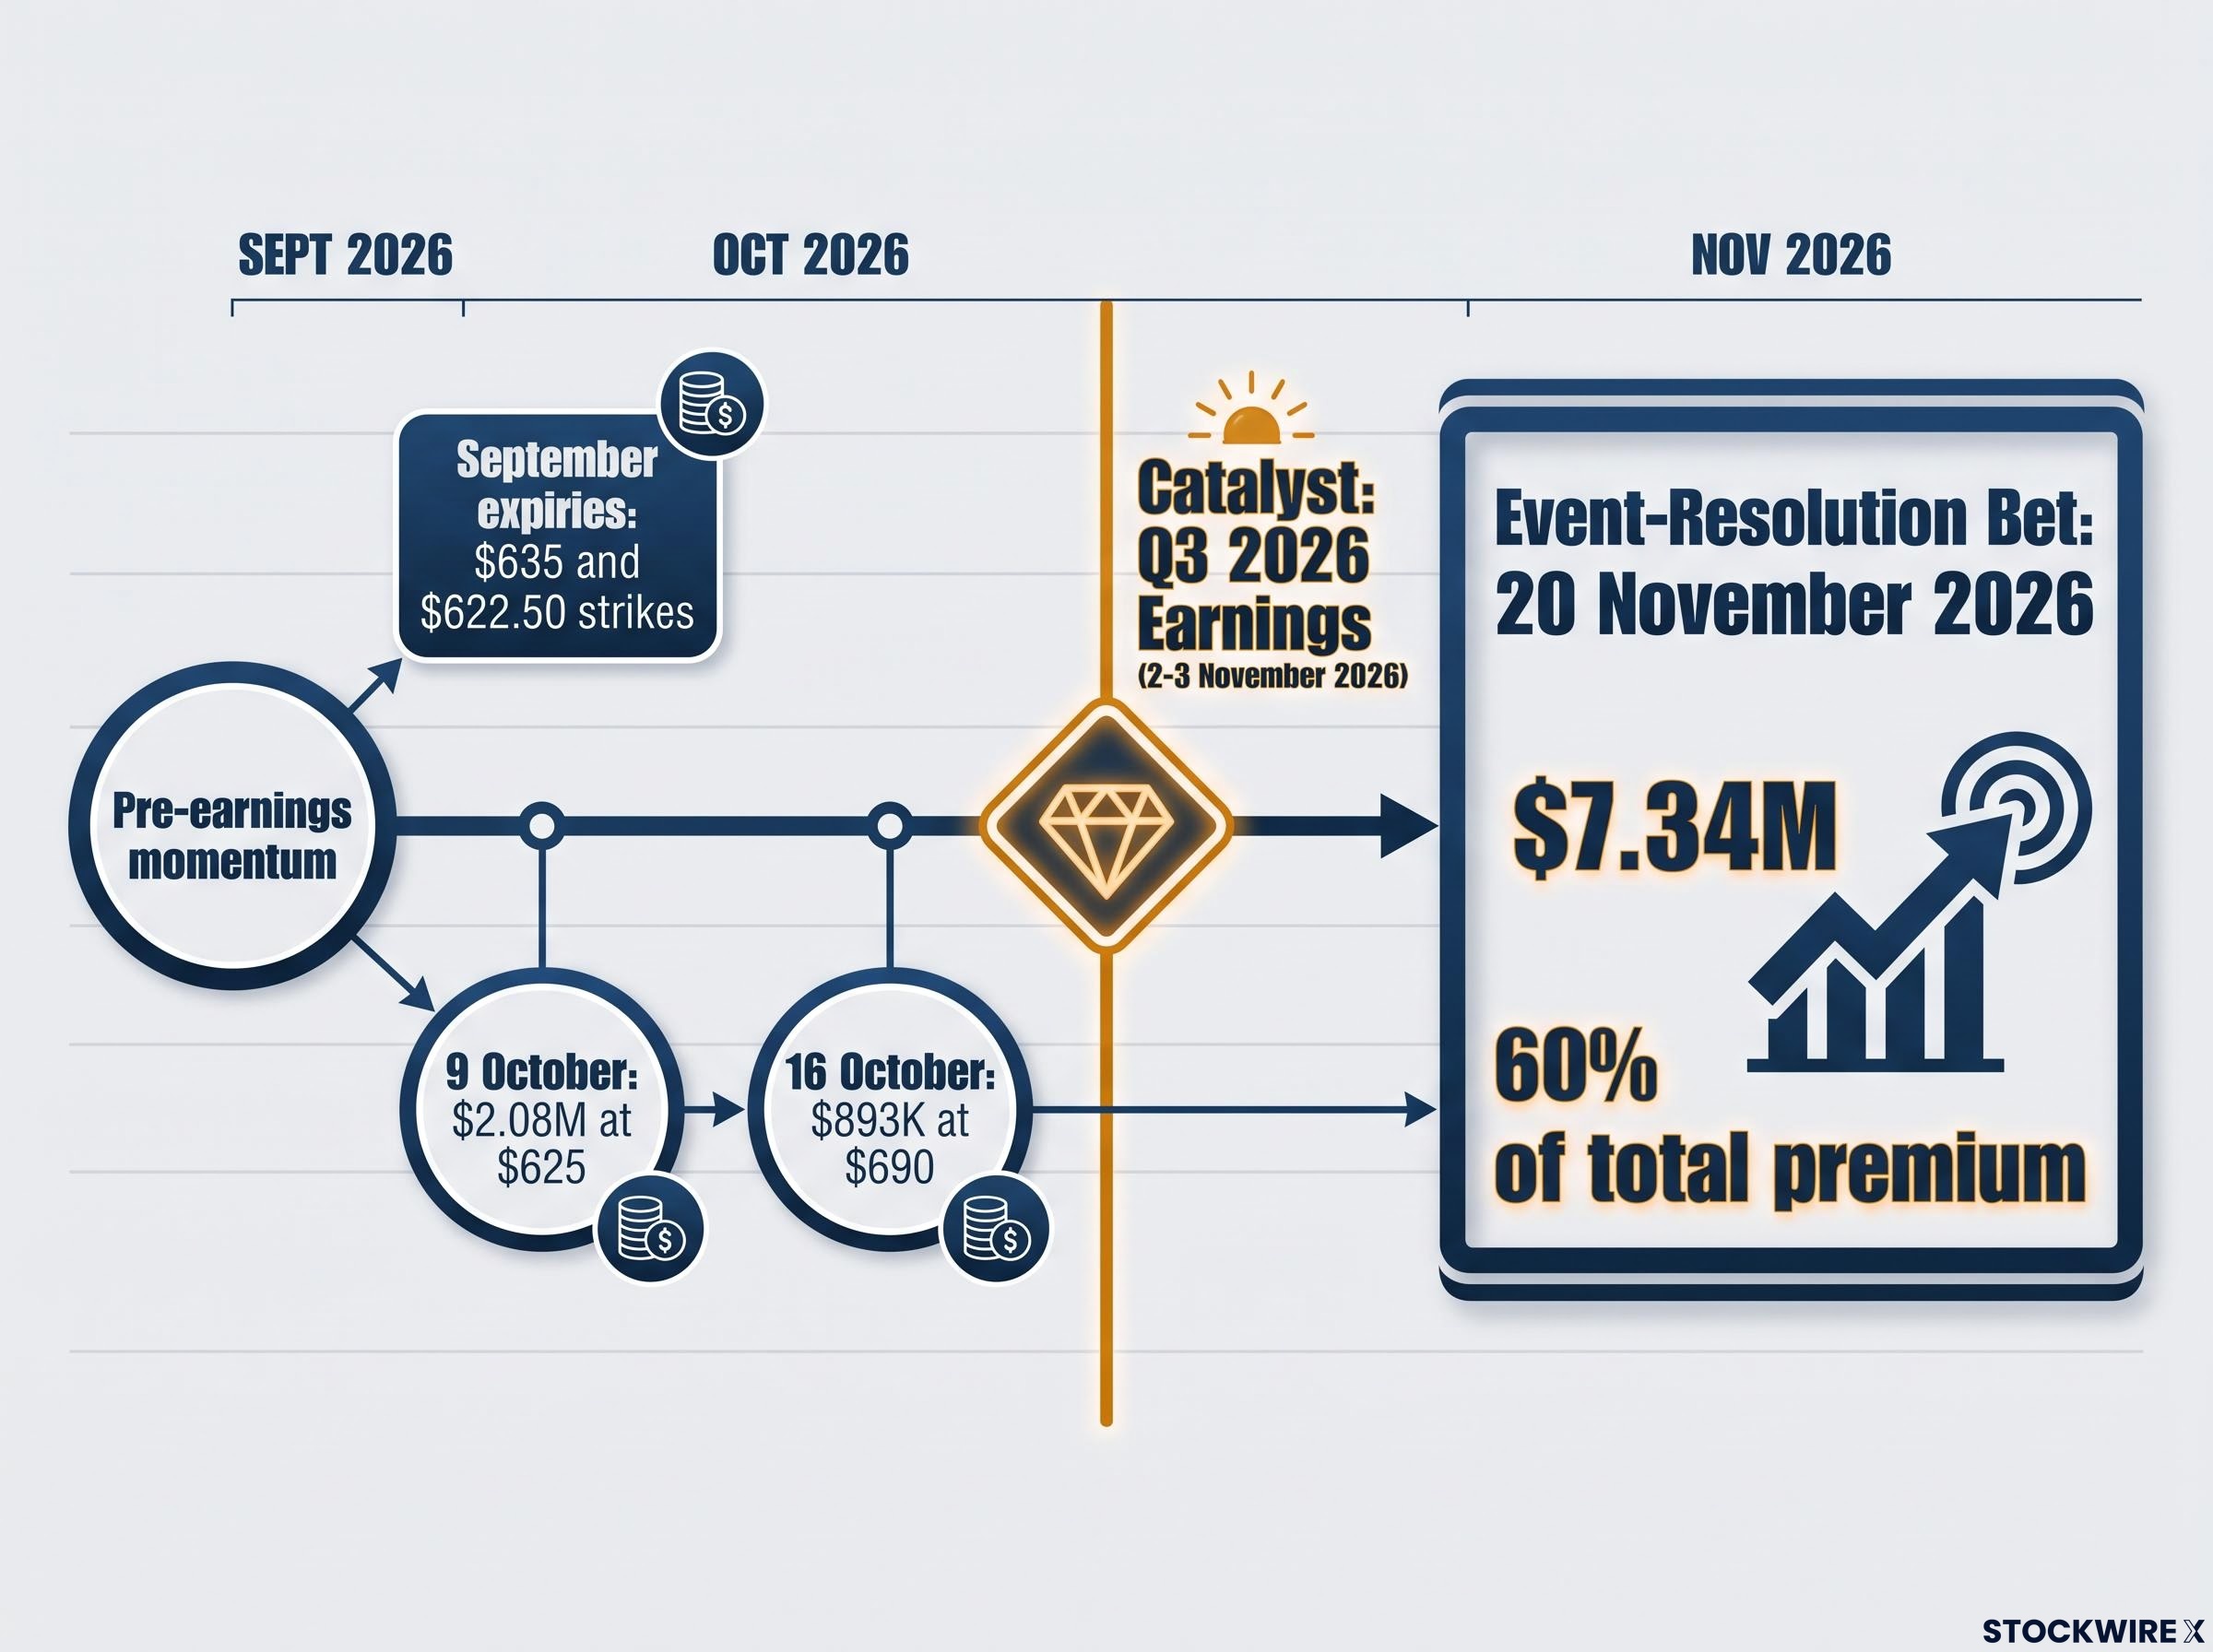
The September and October trades mature before earnings, so they express a view on price momentum, not on the announcement itself. The November concentration is a different animal entirely. When a trader parks the majority of their premium in the cycle that sits just after a known catalyst, they are not trading momentum. They are positioning for the binary event, and that distinction should change how you weigh the risk of following them.
The earnings volatility dynamic and what it means for premium buyers
There is a catch built into earnings-timed options that a lot of buyers learn the hard way. Options priced ahead of an earnings release carry an inflated volatility premium, because the market knows a big move might be coming and prices that uncertainty in.
Once the announcement is out, that uncertainty disappears and implied volatility collapses. This is called volatility crush: the sharp drop in an option’s value that follows a scheduled event, driven by falling volatility rather than the stock’s actual move. The practical consequence is uncomfortable. A buyer can call the direction correctly and still lose money if the move is smaller than the volatility the option had priced in.
Reading probability, premium size, and what “conviction” actually signals
Pull the threads together and a conviction signal starts to form from probability, premium size, and clustering acting in concert. The size of the premium relative to a strike’s normal daily volume is one of the clearest tells that you are watching an institution rather than retail traders. Retail participants almost never sink seven figures into a single expiration cycle.
The AMD cohort checks the boxes that McMillan’s framework and the Options Industry Council associate with genuine directional conviction:
- Net-long premium: the trades were buying calls, not selling them.
- Laddered out-of-the-money strikes: positions stacked upward from $625 to $830.
- Clustered execution: seven trades across four trading sessions, not one isolated block.
- No offsetting flow: no apparent bearish activity reported to counterbalance the bullish bets.
Those four hallmarks make a repeatable checklist you can apply to any alert, not just this one.
Regulatory reality Under FINRA Rule 2360, broker-dealers must assess whether options trading is suitable for a customer before approving it, precisely because these instruments are leveraged and complex. SEC Office of Investor Education bulletins are blunter still: past patterns of unusual options activity do not guarantee future results, and an unusual activity alert is not an investment recommendation.
FINRA Rule 2360 establishes the full regulatory framework governing options trading at U.S. broker-dealers, covering account approvals, position limits, and the suitability assessments that firms must complete before allowing customers to trade leveraged instruments like the calls described throughout this piece.
Here is the counterweight you have to hold alongside the signal. Even textbook-clean institutional flow produces meaningful false positives. Institutional traders are wrong plenty of the time. Delta-hedged positions are invisible to flow scanners. Multi-leg structures are routinely misread as simple directional bets.
There is a divergent signal sitting right next to this bullish flow, too. Over the preceding three-month period, corporate insiders sold roughly $109 million in AMD shares. So the AMD flow carries the structural fingerprints of real institutional conviction, but the insider selling and the sheer complexity of institutional positioning mean that treating it as a trade recommendation, rather than an analytical data point, would misread what the evidence actually supports.
The risks of following institutional options flow, and what the AMD setup illustrates
Copying institutional options flow is harder than the alert makes it look, and the reasons are structural rather than a matter of caution. Start with information asymmetry. Institutions frequently delta-hedge long calls by shorting the underlying stock, which can leave their net position neutral or even bearish. The scanner sees only the long call leg. You could be mirroring the bullish half of a trade that is, in aggregate, nothing of the sort.
The delta-hedging invisibility problem the article identifies is one example of a broader limitation in scanner-based approaches: order flow analysis, which examines how institutions accumulate positions through iceberg orders, liquidity sweeps, and partial fills, surfaces institutional behaviour that neither charts nor flow alerts make visible.
Execution is the next problem. Institutions negotiate block pricing on their orders. A retail trader chasing the same strikes after an alert typically eats wider bid-ask spreads and worse fills, which structurally handicaps the copycat trade before the thesis even has a chance to play out.
Then there is the fundamental backdrop, which complicates the AMD picture considerably:
- Delta-hedging invisibility: the visible long call may be offset by a short stock position you cannot see.
- Execution disadvantage: worse fills and spreads erode returns for anyone following late.
- Volatility crush: if AMD’s earnings come in merely in-line rather than a strong beat, the collapse in implied volatility could hand losses to the November premium buyers even on a modestly positive result.
- False positives: pre-earnings flow, even from sophisticated actors, is a fallible signal.
The valuation context reinforces the caution. AMD trades at roughly 150 times current earnings, so a great deal of future growth is already priced in. Analyst consensus lands in the $565-$630 range for 12-month targets, but the dispersion is telling: lows run from $235 to $365 and highs reach $1,250. That spread signals genuine disagreement among professionals about where AMD is headed. Read alongside the $109 million in insider selling, the flow is best understood as evidence that at least one sophisticated actor has built a sizeable directional thesis around the November earnings event. It is not evidence the thesis is right.
A repeatable framework for evaluating any unusual options alert
The value of all this is the checklist you can carry to the next alert, whatever the ticker. Run through these questions in order:
- Is the flow net-long or net-short premium
- Where does the expiration sit relative to any known catalyst
- How far are the strikes from the current price, and what is the implied probability
- Is execution clustered across multiple sessions or a single isolated block
- Is there offsetting flow, or a known hedging context that changes the read
Treat this as a filter, not a trigger. It tells you whether an alert deserves deeper research, not whether to place a trade.
What the AMD trades tell you, and what they do not
Here is what the AMD flow supports. Seven trades, $12.34 million in total premium, 60% of it concentrated in the 20 November expiration bracketing a major earnings catalyst, laddered across net-long out-of-the-money strikes. That is the structural profile of a deliberate institutional thesis, not routine hedging and not noise.
Here is what it cannot tell you. Flow analysis cannot confirm whether that institution is net-long AMD once its hedges are counted. It cannot tell you whether the $109 million in insider selling reflects a contrary fundamental view. And it certainly cannot tell you whether the thesis will prove correct. The analyst dispersion, with targets ranging from $235 to $1,250, is a standing reminder that even professional fundamental analysts are deeply divided on where this stock goes. The analysis pointed to $625 as the near-term inflection point: a sustained hold above it was cited as the precondition for any move toward the $700 range.
The alert is the starting point of your analysis, not the conclusion.
For investors who want to apply the same expiration-timing and catalyst-bracketing framework to macro events rather than earnings, our dedicated guide to options flows around macro catalysts covers how dealer Vanna and Charm flows, skew divergence, and record expiration unwinds shape price action around Fed decisions.
The real product of this piece is the interpretive work you just did on AMD. The stock and the dollar figure were the vehicle. The skill, running strike, expiration, probability, premium size, and offsetting flow through a single framework, is what you carry to the next unusual options alert that appears in your feed. That shift, from treating alerts as tips to treating them as data points requiring structured interpretation, is what prevents the most common and costly mistake in options flow analysis.
This article is for informational purposes only and should not be considered financial advice. Investors should conduct their own research and consult with financial professionals before making investment decisions. Past performance does not guarantee future results, and options carry substantial risk, including the loss of the entire premium paid.