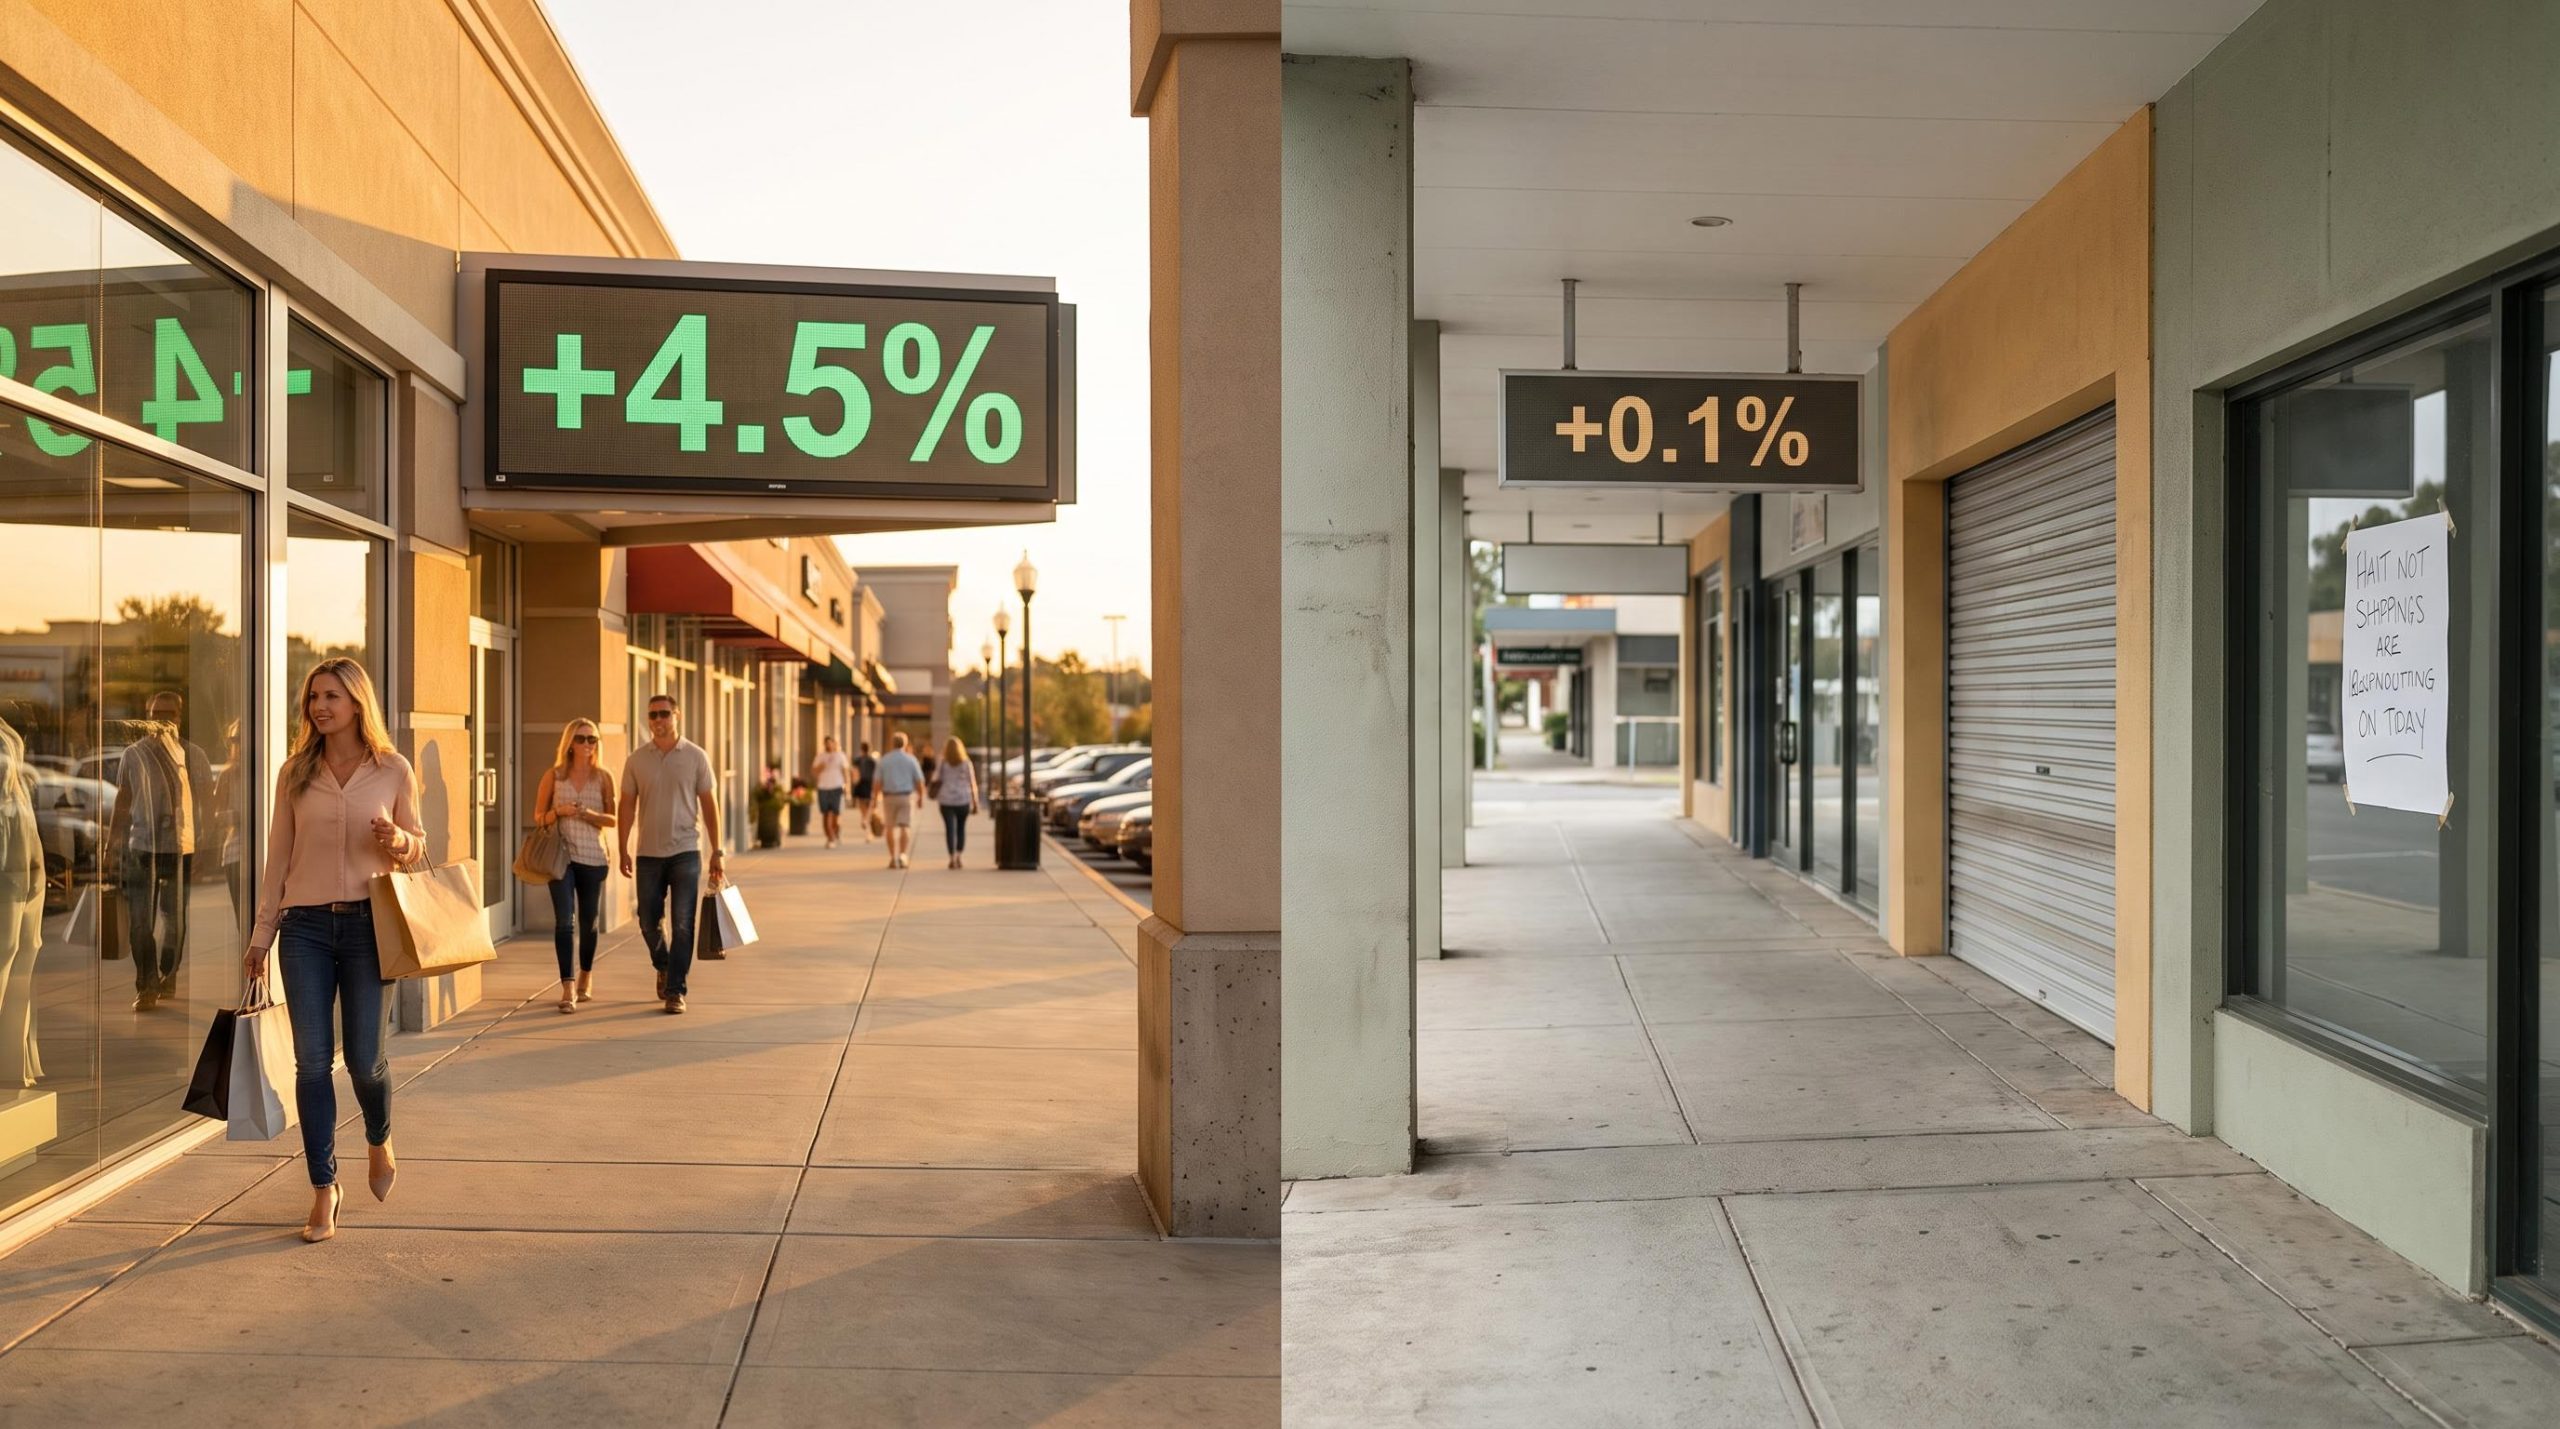
Two consumers, two central banks, two entirely different economic realities. In August 2026, American households pushed card spending up 4.5% year-over-year while their Australian counterparts barely moved the needle, lifting expenditure just 0.1% on the month. Same phase of the global rate cycle, opposite outcomes.
That gap punctures a comfortable assumption: that elevated interest rates slow developed economies in roughly the same way. They do not.
Consumer spending drives both economies and sits at the heart of every decision the Federal Reserve and the Reserve Bank of Australia (RBA) are making right now. When the two consumers split this sharply, the divergence stops being an academic curiosity and becomes a defining force in global equity performance.
This analysis lays out the framework for evaluating consumer-facing equities and rate-sensitive names in a market that has quietly split in two, showing you where the data justifies decoupling your US and Australian positioning entirely.
The August 2026 data shock: resilience versus contraction
Start with the raw numbers, because the scale of the split is difficult to grasp in the abstract.
Bank of America Institute’s Consumer Checkpoint data shows total household card spending in the US climbed 4.5% year-over-year in August 2026, with spending excluding gasoline up 3.7%, roughly 2.5 times the pace recorded in 2025. That figure follows an even stronger June, when annual growth hit 6.3%, the fastest in more than four years.
Across the Pacific, the picture inverts. High-frequency data from two of Australia’s major banks showed household spending rose just 0.1% month-over-month in August 2026, a sharp deceleration from July’s 0.6%. CommBank data confirmed essentials outpaced discretionary categories, and much of even that thin gain came from fuel costs rather than genuine appetite for spending.
Confidence tells the same story. ANZ-Roy Morgan Consumer Confidence hovered in the low 70s through September 2026, with one weekly reading near 72.0 and a four-week average around 73.2, weighed down by fuel prices, inflation, and the threat of further rate hikes.
| Metric | US Data (Aug 2026) | Australian Data (Aug 2026) |
|---|---|---|
| Card / household spending | +4.5% YoY (+0.9% MoM) | +0.1% MoM |
| Spending ex-fuel | +3.7% YoY | Flat to declining |
| Consumer sentiment | Value-seeking, healthy finances | Confidence in low 70s |
Bank of America’s own read on the month captures the qualitative shift underneath the headline number.
The Bank of America figures align with a broader pattern of US consumer resilience that has persisted across multiple data vintages in 2026, with retail sales posting five consecutive months of gains and real PCE expanding in four of the last five reporting periods, suggesting the August strength is not a one-month anomaly.
Bank of America Institute, August 2026 US spending remained robust through August, with households actively seeking value, income groups converging, and overall household finances staying healthy.
That last point matters. The K-shaped divide between higher and lower earners, a defining feature of recent years, has begun to narrow. The stark contrast in these two datasets tells you that global inflation pressure no longer produces uniform consumer behaviour, which means treating US and Australian retail exposure as a single bet is now a strategic error.
When big ASX news breaks, our subscribers know first
How mortgage market structures dictate consumer health
Why would the same interest rate environment produce acceleration in one economy and stagnation in another? The answer sits largely in how mortgages are structured.
Monetary policy transmission is the process by which a central bank’s rate decisions flow through to household budgets. The main channel is debt servicing: when rates rise, borrowing costs on household debt climb, leaving less cash for everything else. How fast that happens depends entirely on the type of mortgage a country’s homeowners hold.
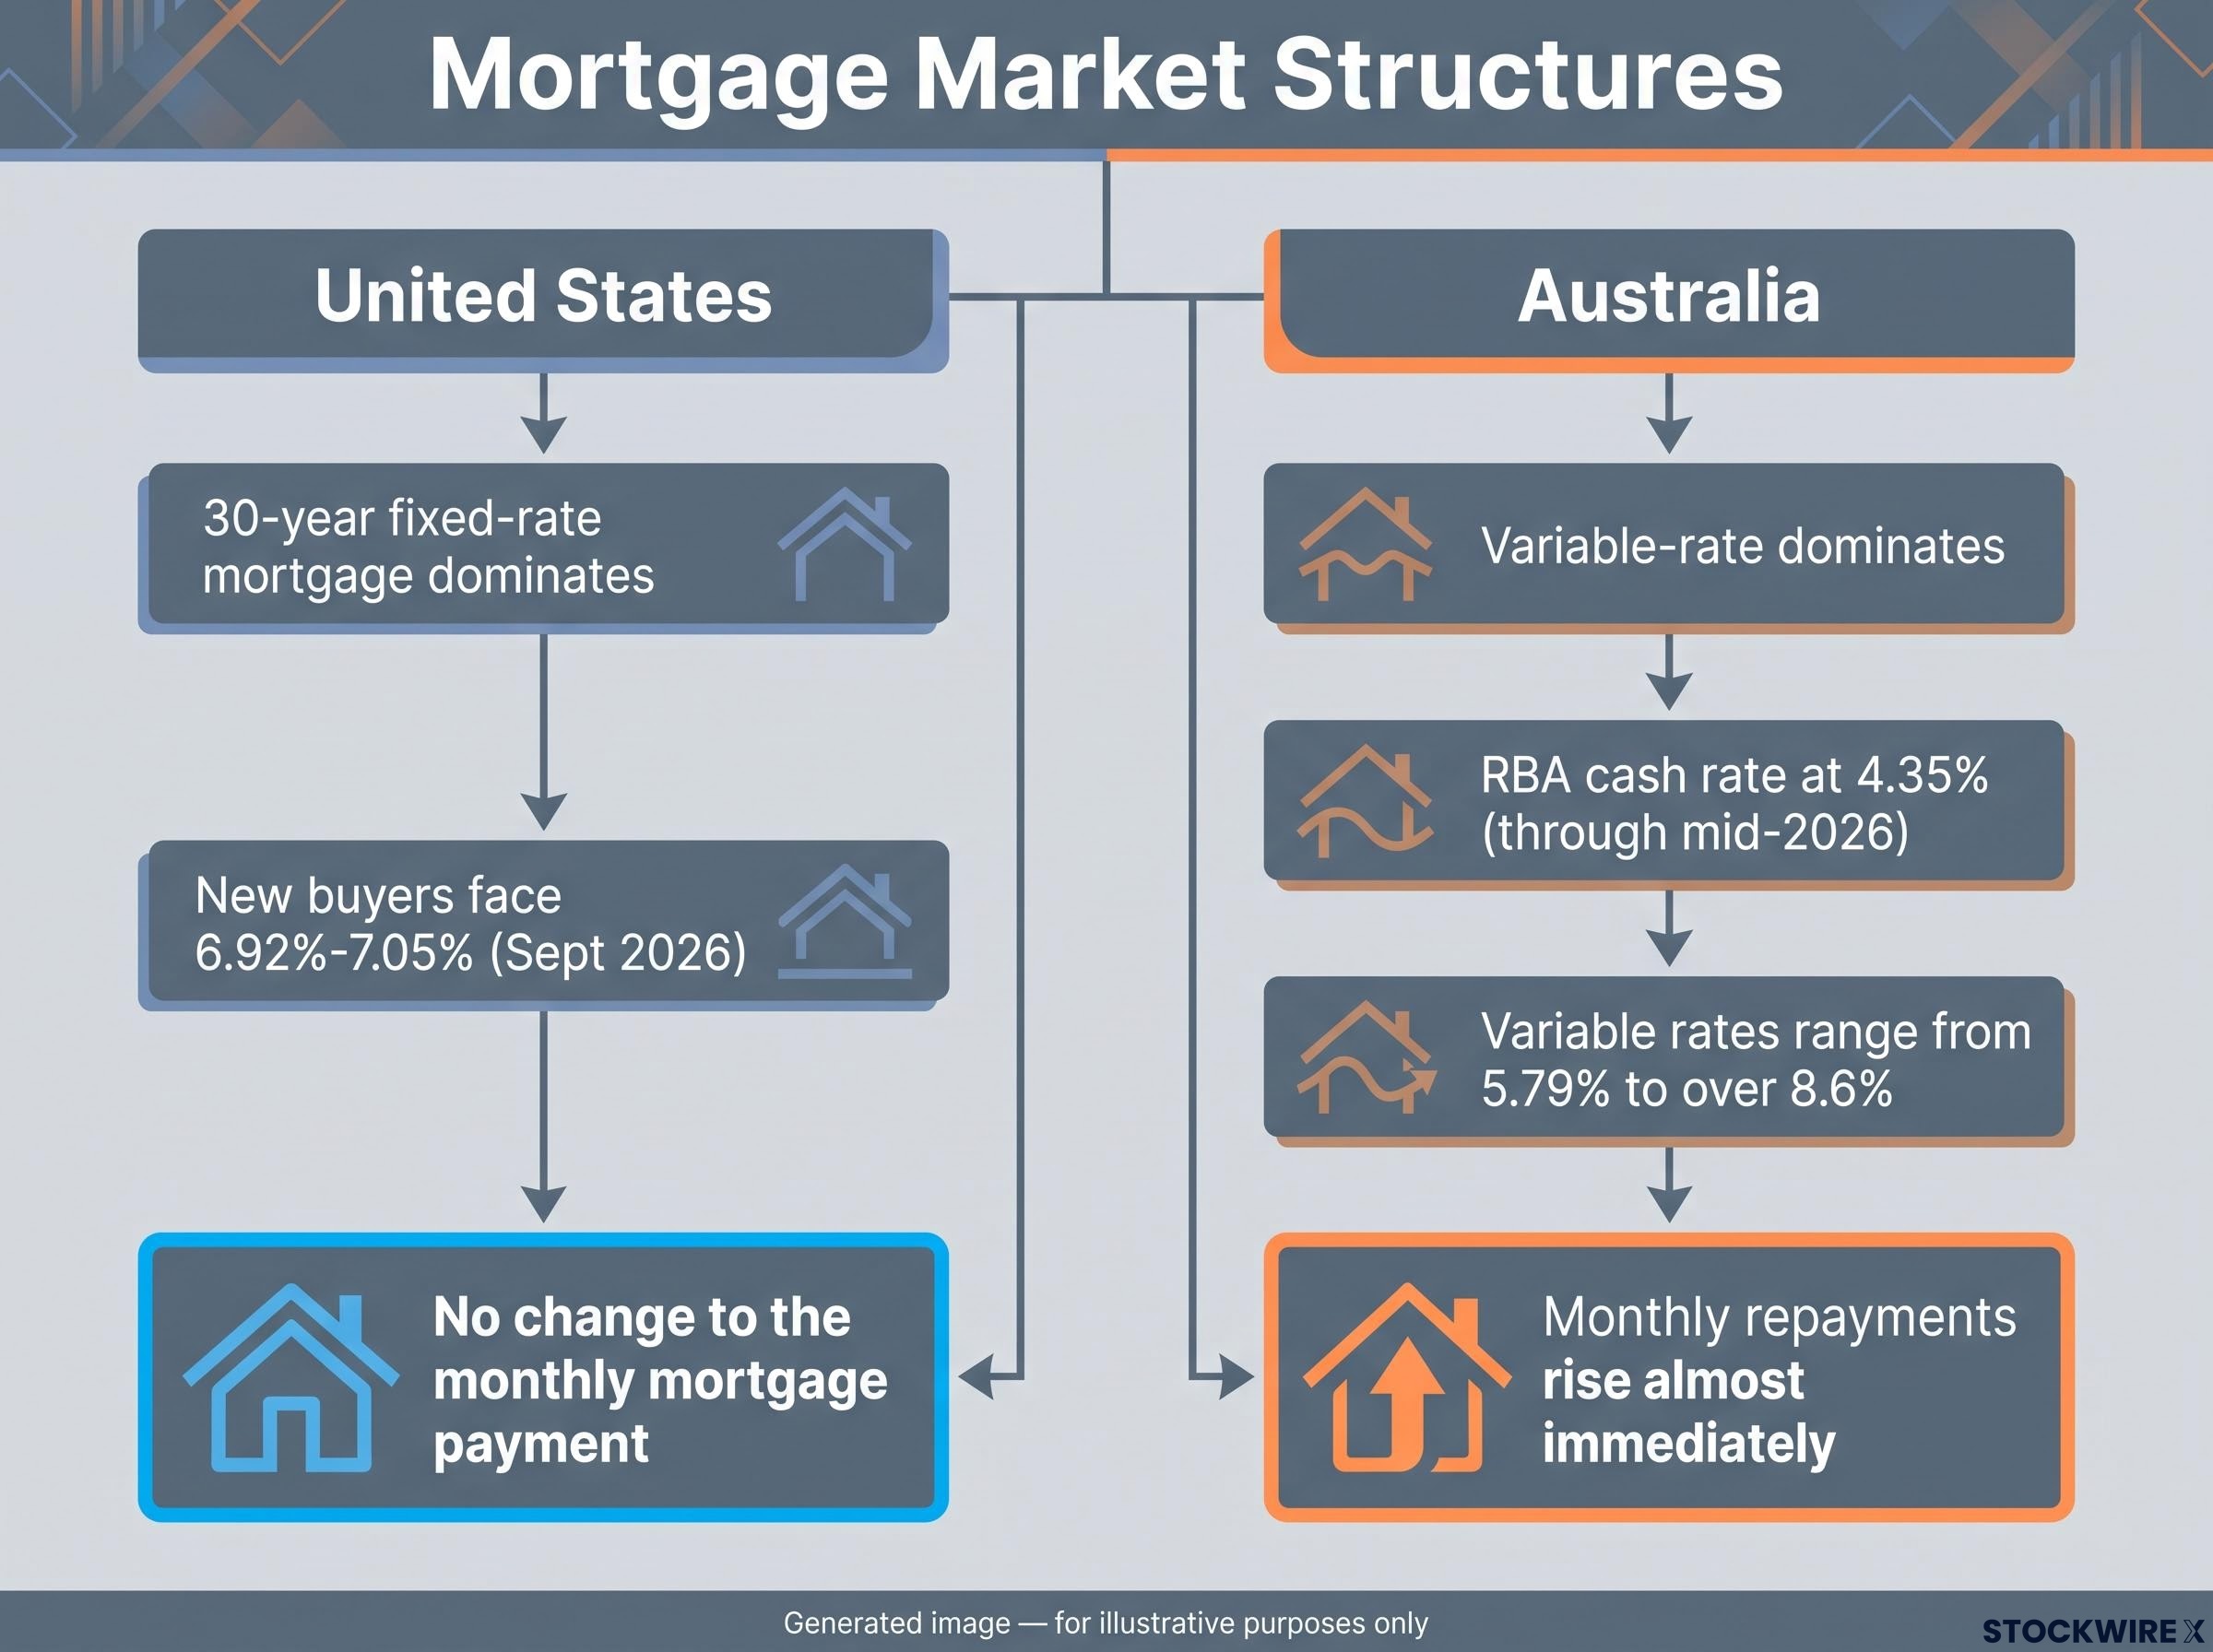
In the United States, the 30-year fixed-rate mortgage dominates. A homeowner who locked in a rate years ago keeps paying that rate regardless of what the Fed does today. New buyers face 6.92%-7.05% as of September 2026 (a rate that briefly touched around 7.3% earlier), but existing owners are insulated from that entirely.
Australia works the opposite way. Most mortgages are variable-rate, meaning the interest owed moves almost in lockstep with the RBA cash rate, held at 4.35% through mid-2026. When the central bank tightens, household cash flow feels it within a billing cycle or two. Australian variable rates currently range from around 5.79% on competitive products to over 8.6% on tailored bank offerings.
The practical impact of a single central bank hike splits cleanly along these lines:
- US fixed-rate household: No change to the monthly mortgage payment. Discretionary income stays intact, and spending capacity is preserved.
- Australian variable-rate household: Monthly repayments rise almost immediately. Discretionary income shrinks, and non-essential spending is the first thing cut.
That single structural difference explains why Australian discretionary income evaporates under tightening while American homeowner cash flows stay largely protected.
Structural insulation in the US market
The insulation runs deeper than the mechanism alone. During 2020 and 2021, a large share of US homeowners refinanced into historically low fixed rates, effectively locking in cheap money for a generation.
The Federal Reserve Monetary Policy Report documents that a majority of outstanding US mortgages still carry rates below 4%, confirming that most existing homeowners face no immediate transmission effect from Fed tightening, a structural buffer that has no equivalent in Australia’s variable-rate market.
Federal Reserve and IMF analyses of US household balance sheets across 2022-2024 point to lower debt-service ratios for many owners, rising home equity, and sizeable financial asset holdings. Those households simply do not feel the Federal Funds rate the way a variable-rate borrower does, which is why aggregate US discretionary spending has held up even as the policy rate sits elevated.
Compounding pressures: energy, taxes, and the cost of living
Housing structure is the biggest driver, but it is not the only one. The Australian slowdown is being entrenched by pressures that have nothing to do with the rate cycle at all.
Australian Treasury reports and RBA commentary have repeatedly flagged persistently high energy and insurance costs as structural drags on household budgets. These are not cyclical spikes that fade as inflation cools; they are ongoing fixed costs that sit on every household balance sheet month after month.
The structural drag from energy and insurance costs intensified sharply earlier in 2026, when a global oil shock drove fuel prices up 32.8% in a single month and electricity surged 25.4%, delivering a compound blow to household budgets that the cash rate alone could not offset.
Tax policy compounds the squeeze. Bracket creep, where wage rises push earners into higher tax brackets without any change in real purchasing power, quietly erodes disposable income. RBA and Treasury analysis identifies this alongside energy costs as a structural constraint on spending that persists independent of where the cash rate sits.
The read for investors is uncomfortable but important: the compounding effect of energy costs and bracket creep warns you that a single RBA rate cut will not instantly revive Australian consumer spending power. The drag is structural, not just monetary.
The limits of US resilience
American strength deserves the same scrutiny. The aggregate figures look healthy, but the resilience is uneven and conditional.
Fed and private-sector research across 2023-2024 flagged rising credit card and auto-loan delinquencies among lower-income cohorts, alongside the gradual exhaustion of pandemic-era excess savings. Ongoing fiscal support, including infrastructure spending, continues to prop up employment and wages, but that prop depends on the labour market staying strong.
In short, the US consumer premium rests on continued job creation. Strip that away and the same delinquency signals now confined to lower earners could spread, which is precisely the vulnerability to watch.
Equities and policy: positioning for the divergence
Macro theory only matters if it changes where capital goes. Here, the divergence maps directly onto sector performance in both markets.
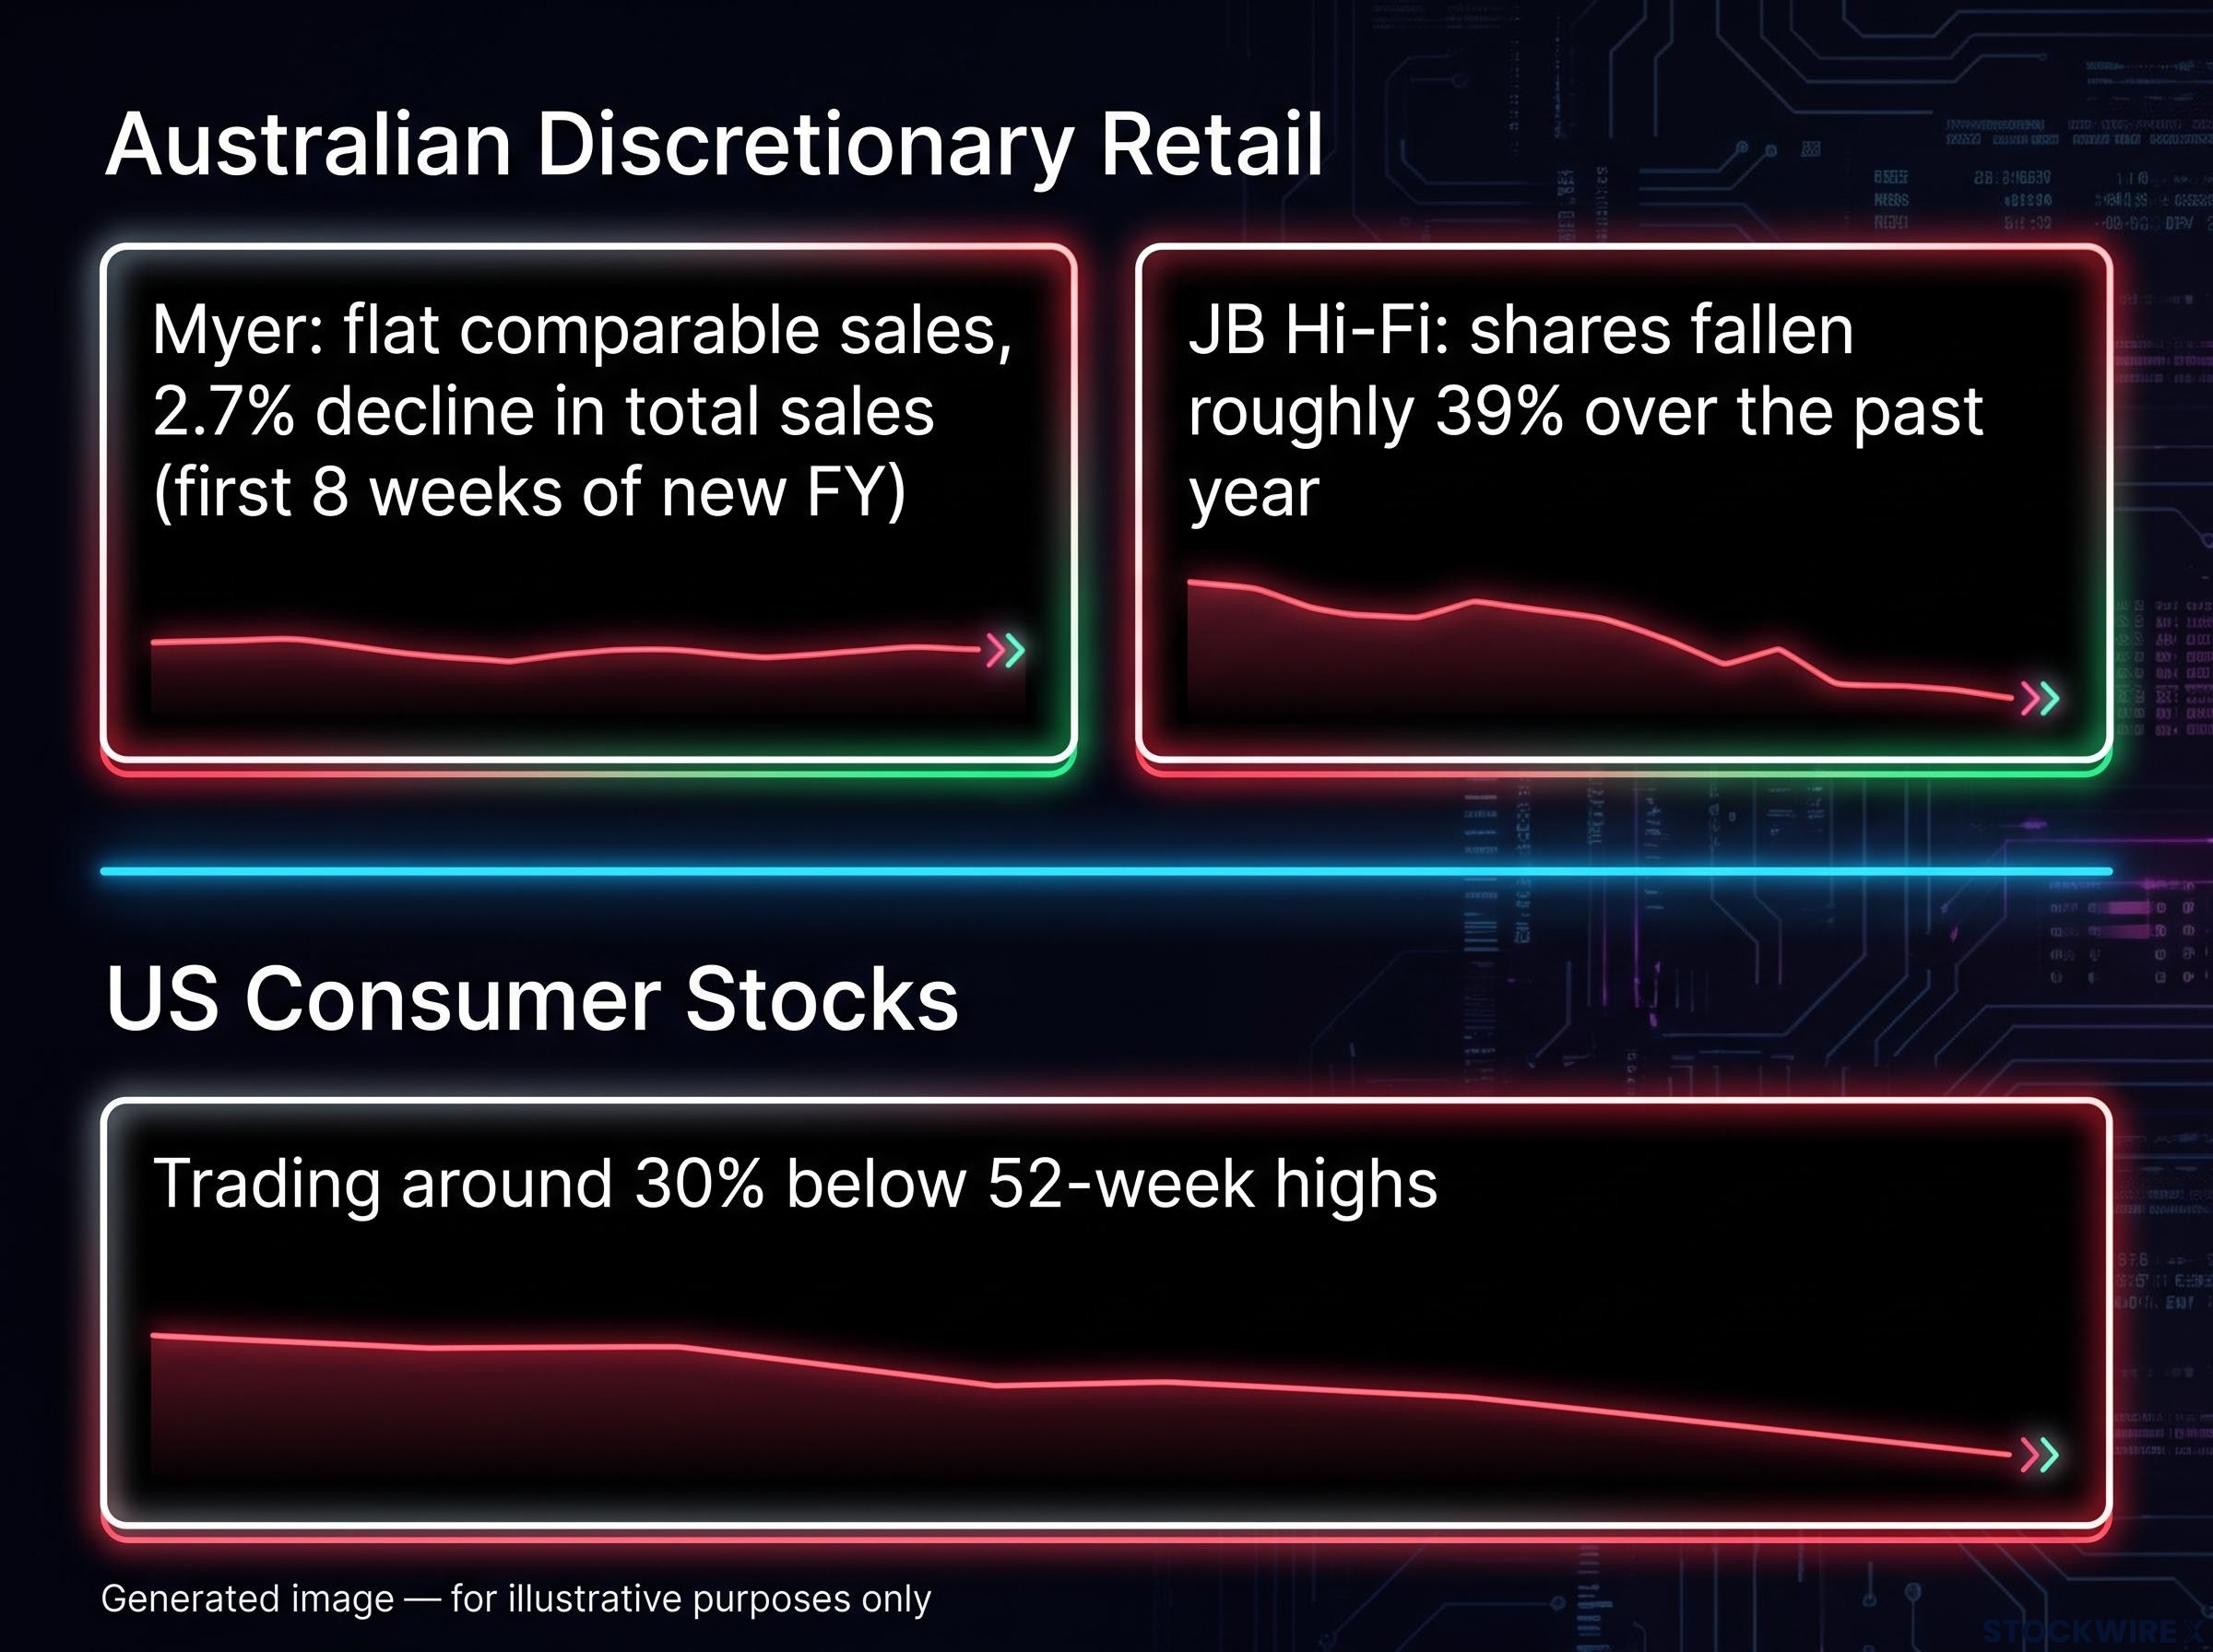
In Australia, the discretionary retail damage is already visible in prices. Myer reported flat comparable sales and a 2.7% decline in total sales over the first eight weeks of the new financial year, while JB Hi-Fi shares have fallen roughly 39% over the past year. These are the department stores and electronics retailers most exposed to household cash-flow stress, and the market has repriced them accordingly.
The US side offers the mirror image. Value-seeking behaviour is channelling spending toward discount general retailers, off-price apparel, and payment networks that benefit from higher nominal spending even when shoppers trade down to cheaper providers. With some US consumer stocks trading around 30% below their 52-week highs, the resilient backdrop is creating selective entry points rather than a blanket rally.
Consumer discretionary valuations in the US have compressed to historically pessimistic levels relative to the broader market, with the sector’s ratio to the S&P 500 near a 20-year low even as actual spending data show leisure, apparel, and membership categories all running above their January 2025 baseline.
That split points to three concrete portfolio adjustments:
- Underweight Australian discretionary and housing-linked names, particularly big-ticket and non-essential retailers exposed to variable-rate household stress.
- Tilt Australian exposure toward defensives: staples, utilities, healthcare, and selected infrastructure that hold up when discretionary income contracts.
- Overweight US value-seeking consumer plays, including discount retail, off-price apparel, and payment networks levered to sustained nominal spending.
The severity of the price destruction in Australian discretionary retail requires you to pivot defensive domestically, while the US market hands you selective openings in payment networks and discount retail rather than broad consumer beta.
These divergent consumer paths also shape rate expectations. Resilient US consumption strengthens the case for higher-for-longer US policy rates, while Australian softness bolsters the argument for an earlier or deeper RBA easing cycle. Those opposing rate views feed straight back into the sector tilts above.
This article is for informational purposes only and should not be considered financial advice. Investors should conduct their own research and consult with financial professionals before making investment decisions.
Historical precedents and the next macro pivot
None of this is unprecedented. Cross-country consumption gaps have opened before, and they follow a recognisable pattern.
The 2010-2013 divergence between a faster-recovering US and an austerity-bound Europe underpinned outperformance of US consumer equities and allowed the Fed to contemplate normalisation earlier than several European peers. The 2021-2022 reopening told a similar story, as large US fiscal transfers drove stronger consumption and ultimately steeper Fed tightening than other advanced economies.
The lesson from both episodes is that these gaps eventually close, and often abruptly, once tightening fully transmits to the labour market or a global shock hits. Resilience today guarantees nothing about tomorrow.
Because these divergences tend to snap shut rather than fade gently, US labour market data becomes your primary tripwire. A softening jobs picture is the first signal that the American consumer premium is set to erode.
The Fed-RBA split is one instance of a broader central bank divergence that has fractured developed-market monetary policy into irreconcilable paths in 2026, with the Fed paused at 3.50-3.75%, the ECB still tightening, and the BOJ accelerating its own normalisation at a pace that markets had not priced.
Domestically, watch the upcoming Australian employment data and the RBA Governor’s September 2026 inflation commentary, which flagged upside risks still materialising. Those are the signals that will tell you when this two-track market finally begins to converge.
Past performance does not guarantee future results. Financial projections are subject to market conditions and various risk factors. These statements are speculative and subject to change based on market developments and economic conditions.