Most people file gold under mysticism. It is the shiny thing you buy when the world feels dangerous, the barbarous relic your grandparents trusted more than banks. That instinct is wrong, and it costs you money.
Gold is not magic. It is one of the most brutally efficient barometers we have for measuring global confidence in paper money, and it responds to a small set of hard mechanical inputs you can actually track.
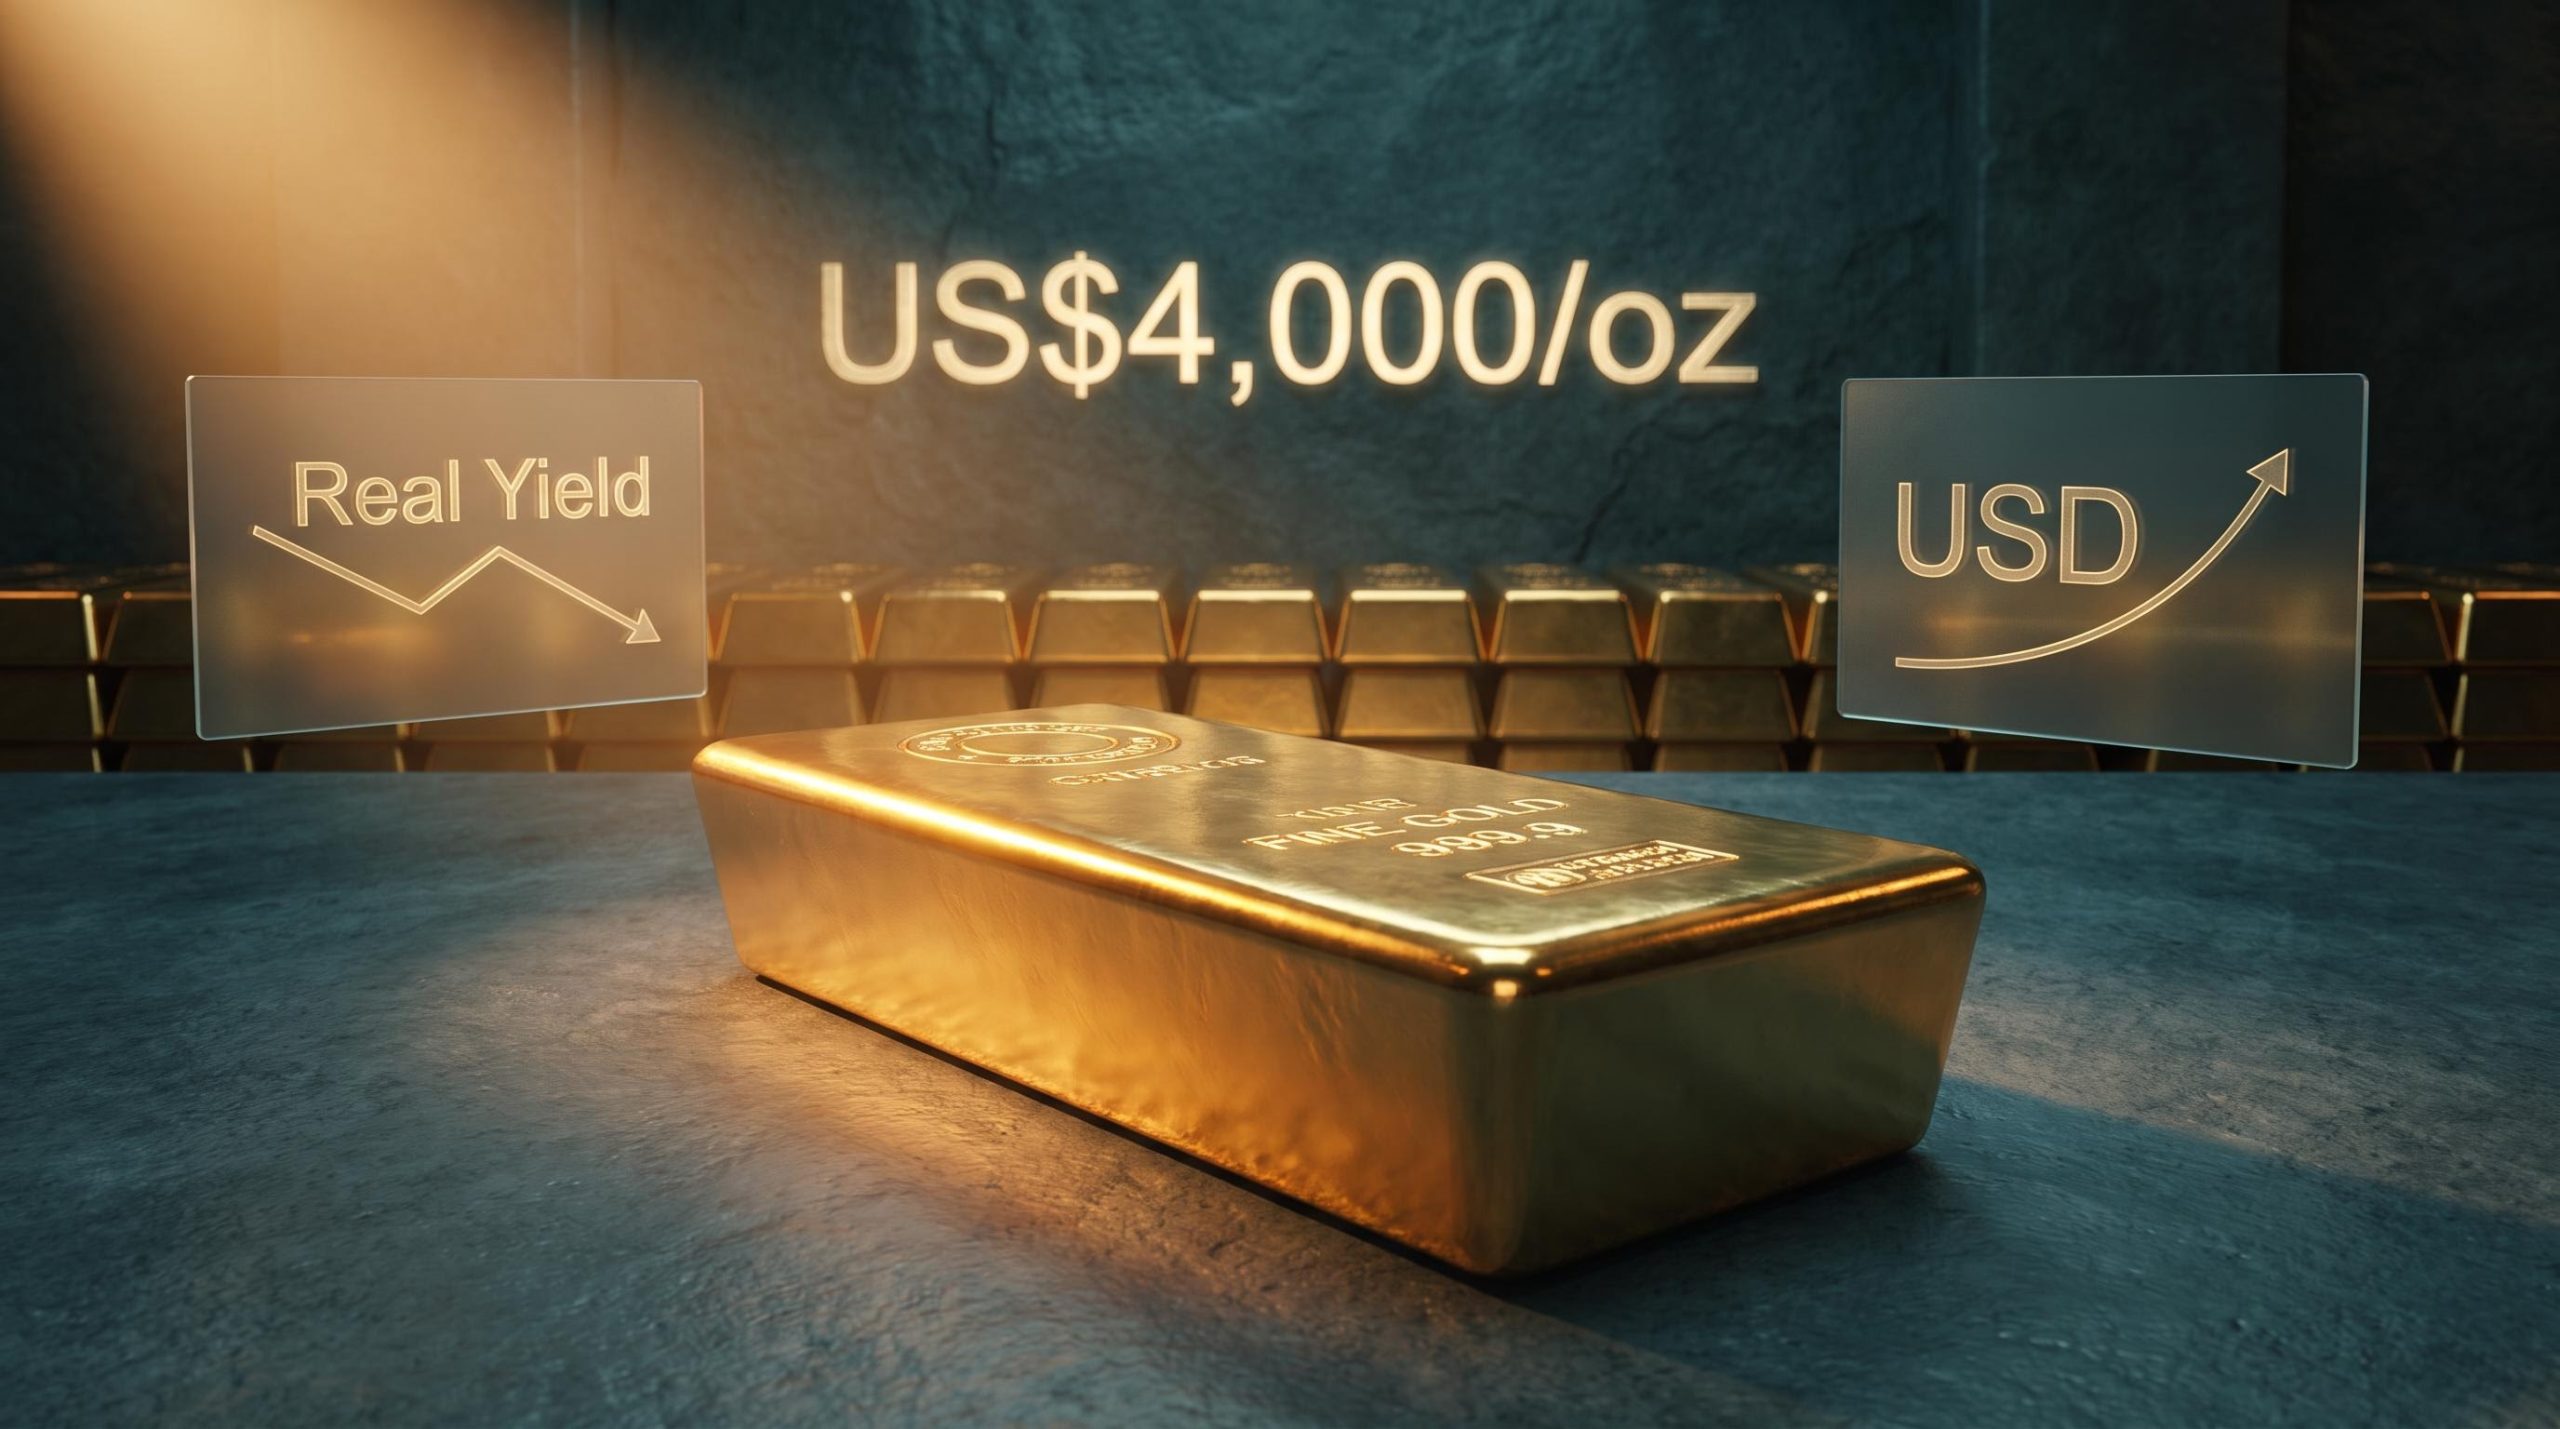
The proof arrived in 2025, when the metal tore past US$4,000/oz for the first time in history and closed the year up roughly 65%. That was not a spiritual event. It was a signal, and most retail investors could not read it.
Understanding what drives gold prices means understanding three levers: real interest rates, the strength of the US Dollar, and the quiet, relentless buying of central banks. Get those, and the daily price noise starts resolving into something legible.
Here is the mechanical framework for why the metal behaves the way it does, so you can filter the panic-selling headlines from the macroeconomic signals that actually move your portfolio.
The foundational tug-of-war with the US Dollar
Strip away the mystique and gold is, at its core, a competitor to the US Dollar. The two are locked in a near-permanent inverse relationship, and that single dynamic explains more daily price action than any headline about fear or uncertainty.
The mechanics are straightforward. Gold is priced in dollars globally, so when the dollar weakens, the same ounce becomes cheaper for buyers holding euros, yen, or rupees. Cheaper metal attracts more demand, and prices rise.
The reverse holds just as firmly. A strengthening dollar makes gold more expensive everywhere outside the United States, and demand cools.
This is why the metal functions as a currency depreciation buffer. When confidence in fiat currency erodes, capital flows toward an asset that no government can print, and gold serves simultaneously as a store of value and a hedge against that erosion.
Gold also tends to move against risk assets. When equity markets sell off and investors flee stocks, the metal frequently rises, acting as a structural buffer inside a diversified portfolio. When shares rally, gold often drifts lower as capital chases higher returns elsewhere.
Here are the main asset classes that typically carry an inverse relationship with the metal, and why:
- US Dollar: A stronger dollar raises gold’s price for foreign buyers and suppresses demand. A weaker dollar does the opposite.
- US Treasury securities: As competing safe-haven and reserve assets, Treasuries draw capital away from gold when their appeal rises, particularly when they pay attractive yields.
- Equities: When stock markets climb, investors chase growth. When they fall, gold often catches the capital seeking shelter.
Understanding this inverse correlation changes how you read the market. Gold is not an isolated bet on doom. It is a direct reflection of global confidence in paper money, and once you see it that way, you can anticipate moves rather than react to them.
This is the baseline every trader watches on their screen. Before you factor in anything more complex, the dollar and the metal are pulling against each other in real time, and that tension sets the daily tone.
When big ASX news breaks, our subscribers know first
Deconstructing the real yield mechanism
Here is the piece that trips up most retail investors: gold pays you nothing. No dividend, no interest, no coupon. So why would anyone hold it when a government bond pays a guaranteed return?
The answer lives in a concept called the real interest rate, and once you grasp it, the rest of gold’s behaviour clicks into place.
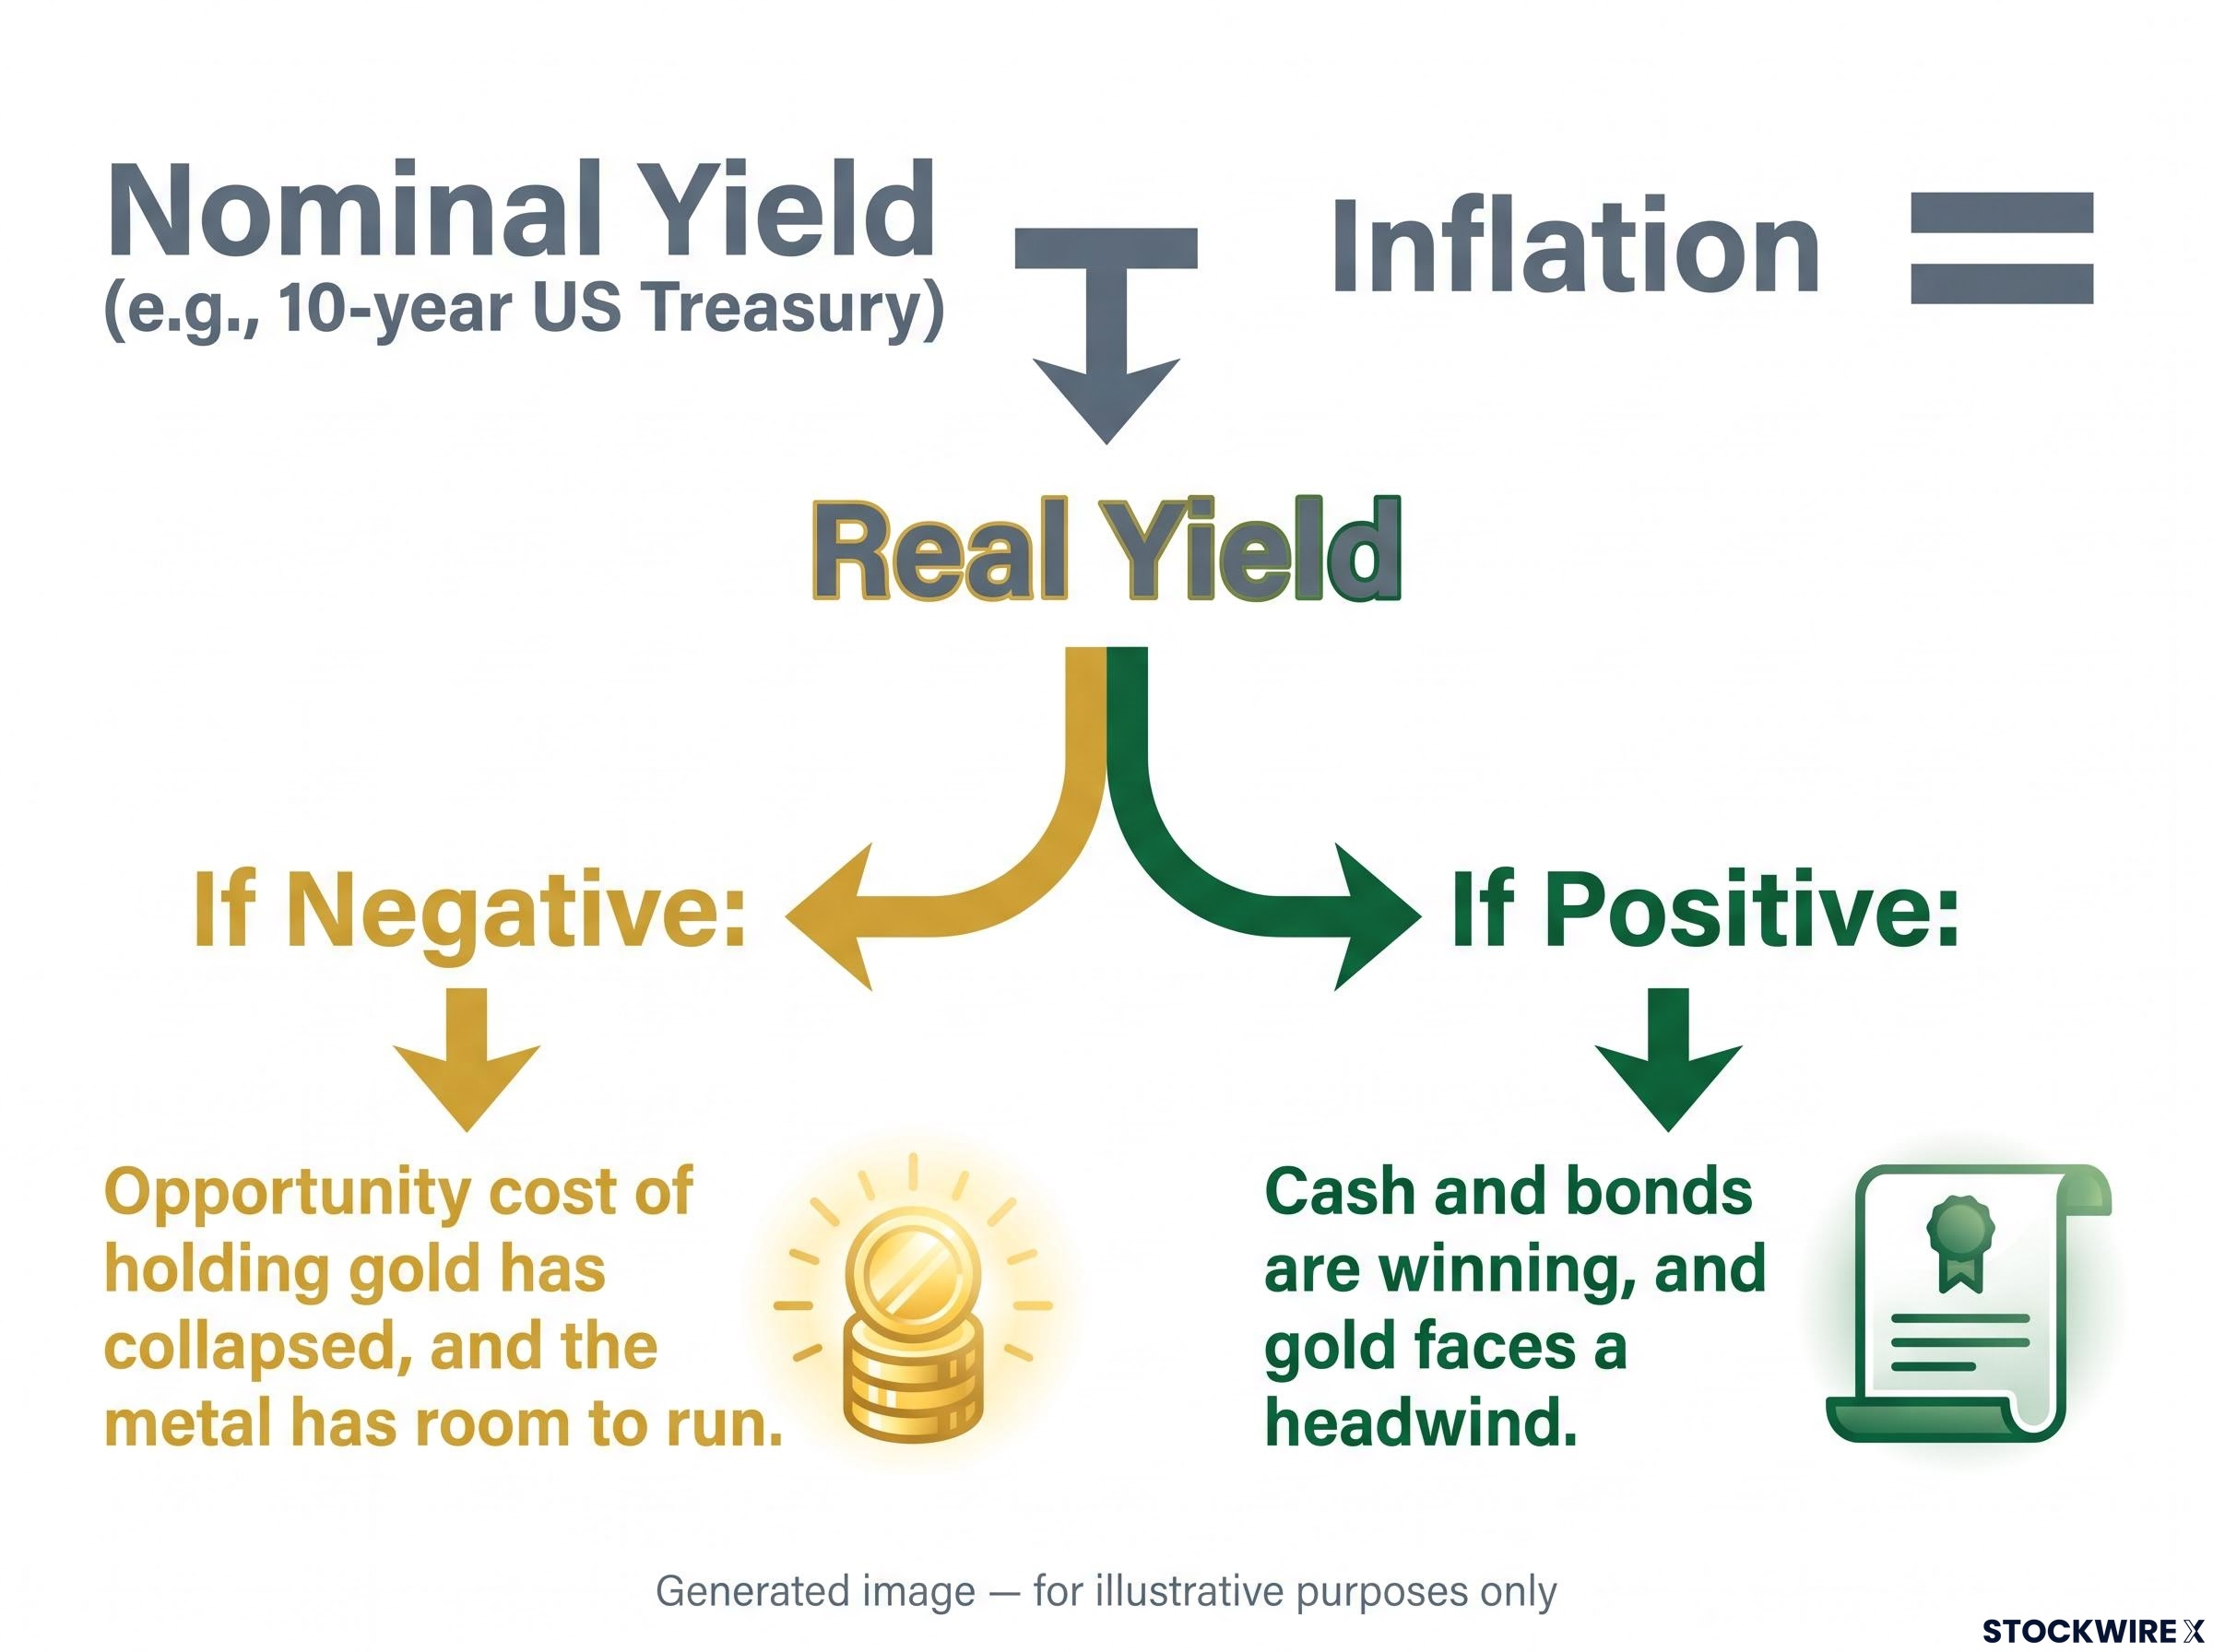
Start with the difference between two numbers. The nominal interest rate is the headline figure, the actual percentage a bond pays you. The real interest rate is that number after you subtract inflation. It tells you what your money is genuinely earning in purchasing power.
That distinction is everything. If a bond pays 5% but inflation is running at 6%, your real return is negative. You are technically losing purchasing power by holding cash and bonds, even though the headline number looks positive.
This is where gold’s zero yield stops being a weakness. When real rates are high, holding a non-yielding asset carries a heavy opportunity cost, because you are giving up a genuine real return elsewhere. When real rates fall or turn negative, that opportunity cost vanishes, and suddenly a metal that pays nothing looks competitive against a bond that also, in real terms, pays nothing.
Analyst consensus is consistent on this point: expectations of lower real rates or slower monetary tightening reduce the opportunity cost of holding gold and support higher prices. The reverse, a surprise toward hawkish policy, tends to lift real yields and pressure the metal.
The real yield mechanics behind gold’s 2022-2023 behaviour are the clearest proof of this principle: surging inflation kept real yields negative even as nominal rates climbed aggressively through the fastest hiking cycle in four decades, which is precisely why gold held its ground rather than collapsing as the standard ‘rates up, gold down’ model predicted.
History makes the mechanism vivid. During the late 1970s and into early 1980, inflation soared, and gold surged despite rising nominal rates, because the inflation component overwhelmed the interest paid on bonds until real yields were forcefully pushed higher. By contrast, much of the disinflationary 1990s saw high real yields and a strong dollar, and gold languished.
You can calculate the real yield yourself. It is not complicated:
- Find the nominal yield on a government bond, for example a 10-year US Treasury.
- Find the current inflation rate or the market’s inflation expectations for that same period.
- Subtract inflation from the nominal yield.
- If the result is positive, cash and bonds are winning, and gold faces a headwind. If it is negative, the opportunity cost of holding gold has collapsed, and the metal has room to run.
Once you understand that real yields, not nominal ones, drive the opportunity cost of your investments, you stop making the most common retail error. You will know exactly why aggressive central bank rate hikes do not automatically crash gold, provided inflation stays elevated enough to keep real returns suppressed.
That single insight prevents you from dumping your physical hedge the moment the Federal Reserve announces a rate rise, which is precisely when the herd tends to get it wrong.
The central bank super-cycle and reserve diversification
Everything so far operates at the level of your trading account. Now change the scale, because the biggest buyers in this market are not retail investors or hedge funds. They are nation-states, and they have been accumulating gold at a pace not seen in modern history.
Central banks are the largest institutional holders of gold on earth, and since 2022 they have been buying with unusual intensity. This is not routine reserve management. According to WisdomTree’s April 2025 analysis, three consecutive years of buying above 1,000 tonnes is “not normal” and points to a deliberate strategic shift.
The numbers confirm the break from the past. Between 2010 and 2021, central banks bought an average of just 473 tonnes a year. The recent figures dwarf that.
| Year | Net central bank purchases | Key sovereign buyers | Market context |
|---|---|---|---|
| 2022 | ~1,082 tonnes | Broad emerging-market buying | Modern record, well above the decade average |
| 2023 | ~1,050.8 tonnes | China, Turkey, others | Second-highest year on record |
| 2024 | ~1,044.6 tonnes | Poland, Turkey, India, China | Third straight year above 1,000 tonnes |
The 2024 buyers span the map. Poland added nearly 90 tonnes. India’s Reserve Bank purchased roughly 72.6 tonnes by November, making it the third-largest buyer of the year, according to a Punjab National Bank research note. China’s central bank reported buying across multiple months, and Turkey ranked among the heaviest accumulators. In November 2024 alone, central banks globally added a net 53.5 tonnes.
Why the sudden urgency? The consistent thread across institutional analysis is diversification away from the US Dollar. Emerging-market central banks are deliberately reducing their exposure to dollar assets to insulate themselves from geopolitical risk, currency risk, and the possibility of financial sanctions.
The reserve diversification logic behind sovereign buying runs deeper than a simple flight from dollars: central banks are eliminating counterparty risk from foreign governments’ political decisions, insulating reserves against the kind of sanctions exposure that crystallised in 2022, and signalling reserve quality to bond markets simultaneously.
WisdomTree put it bluntly, describing Poland’s and China’s moves as “not cosmetic, they’re statements.” Physical gold held domestically is far harder to freeze or restrict than reserves parked in another country’s financial system.
This reframes the entire 2025 price story. That run was not a retail speculative bubble inflating on hype. It was the visible surface of a much deeper structural current: a shift toward a multipolar monetary order where gold plays a larger stabilising role.
And the velocity of that run was extraordinary.
According to the World Gold Council, gold hit US$4,000/oz on 8 October 2025, its 45th new all-time high of the year. The move from US$3,500 to US$4,000 took just 36 days.
When emerging-market central banks keep buying physical metal at record prices, it tells you something specific. The most sophisticated institutional players on the planet are actively hedging against the weaponisation of the dollar system. For you, that is a prompt to evaluate your own geographic and currency risk exposure rather than assuming the dollar-centric world of the past decade will simply continue.
It also gives you a reason to hold through volatility. When sovereign nations are providing a structural floor beneath the market, short-term dips look less like reasons to panic and more like noise against a much larger trend.
The reality of safe-haven behaviour and structural risks
None of this makes gold a flawless shield, and treating it as one is how investors get hurt at the top.
The first uncomfortable truth is that gold is not a perfect or timely inflation hedge. After the early-1980 peak, real gold prices trended lower for years even as inflation flared at times. Entry point and policy regime matter enormously, and buying at the wrong moment can mean waiting a very long time to break even.
Currency effects complicate the picture further. A strong US Dollar can actively offset gold’s inflation-hedge appeal for non-US investors, because their returns are partly driven by foreign exchange translation. Dollar strength and high real yields have historically coincided with gold underperformance, even during periods of genuine macro uncertainty.
There is also the question of valuation. With spot prices hovering around US$4,300/oz in late 2026, some analysts warn that speculative momentum may be amplifying moves beyond what the fundamentals alone justify. The World Gold Council framed its own October 2025 note as “trend or turning point?”, an implicit acknowledgement that a sharp reversal in rates, the dollar, or positioning could leave gold exposed after such a rapid climb.
The speculative washout dynamics of H1 2026 illustrated this mechanism directly: gold shed more than US$1,500/oz from its January peak as institutional momentum money exited, even as central banks continued accumulating, confirming that the structural bid and the speculative layer can diverge sharply over short windows.
The dash for cash and liquidity traps
The most counterintuitive risk is that gold can fall precisely when you expect it to protect you. During acute financial crises, investors are sometimes forced to sell their most liquid, most profitable positions to raise cash, and gold, sitting on large gains, becomes an obvious source of that liquidity.
This is the dash-for-cash phenomenon. When markets seize up, margin calls arrive across an investor’s entire book, and covering those calls elsewhere means liquidating winners. Gold gets sold not because its thesis broke, but because it is the easiest thing to turn into cash.
Research examining dash-for-cash dynamics in gold markets shows that the pattern recurs across major liquidity events, with the 2008 financial crisis and the March 2020 COVID-19 crash both producing sharp, brief gold selloffs that reversed once immediate margin pressure eased.
Knowing this prevents a costly mistake. When your supposed safe haven temporarily drops alongside your equities during a liquidity panic, you will understand it is mechanics, not a failure of the underlying case, and you will be far less likely to panic-sell at the worst possible moment.
The lesson is defensive realism. Size your gold allocation based on how the market actually behaves, not on the utopian, always-up-when-you-need-it version sold in marketing material.
Building your framework for a multipolar monetary order
You now have the three forces that genuinely move this market: real interest rates that set the opportunity cost of holding a zero-yield asset, US Dollar strength that governs the daily tug-of-war, and sovereign reserve accumulation that provides a structural floor beneath prices.
Hold those three together and the noise falls away. The de-dollarisation trend playing out across emerging-market central banks is a multi-year structural shift, not a trade to be timed by the day. It rewards a longer-term mindset over a screen-watching one.
Going forward, keep your attention on two data streams above all others. Watch inflation readings against nominal bond yields to gauge where real rates are heading, and watch central bank purchase announcements from the World Gold Council for confirmation that the institutional floor is holding. Those two signals will tell you more about your gold allocation than any price alert.
For readers wanting to extend this framework into a multi-year portfolio thesis, our full explainer on the sovereign debt case for gold examines how rising US, UK, and eurozone debt loads are eroding the safe-haven diversification value of government bonds and what that means for long-run gold allocation sizing.
This article is for informational purposes only and should not be considered financial advice. Investors should conduct their own research and consult with financial professionals before making investment decisions. Past performance does not guarantee future results, and financial projections are subject to market conditions and various risk factors.