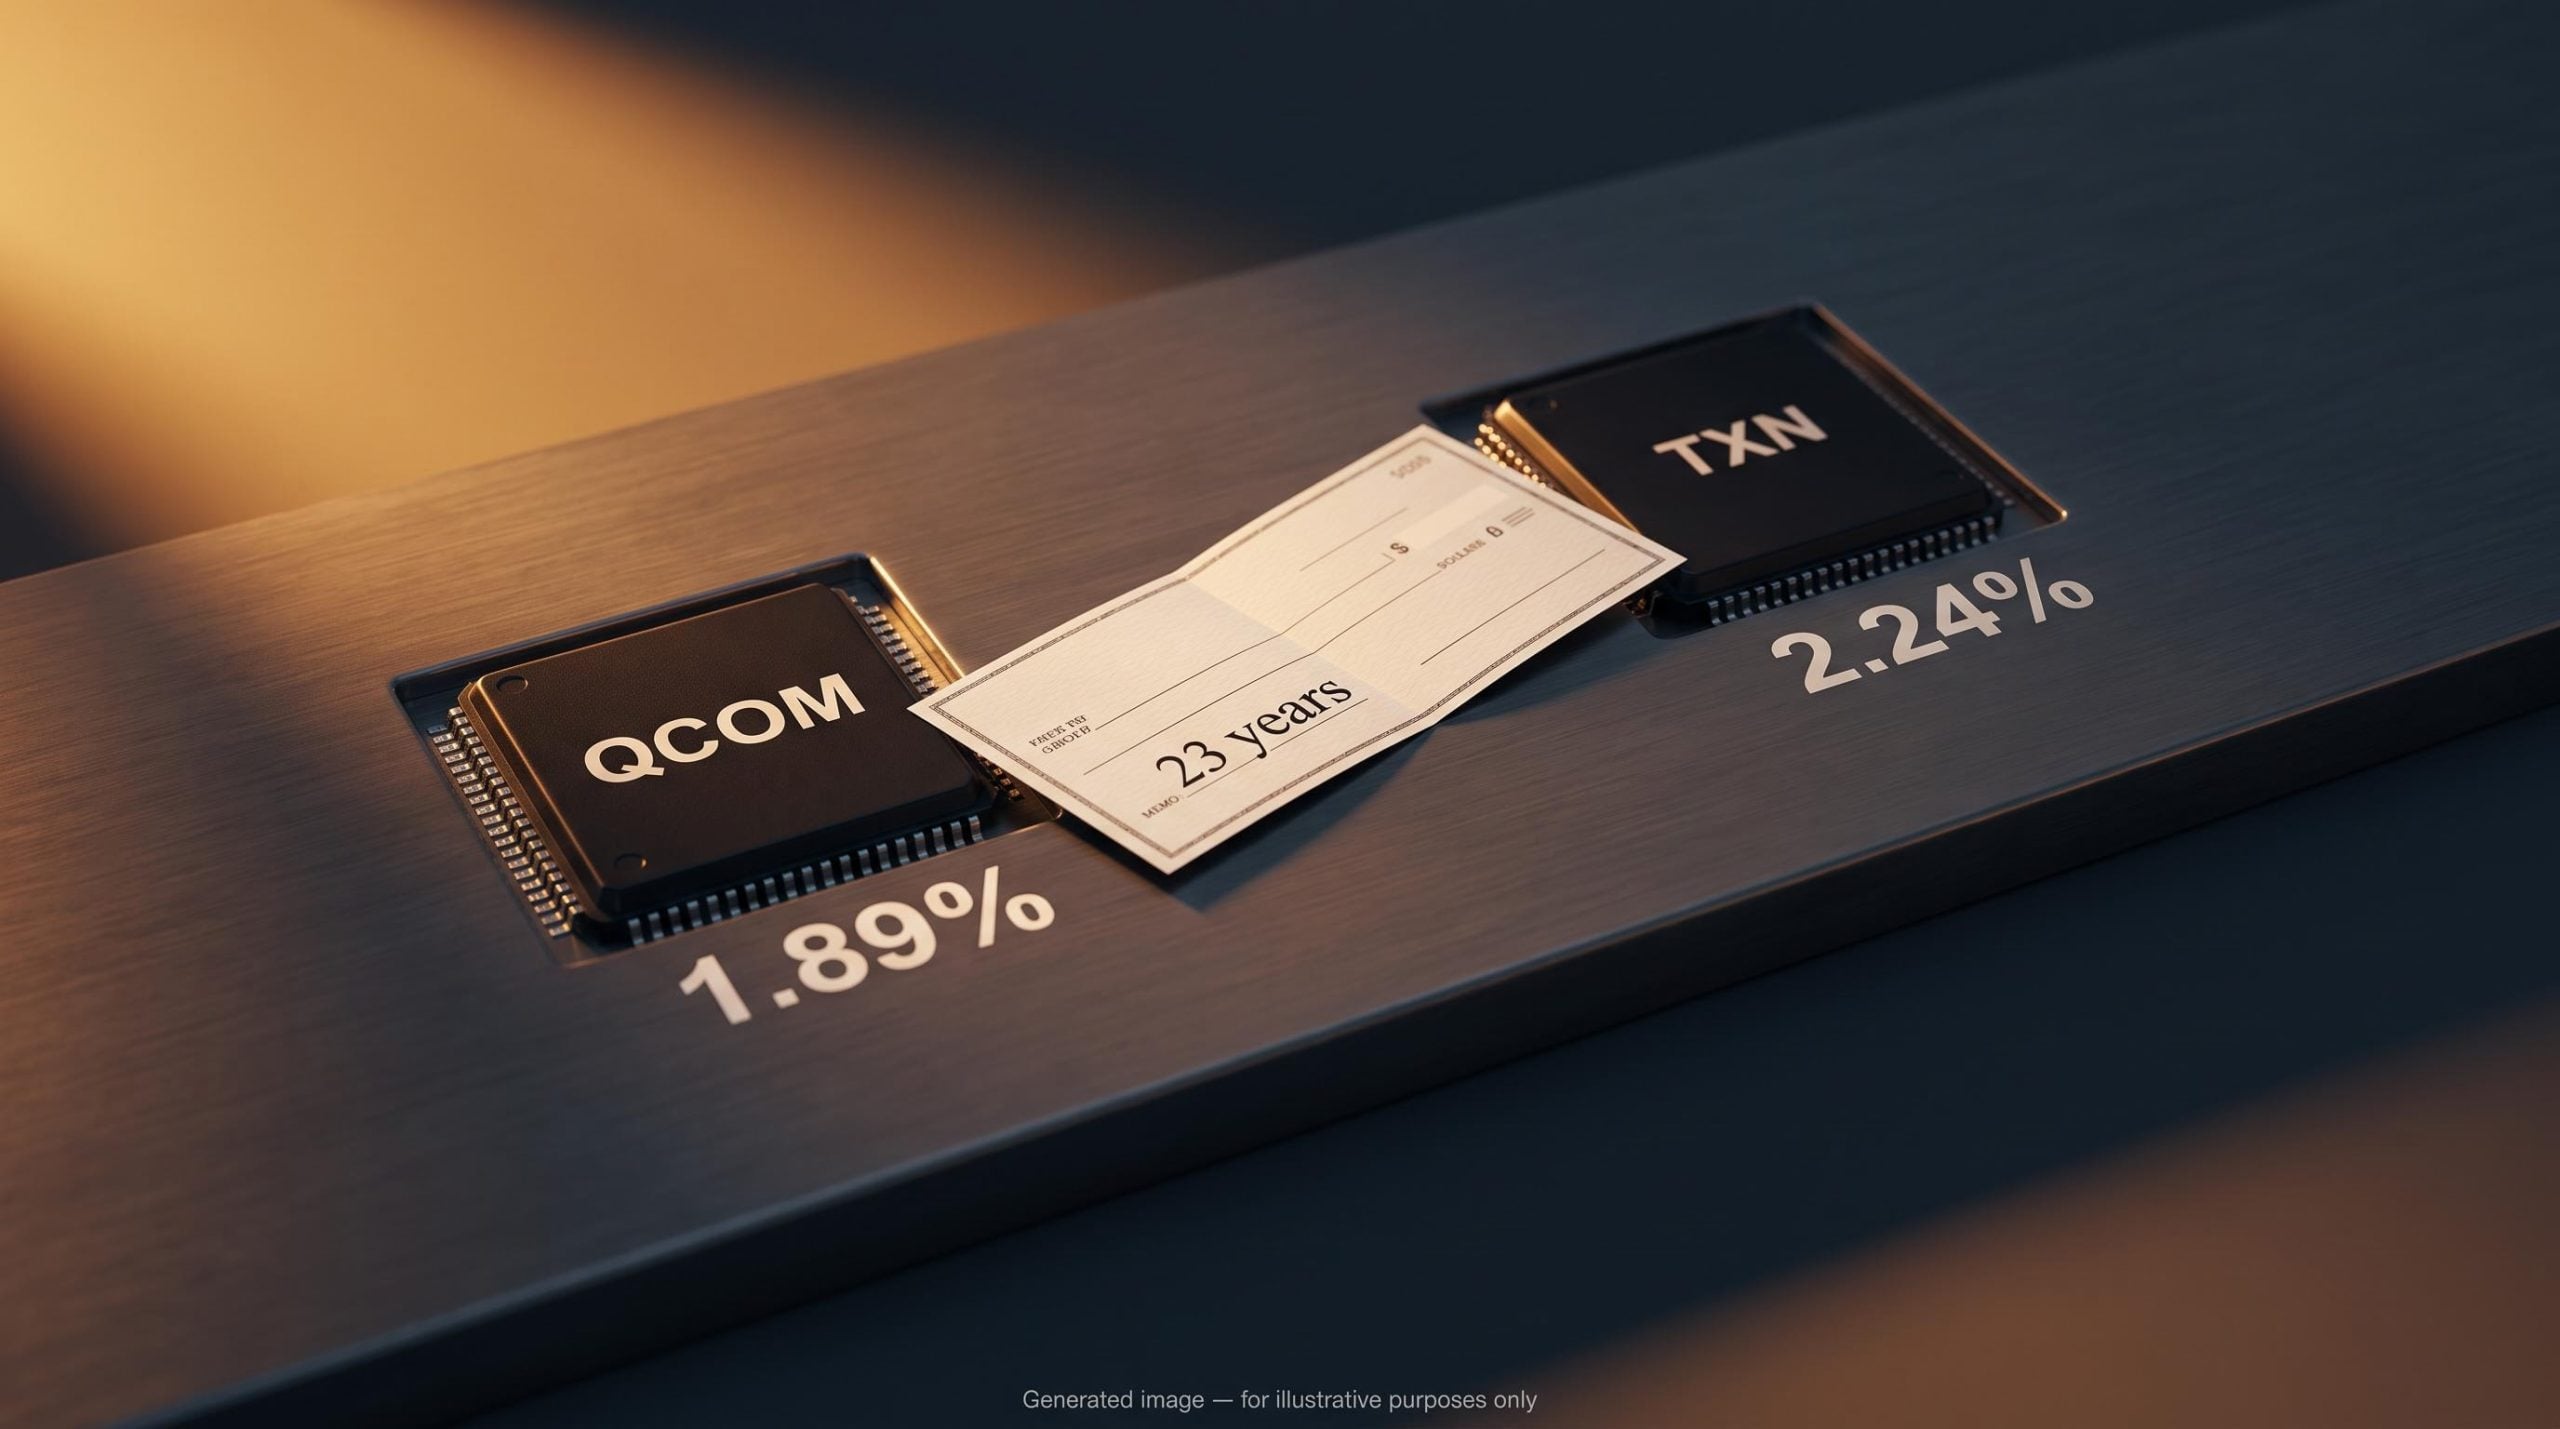
Semiconductor stocks and dividend income rarely appear in the same sentence. The two names sitting near the top of a major dividend ETF right now are neither Nvidia nor Intel, and both of them cut cheques to shareholders that most chip investors would not expect. They are Qualcomm and Texas Instruments.
That surprise is worth taking seriously. SCHD, one of the largest dividend funds in the United States, tracks an index that screens on free cash flow relative to debt, return on equity, consecutive dividend history, and five-year dividend growth. None of those are growth metrics. When two semiconductor companies clear all of them, it tells you their businesses work fundamentally differently from the artificial intelligence accelerator names that dominate chip headlines.
Here is what this piece delivers: whether Qualcomm, Texas Instruments, or both deserve a place in an income portfolio, what makes each case distinct, and where the genuine risks sit. Not a summary of what an index holds, but a framework for deciding whether these two companies earn your capital on their own terms.
What makes a semiconductor company a dividend investment
A dividend-paying semiconductor is not a contradiction. It is the output of a specific business structure, and understanding that structure is the first step to judging any income claim in the sector.
Four qualities separate a dividend-eligible chip company from a growth-only one. A long, unbroken history of payments. Free cash flow that comfortably covers the payout rather than straining it. Diversified end-market exposure that smooths revenue across cycles. And moderate reinvestment intensity, meaning the company does not need to plough every dollar back into capacity just to stand still.
Both Qualcomm and Texas Instruments carry all four. Texas Instruments has raised its dividend for 23 consecutive years. Qualcomm generated roughly $10.42 billion in trailing 12-month free cash flow, converting 28.9% of its $44.3 billion FY2025 revenue into cash.
Yield figures like these only tell part of the story because dividend mechanics include the price-drop adjustment on the ex-dividend date, meaning total return across price appreciation and distributions is the more complete measure of what each holding actually delivers.
SCHD’s underlying benchmark, the Dow Jones U.S. Dividend 100 Index, formalises these qualities into a screen. To qualify, a company must clear the following:
- A minimum of 10 consecutive years of dividend payments
- Free cash flow measured against total debt
- Return on equity
- Dividend yield
- Five-year dividend growth rate
The point that matters most for an investor is easy to miss. Satisfying one of these criteria is common. Satisfying all five simultaneously is meaningfully harder, and it maps directly onto the qualities that let a business distribute cash reliably year after year. When you see both Qualcomm and Texas Instruments inside that screen, you are looking at businesses engineered to convert operations into distributable cash.
Qualcomm’s cash profile Trefis characterised Qualcomm as having “showered owners with cash,” pointing to $10.42 billion in trailing free cash flow funding both dividends and buybacks, even as the share price lagged the broader market.
Where the AI chip narrative diverges
High-growth GPU names sit on the other side of a clear line. They are judged on revenue growth and competitive positioning within AI infrastructure, not on yield plus dividend growth.
For those companies, reinvestment dominates capital allocation. Earnings are retained to fund research, capacity, and expansion, which leaves dividends as a rounding error on the thesis rather than a reason to own the stock. Their cash flows are also more volatile, which makes them a poor structural fit for the income-oriented screens that Qualcomm and Texas Instruments pass with room to spare.
When big ASX news breaks, our subscribers know first
Texas Instruments: the analog cash machine and what 23 years of increases actually mean
Twenty-three years of consecutive dividend increases is not luck. It is the visible output of a business model deliberately built to generate and distribute cash over long horizons.
Texas Instruments makes analog chips, the components that manage power and signals inside industrial and automotive equipment. These parts stay in production for many years because the products they go into have slow replacement cycles. That longevity smooths revenue across macro cycles in a way consumer electronics never can.
Three structural drivers underpin the model:
- Long product lifecycles in industrial and automotive markets, reducing obsolescence risk and supporting recurring demand.
- An own-fab manufacturing strategy, where internal factories are designed to lift long-run free cash flow per share once the heavy build-out phase passes.
- A capex transition now underway, as the company moves from front-loaded fab investment toward the harvest phase.
That transition is the part income investors should watch closely. Texas Instruments slashed its 2026 capital expenditure after a heavy build-out period, and management now targets more than $8 in free cash flow per share for 2026, with CHIPS Act incentives included in its FCF definition.
Management’s forward anchor Texas Instruments is targeting free cash flow of more than $8 per share in 2026 as capex moderates, an outlook management explicitly links to its ability to keep raising the dividend and repurchasing shares.
The latest declaration reflects that confidence. On 17 September 2026, the board announced a quarterly dividend of $1.52, a 7% rise from $1.42, payable 10 November 2026. That annualises to $6.08, a yield of roughly 2.24% as of late September 2026.
| Quarterly dividend | Annualised | Yield | Increase streak | Trailing FCF (Q2 2026) |
|---|---|---|---|---|
| $1.52 | $6.08 | ~2.24% | 23 years | $6.534B |
There is one detail that separates casual analysis from serious due diligence. For the 12 months to March 2026, Texas Instruments returned $6.03 billion to shareholders (including $5.05 billion in dividends and $982 million in repurchases) against only $4.35 billion in free cash flow. On calendar-year FY2025, a heavy capex year, FCF was $2.938 billion, on Q1 2026 revenue of $4.83 billion.
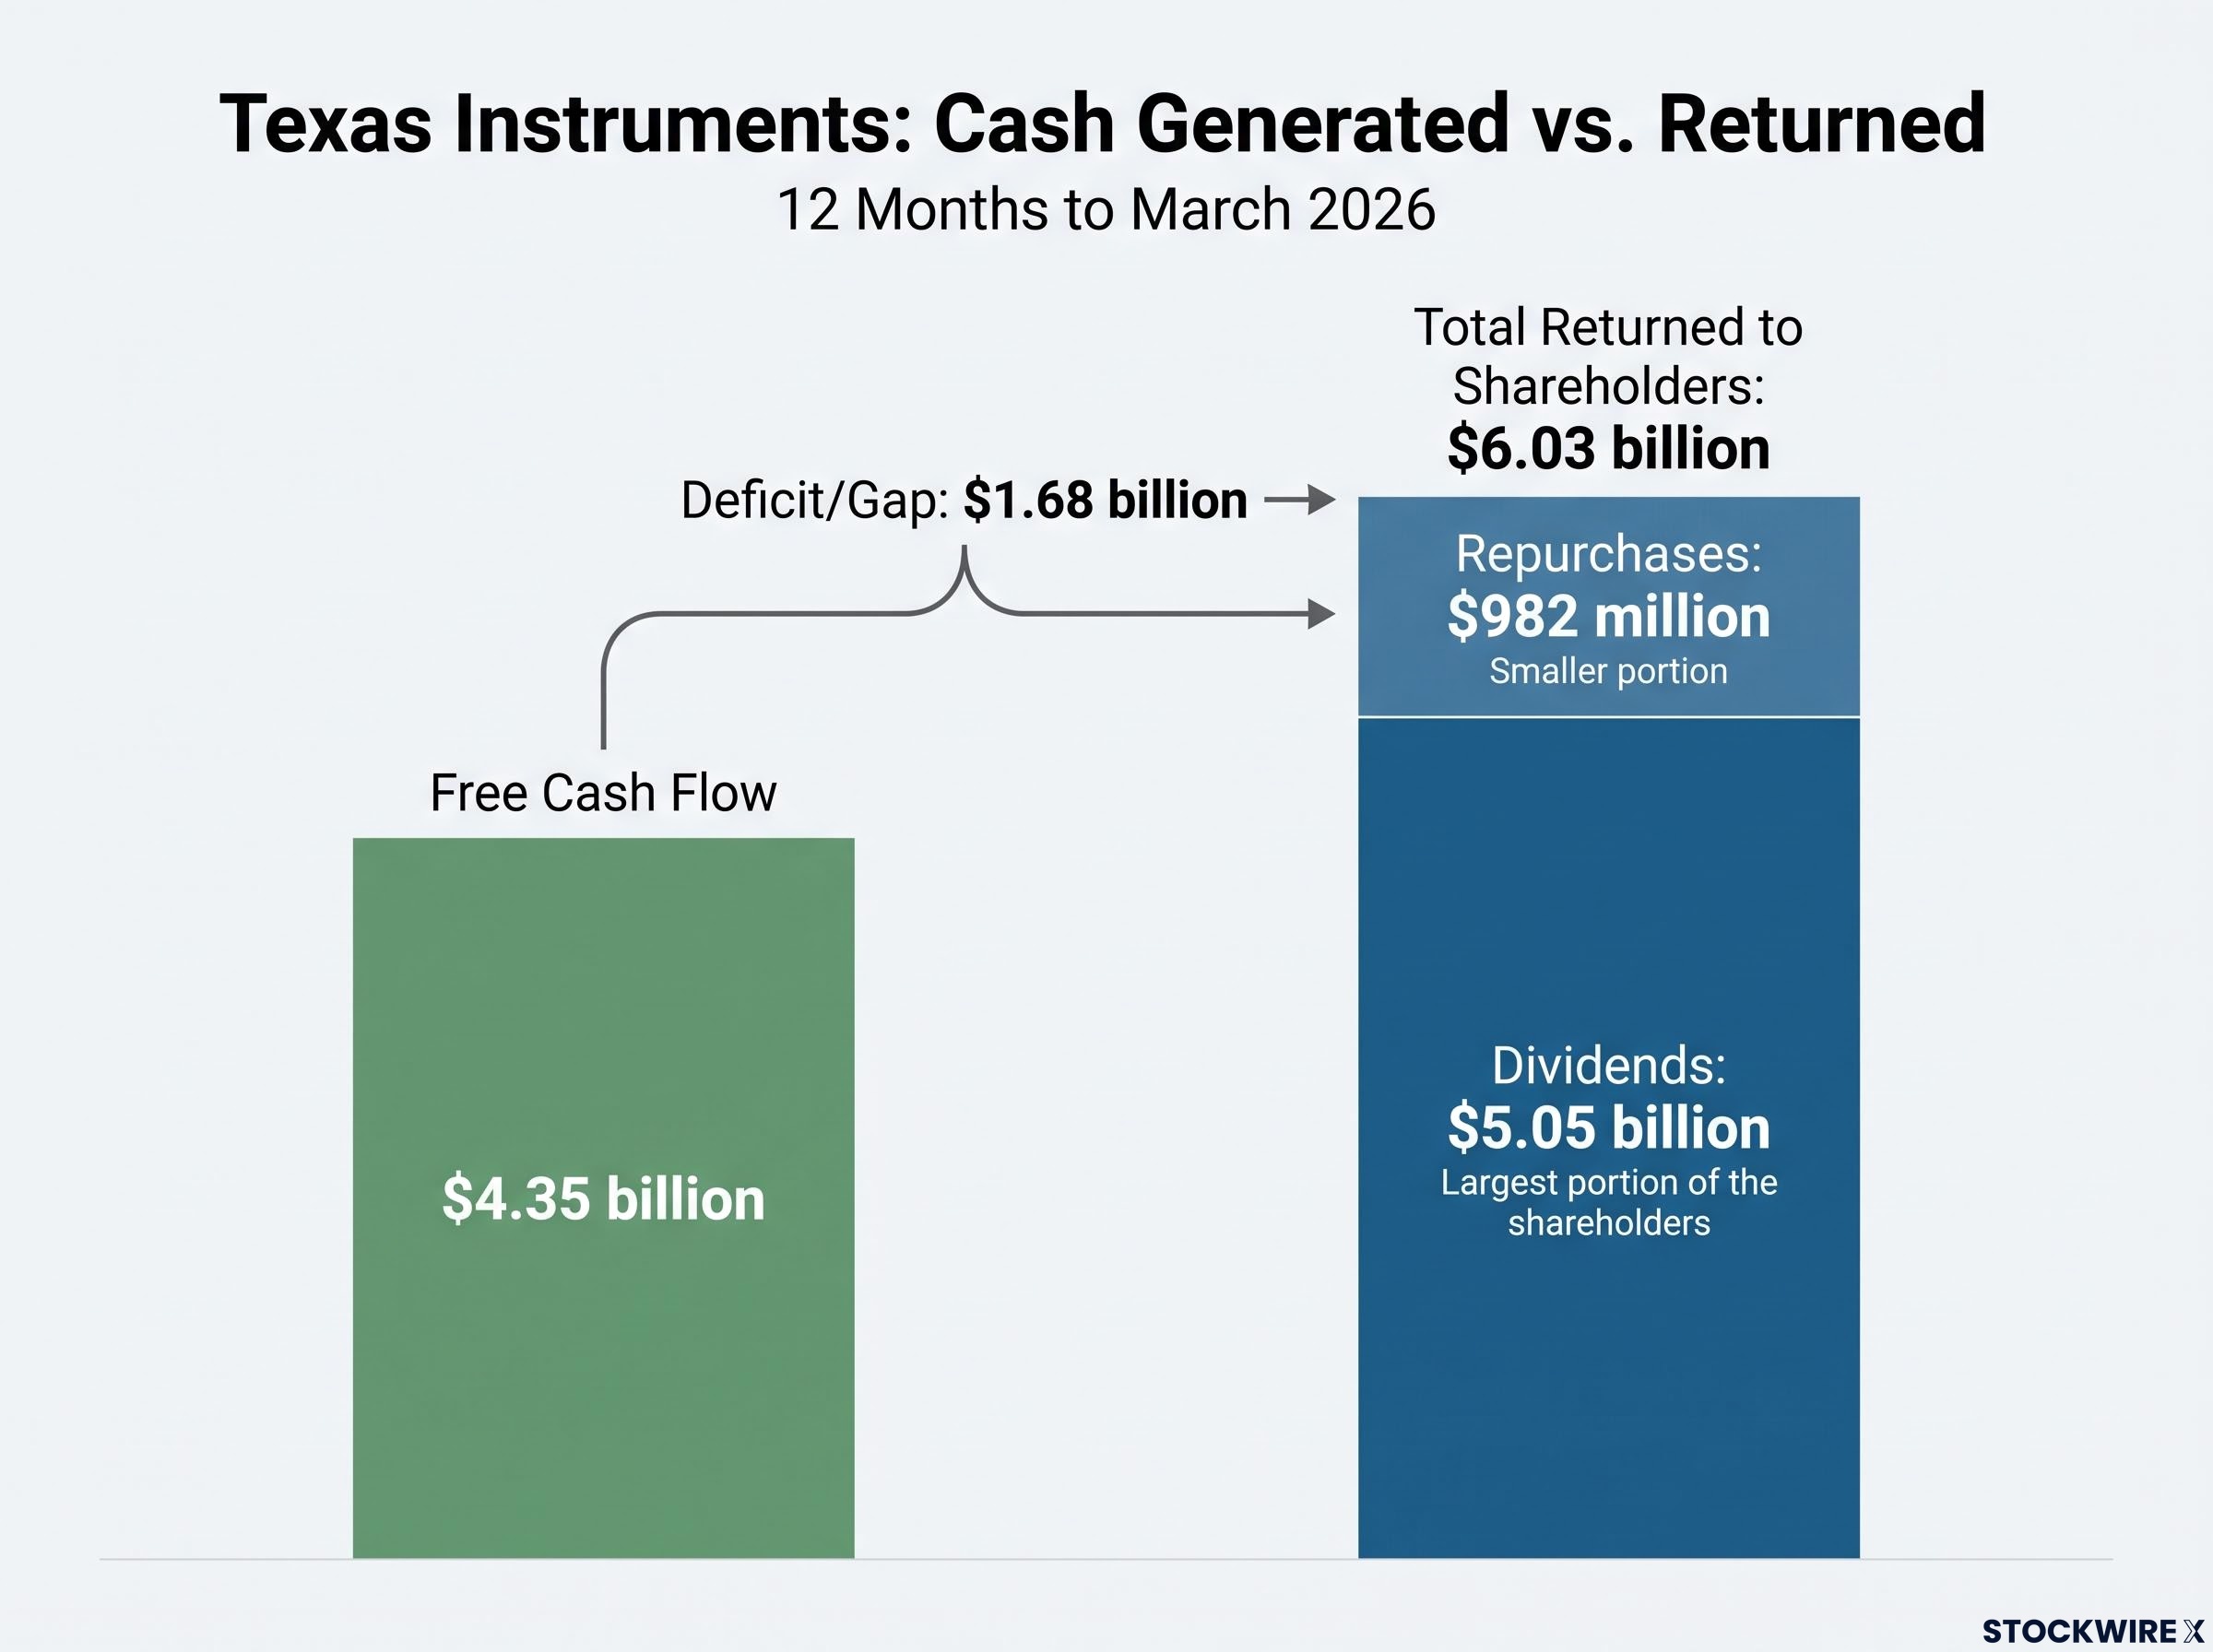
Returning more than you generate looks alarming until you place it in context. This is a deliberate balance-sheet decision, funded by prior cash accumulation and anchored to management’s expectation that FCF per share climbs sharply as capex rolls off. Read that way, it is a bet on the recovery, not a sign of payout stress. Whether that bet pays is a question the next sections take up directly.
Texas Instruments’ SEC 10-K filing for the fiscal year ending December 31, 2025, documents the FCF figure of $2.938 billion alongside the capital expenditure commitments underpinning management’s expectation that free cash flow per share recovers sharply once the build-out phase passes.
Qualcomm: total return architecture with a growing income component
Qualcomm tells a different dividend story, and mistaking it for a Texas Instruments clone would lead you to the wrong conclusion. Here, dividends and buybacks operate together as a single capital-return machine.
The clearest signal came on 17 March 2026, when the board lifted the quarterly dividend from $0.89 to $0.92 ($3.68 annualised) and announced a fresh $20 billion stock repurchase program in the same breath. That pairing is the whole point. Qualcomm distributes capital through two channels rather than maximising a single headline yield.
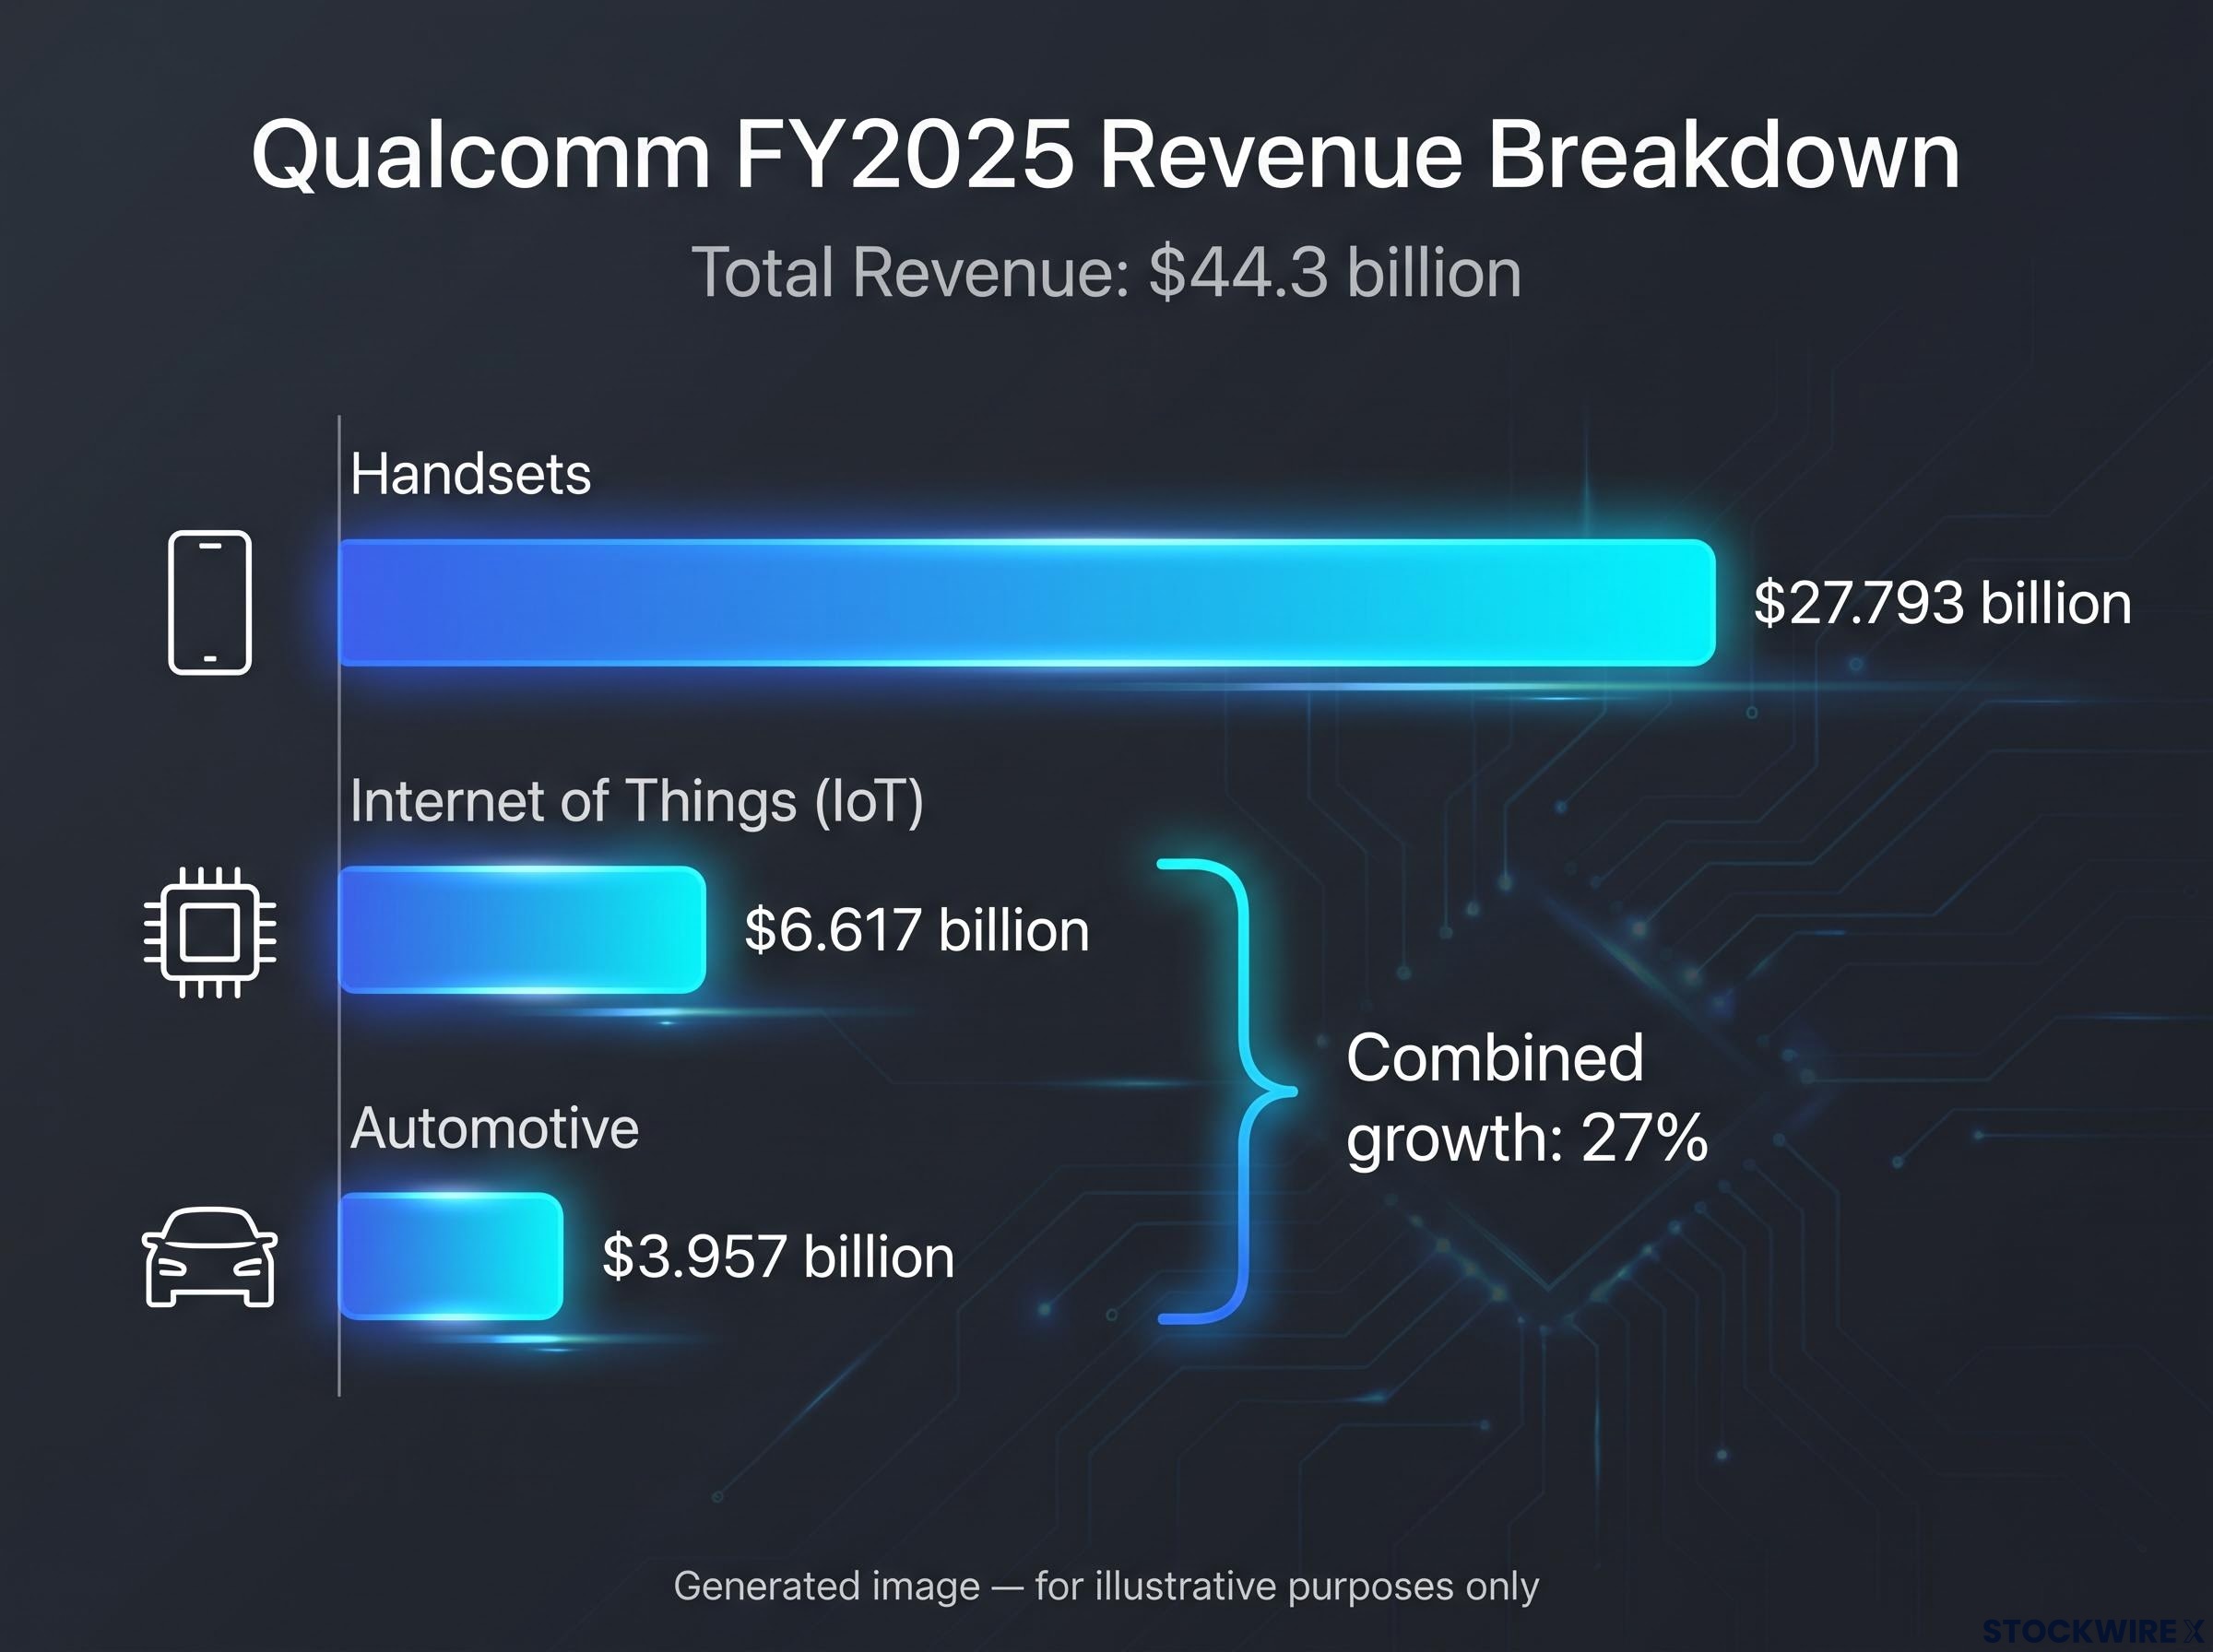
The income case rests on how the business is shifting away from smartphones. Qualcomm’s FY2025 revenue breakdown shows the direction of travel:
- Handsets: $27.793 billion, still the dominant contributor
- Internet of Things (IoT), the market for connected devices like industrial sensors and wearables: $6.617 billion
- Automotive: $3.957 billion
Automotive and IoT grew a combined 27% in FY2025. That matters because it is the offsetting growth that would need to fund future dividend increases as the mature handset business slows.
Much of that growth ties to on-device AI, which is distinct from the cloud AI infrastructure driving GPU demand. On-device AI runs the processing locally on a phone, a vehicle, or an industrial device rather than in a data centre. It positions Qualcomm at the edge of the AI build-out rather than at its centre.
Semiconductor end-market divergence is the key analytical frame here: Qualcomm’s 3.5% revenue contraction in Q2 2026 occurred in the same quarter the processor segment accelerated to 67% year-over-year growth, confirming that the handset cycle and the AI infrastructure cycle are running on entirely separate clocks.
| Metric | Qualcomm (QCOM) | Texas Instruments (TXN) |
|---|---|---|
| Quarterly dividend | $0.92 | $1.52 |
| Annualised dividend | $3.68 | $6.08 |
| Yield (Sep 2026) | ~1.89% | ~2.24% |
| Trailing 12-month FCF | ~$10.42B | $6.534B |
| Primary return mechanism | Dividend plus buyback | Dividend-growth focus |
Qualcomm’s yield of roughly 1.89% sits below Texas Instruments and below traditional income thresholds. Its FY2025 free cash flow was $12.8 billion, though Q3 2026 FCF of just $495 million shows real quarterly variability that should not be read as a trend.
Here is the interpretive read you should take. The $20 billion buyback alongside a modest yield is not a consolation prize. It is a deliberate architecture for investors who want growing income plus a shrinking share count plus diversified growth optionality. The question is whether that mix fits your income strategy, or whether you need a higher-yield-focused position elsewhere.
Where the dividend case breaks down: the real risks in each name
Optimism is only useful when it survives contact with the downside. Both dividends depend on continued strong free cash flow, and each company has a specific mechanism through which that cash could tighten.
Free cash flow quality is the metric that separates a sustainable payout from one propped up by favourable accrual accounting; a company can report healthy EPS while generating far less distributable cash, which is why the FCF payout ratio carries more weight than the earnings-based equivalent when stress-testing either of these names.
The risks split cleanly by company:
Qualcomm risks:
- Handset concentration. FY2025 handset revenue of $27.793 billion dwarfs the combined automotive and IoT total of roughly $10.6 billion. A downturn in global smartphone demand, or lost share at a major customer, would hit the cash flow that funds the payout directly.
- China and customer concentration. Exposure to a handful of large OEMs and to China creates margin and FCF risk from export controls, tariffs, or shifting procurement, compressing the headroom for dividend growth.
- Edge AI and automotive execution. If automotive and IoT grow more slowly than expected, the offsetting FCF that justifies dividend-growth projections may simply not arrive on schedule.
Texas Instruments risks:
- Returns exceeding FCF. The payout posture leans on the balance sheet in weaker windows, which only works if the FCF-per-share recovery lands as management projects.
- Cyclicality. Industrial and automotive end markets remain cyclical. A macro slowdown or production cut could compress orders precisely when fab investments are already locked in.
The figure that earns its own scrutiny For the 12 months to March 2026, Texas Instruments generated $4.35 billion in free cash flow but returned $6.03 billion to shareholders, including $5.05 billion in dividends.
That gap frames the core question for Texas Instruments. It is not whether management hits its more than $8 FCF-per-share target in a base case. It is whether the dividend remains comfortable if that target slips 20-30% in a demand downturn. Qualcomm’s $495 million Q3 2026 FCF is a reminder that quarterly cash generation can swing hard, and you should form a view on both scenarios before committing capital rather than leaning on the trailing record alone.
Qualcomm’s Q3 2026 10-Q, covering the quarter ending June 28, 2026, is the source for the $495 million quarterly FCF figure that illustrates how sharply cash generation can move within a single reporting period, making trailing annual figures an incomplete basis for payout analysis.
Making the call: which of these dividend semiconductors fits your portfolio
The decision does not come down to which company has the longer streak or the higher yield in isolation. It comes down to which capital-return architecture matches your own income timeline and risk tolerance.
If your priority is maximum yield, the longest consecutive-increase record, and a pure dividend-growth story, Texas Instruments is the clearer fit, with a 2.24% yield, a $6.08 annualised dividend, and 23 years of increases behind it. If you want a total-return structure combining growing income, share-count reduction, and diversified growth optionality, Qualcomm warrants consideration, with its 1.89% yield, $3.68 annualised dividend, and $20 billion buyback program.
| Investor priority | Better-suited name | Primary reason |
|---|---|---|
| Yield maximisation | Texas Instruments | Higher yield and larger dollar payout |
| Dividend-growth streak | Texas Instruments | 23 consecutive years of increases |
| Total-return architecture | Qualcomm | Dividend plus $20B buyback plus growth |
| Diversified chip exposure | Both | Non-AI-infrastructure semiconductor income |
| Tolerance for cyclicality | Depends on view | TXN: industrial cycles; QCOM: handset cycles |
Held together, the two provide chip exposure inside a dividend portfolio that does not depend on AI accelerator spending. That is how they contribute to a fund-level payout like SCHD’s $0.2665 per-unit Q3 2026 distribution (ex-date 23 September 2026).
Track three things from here:
- Texas Instruments FCF per share against its more than $8 target.
- Qualcomm’s automotive and IoT revenue growth.
- The dividend declaration cadence from each company.
Neither is a high-yield name in absolute terms. If you need yield above 3-4%, look elsewhere. The case for these two rests on dividend growth, free cash flow quality, and business durability, not current yield.
For investors wanting to apply a structured process beyond the SCHD screen, our dedicated guide to screening dividend stocks walks through a four-pillar framework covering total shareholder yield, three-statement financial scoring, and DCF valuation with a margin of safety.
This article is for informational purposes only and should not be considered financial advice. Investors should conduct their own research and consult with financial professionals before making investment decisions. Past performance does not guarantee future results, and financial projections are subject to market conditions and various risk factors.