Meta extended the useful life of certain servers and network assets at the start of 2025, and that single decision added roughly $2.59 billion to its after-tax profit for the year, money that would not otherwise have appeared on the bottom line.
That figure is not a typo, and it is not fraud. It is an accounting election, and it sits inside earnings reports across the technology sector at a moment when the four largest US technology companies are spending between $80 billion and $220 billion a year building AI infrastructure. Each of them has recently stretched out the depreciation schedule on the hardware they are buying, and all of this is happening while the US federal deficit runs above $1.9 trillion annually. Those two facts are quietly wired into the profit lines being reported every quarter.
Here is what this piece gives you: a way to read a hyperscaler earnings report and separate the portion of profit that reflects real business performance from the portion that is an accounting artefact, and from the portion that is downstream of borrowed public money.
The accounting gap hiding inside Big Tech’s profit reports
The distortion begins with a mismatch in timing. When a chipmaker sells a graphics processing unit (GPU), the specialised chip that powers AI workloads, it books the revenue and the profit immediately. When a hyperscaler buys that same chip, it does not expense the cost at once. It capitalises the purchase and spreads the cost across five to six years.
One side of the transaction records profit today. The other side defers most of its cost into the future. Multiply that across an industry spending hundreds of billions, and you get a structural, time-shifted inflation of reported earnings that flatters the sector as a whole.
What the sellers booked
Nvidia is the clearest example of immediate seller-side recognition. Its Data Center revenue rose 217% to $47.5 billion in fiscal 2024, total revenue climbed 126%, and GAAP earnings per share jumped 586% year-over-year.
Roughly 40% of that Data Center revenue was attributed to AI inference, the stage where a trained model actually runs and answers queries. That matters, because it tells you real workloads, not just speculative stockpiling, sit underneath at least a meaningful slice of the hardware demand.
What the buyers deferred
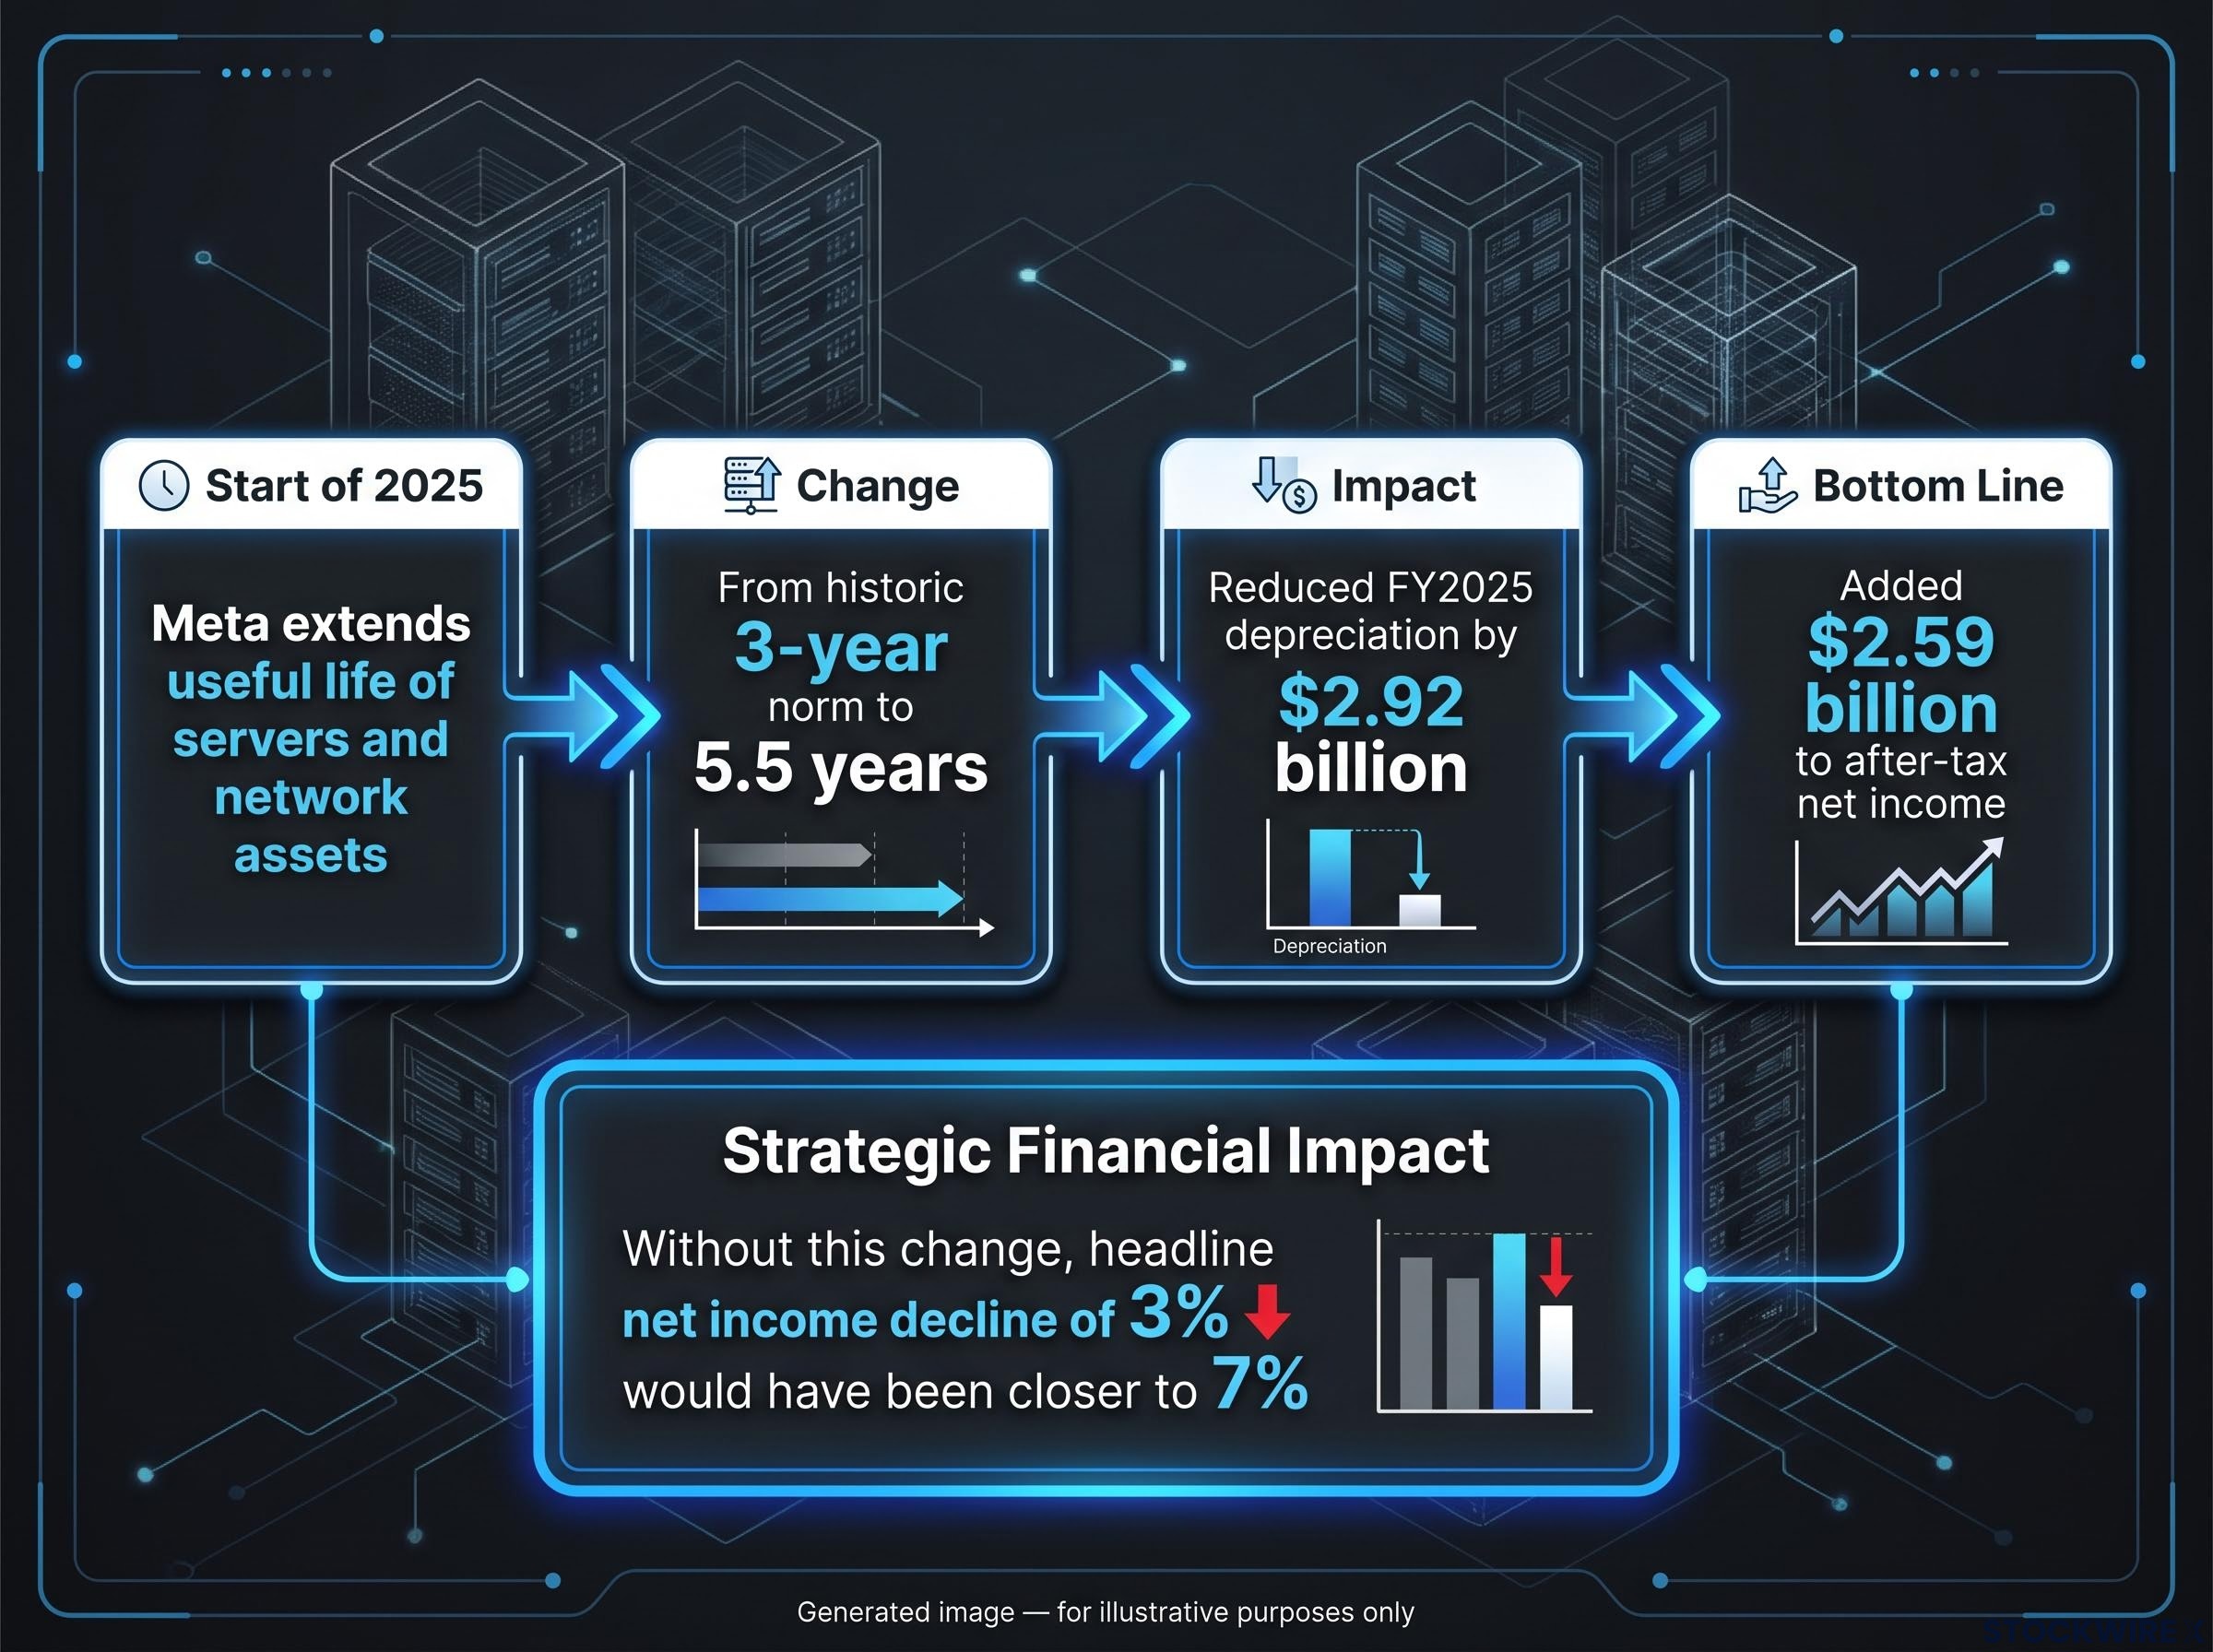
The buyer side is where the earnings picture gets flattered. Meta provides the most precisely documented case. Effective 1 January 2025, it extended the estimated useful life of certain servers and network assets to 5.5 years, which reduced FY2025 depreciation by $2.92 billion and lifted after-tax net income by approximately $2.59 billion.
Without that change, Meta’s headline net income decline of 3% would have been closer to 7%. The extension was an active management choice, not a passive outcome, and it was not made in isolation.
The PwC guidance on determining useful life establishes that useful-life estimates must reflect the period over which an asset is expected to contribute to future cash flows, a standard that sits in direct tension with hyperscaler depreciation schedules that extend well beyond the likely economic life of rapidly evolving GPU hardware.
| Company | Historic schedule | New schedule | Estimated earnings impact |
|---|---|---|---|
| Meta (confirmed) | Historic 3-year norm for servers | 5.5 years | +$2.59B after-tax net income (FY2025) |
| Amazon, Microsoft, Alphabet (directional) | 3-year norm | Extended toward 5-6 years | Contributes to Burry’s ~$176B aggregate estimate |
Investor Michael Burry has advanced the most prominent version of this thesis.
Burry estimates that the five major hyperscalers are depreciating their AI GPUs over five to six years when the economic life is closer to two or three, understating aggregate depreciation by roughly $176 billion and inflating current reported profits.
The practical read is straightforward. A portion of the profit line in every hyperscaler earnings report is an accounting decision rather than operational performance, and you should mentally mark reported earnings down before drawing conclusions about business health.
When big ASX news breaks, our subscribers know first
Why government deficits are quietly inside every earnings beat
There is a second lever, and it operates at the level of the whole economy rather than the individual company. It is called the Kalecki-Levy profit equation, and it is not a theory so much as an accounting identity.
The idea is this: corporate profits mechanically equal investment plus government deficits plus dividends, minus household saving and foreign saving. Because the private sector’s surplus is the mirror image of the public sector’s deficit, government borrowing flows directly into private sector income. It is not commentary on policy. It is arithmetic.
When Washington runs a deficit, that money has to land as income somewhere. A significant share of it lands as corporate profit.
The federal deficit trajectory carries direct transmission routes into equity portfolios beyond the Kalecki-Levy profit channel: rising Treasury yields compress equity risk premiums, and the CBO’s projection of debt reaching 118% of GDP by 2035 implies a structurally higher cost of capital against which current earnings multiples will be continuously discounted.
Here are the fiscal numbers that matter:
- The Congressional Budget Office (CBO) projects a federal budget deficit of about $1.9 trillion in fiscal year 2025, equal to 6.2% of GDP.
- Deficits are projected to climb to 7.3% of GDP by 2055, with federal debt reaching 118% of GDP by 2035.
- The FY2026 year-to-date deficit through 11 months already sits near $1.97 trillion, exceeding the full-year FY2025 deficit of $1.775 trillion.
- Total acknowledged federal debt exceeds $40 trillion. One source estimates off-balance-sheet liabilities at roughly $125 trillion, though that figure comes from a single source and should be treated as indicative rather than confirmed.
The connection to the AI earnings boom becomes clear once you see the relationship quantified.
Research Affiliates has found a nearly one-for-one long-run relationship between fiscal deficits and corporate profits, warning that chronic deficits stimulate consumption and flow almost directly into equity valuations.
That one-for-one link is what you need to hold onto. If the deficit narrows, whether through spending cuts or a recession that collapses tax revenues, the mechanical support underneath tech sector earnings weakens at the same time. Reported profits would fall even if every company executed flawlessly.
CIO George Noble frames the backdrop bluntly, arguing the US increasingly resembles an emerging market in its fiscal trajectory, and that a soft default through monetary expansion is a more likely path than an outright default. For you, the takeaway is that earnings beats during a high-deficit period are partly a reflection of fiscal policy, not purely business quality. That distinction changes how durable those beats look.
How the accounting and macro levers compound each other
These two distortions do not simply sit side by side. They multiply.
Depreciation understatement inflates the numerator of corporate earnings. Deficit spending inflates the demand that lets revenue grow in the first place. Both sides of the profit equation are being pushed up at once, which makes the current picture more fragile than either mechanism would suggest alone.
Now bring valuation into it. If earnings are overstated, then the price-to-earnings (P/E) multiples that appear to justify current prices are themselves understated in real terms. FactSet reports a forward 12-month P/E of 22.8 times for the S&P 500 and 30.7 times for the Information Technology sector. Apply those multiples to inflated earnings and the true price you are paying for the underlying performance is higher than the headline number implies.
Circular AI financing arrangements add a third mechanism on top of depreciation understatement and deficit support: when the same capital flows as both an investment and a reported revenue between Nvidia, Microsoft, OpenAI, and Anthropic, the revenue lines investors use to justify current multiples are themselves overstated before accounting elections are even applied.
The scale of capital involved is what sharpens the concern.
Julian Garrett estimates that capital misallocation in the current AI cycle is approximately 20 times greater than during the dot-com era.
Technology-related equities now make up roughly half of major US equity index weightings, so this is not a niche sector question. It sets the valuation for the broad market.
Does the dot-com comparison hold?
Partly, and the honest version cuts both ways. The comparison holds on aggregate capital deployment. The 1990s telecom build-out peaked at about $30 billion a year, against hundreds of billions for the big four hyperscalers today. Capex intensity has reached 34% of revenue, more than double the roughly 15% seen at the height of the internet build-out.
But the comparison breaks down on financial strength. S&P 500 forward multiples are lower today, near 22 times against roughly 27 times at the 2000 peak, and hyperscaler balance sheets are far stronger than the debt-laden telecom operators of the 1990s. The capital being deployed dwarfs the dot-com era, but the companies deploying it are not fragile in the same way.
| Metric | Dot-com peak | Current AI cycle |
|---|---|---|
| Annual infrastructure spend | ~$30B (telecom) | Hundreds of billions (Big 4) |
| Capex as % of revenue | ~15% | 34% |
| S&P 500 forward P/E at peak | ~27x | ~22x |
The point that survives the comparison is not that valuations are identical. It is that standard valuation tools are being applied to earnings inputs carrying two embedded overstatements, which means your margin of safety is likely narrower than the multiples suggest.
Goldman Sachs’ dividend discount model analysis finds that implied earnings growth expectations baked into tech sector prices have already surpassed the 2000 dot-com peak on a sector-specific basis, even as headline P/E multiples have compressed, which reinforces the point that standard valuation tools are being applied to an earnings numerator carrying embedded overstatements.
Reading the bull case honestly before dismissing it
None of this means the AI boom is an illusion, and the strongest version of the bull case deserves a fair hearing rather than a straw man.
The revenue is real and it is large:
- Aggregate AI infrastructure revenue reached $337 billion in 2025 according to 451 Research, indicating revenue is currently tracking with capex.
- IDC estimates full-year 2025 AI infrastructure spending hit $318 billion and will exceed $1 trillion by 2029.
- Roughly 40% of Nvidia’s Data Center revenue is attributed to AI inference, evidence that real workload demand underpins a meaningful share of hardware purchases.
- Meta’s core advertising engine has continued to sustain strong monetisation alongside its capex ramp (specific quarterly revenue figures here are indicative and not independently confirmed).
- Microsoft’s Azure AI business has reached a substantial run-rate with strong reported growth, supported by large commercial commitments (the specific run-rate and growth percentages are indicative and carry a sourcing caveat).
Hyperscaler balance sheets are also structurally different from 1990s telecom operators. Robust private funding and mega-cap cash generation act as buffers against a forced-liquidation scenario, which lowers the risk of a credit-driven collapse.
So the debate is not whether AI revenues exist. It is whether they will scale fast enough to justify the depreciation costs being deferred into future years. Three questions remain genuinely unresolved:
- Depreciation timeline risk: will GPUs remain economically useful over the five to six years they are being depreciated across?
- Revenue-to-capex gap: will monetisation close the distance with the enormous spending already committed?
- Chinese low-cost competition: will cheaper AI development compress the margins the current build-out assumes?
Dismissing the boom as pure illusion ignores the monetisation. Accepting it uncritically ignores the accounting and macro levers amplifying genuine revenue into inflated profit. The useful position is to locate where value is actually being created (inference-layer usage, cloud revenue) versus where accounting elections and deficit support are doing the heavy lifting (net income margins at the hyperscaler level).
Where the reversal risk actually lives
The risk here is not a vague warning about downside. It is a specific sequence.
If hyperscaler capex reverses, the propagation runs in a chain:
- Hyperscalers cut capital expenditure guidance.
- GPU and semiconductor vendors lose their largest customers overnight.
- A core pillar of aggregate demand is removed from the economy.
- The deficit-financed profit support that flatters margins weakens at the same time.
- A recession collapses tax revenues, expands the deficit further, and feeds back into deteriorating corporate profitability.
The trigger most likely to start that chain is hardware obsolescence. Burry’s thesis holds that the economic life of AI GPUs is closer to two or three years than the five or six over which they are being depreciated. If he is right, hyperscalers face a write-down wave and a capex reset simultaneously.
The scale of what would need to reverse is not small. Amazon committed to a roughly $200-220 billion annual capex pace for 2026, the clearest single illustration of the spending that a reversal would have to unwind.
George Noble warns that a reversal in hyperscaler spending could trigger a severe recession, given how much aggregate demand and corporate profitability now sit downstream of this spending cycle.
For you, the reason this matters is that the three distortions in this piece, depreciation understatement, deficit-financed profits, and capex-driven demand, all reverse together in a downturn rather than unwinding gradually. That compresses earnings faster and harder than a standard recession model would project.
The commoditisation variable
There is one more pressure that operates independently of everything else. If AI inference costs fall rapidly because low-cost developers achieve comparable results with a fraction of the hardware, the revenue projections underpinning current capex simply cannot be met.
This is not a geopolitical argument. It is margin arithmetic. DeepSeek-class models demonstrating that the same inference output is achievable far more cheaply would put a structural ceiling on the returns the build-out assumes, weakening the ROI case regardless of any other factor.
What a structurally honest read of AI earnings actually shows
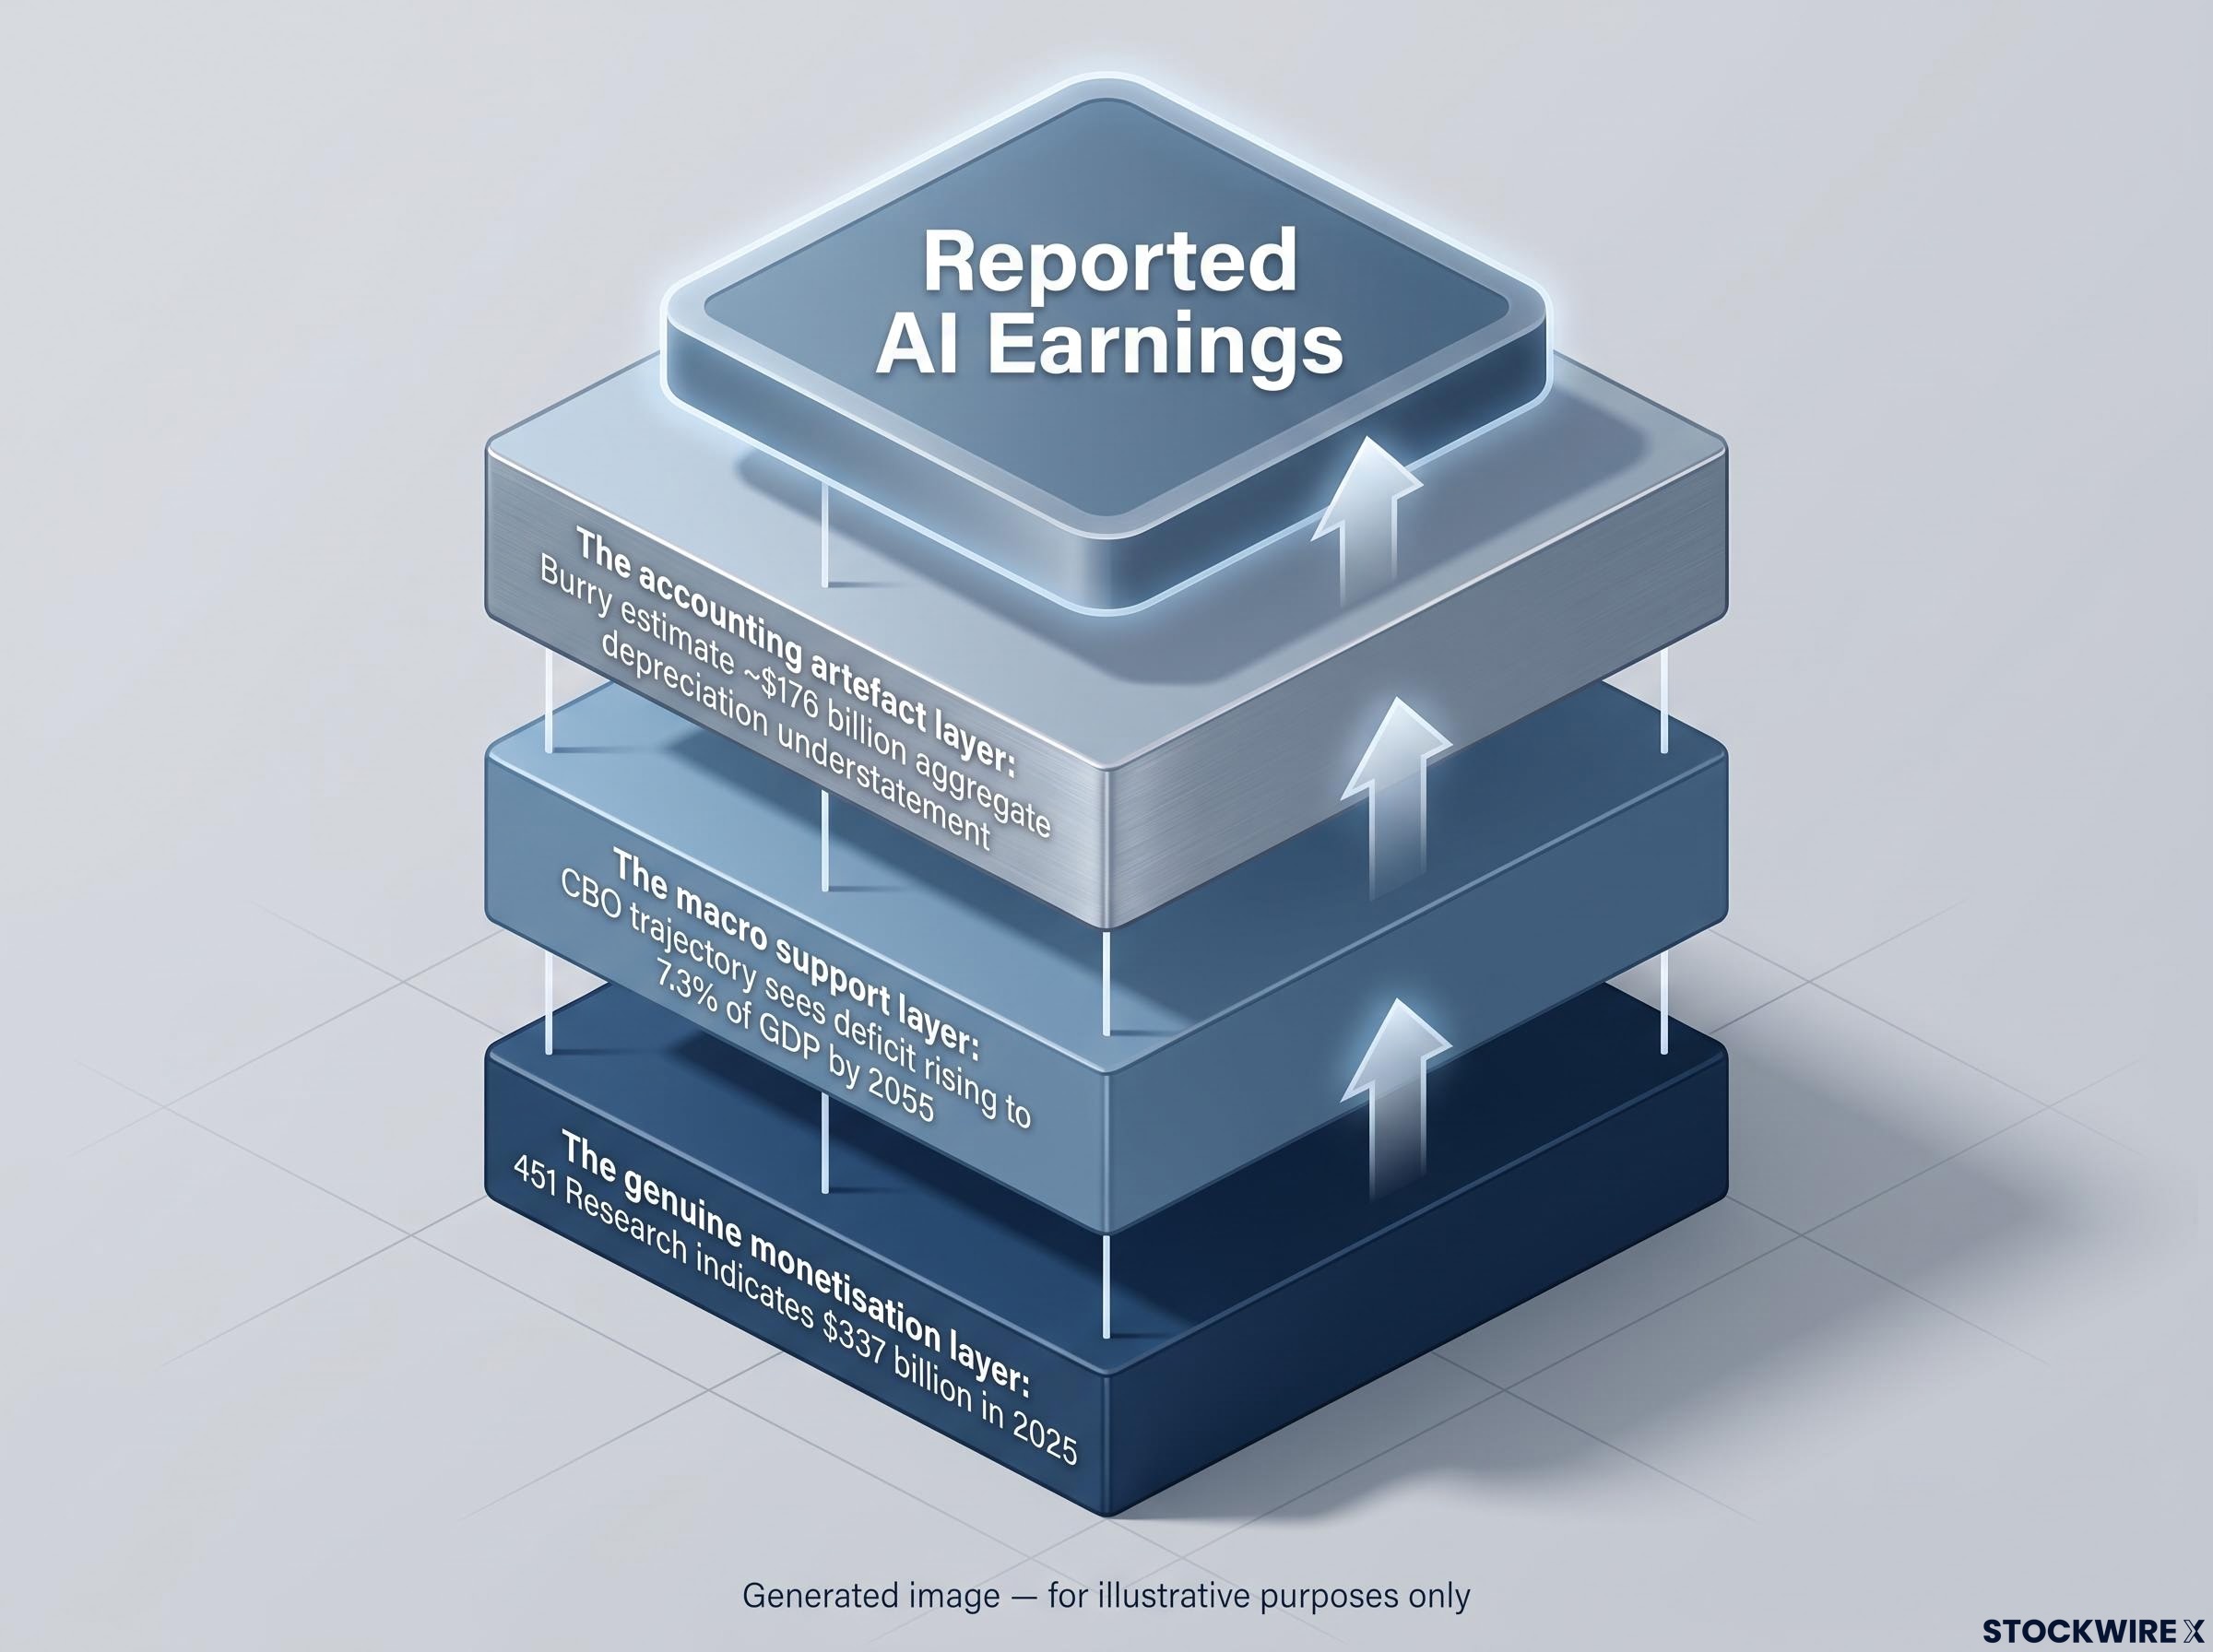
Pull the threads together and reported AI earnings resolve into three distinct layers. Being able to name them is the whole point:
- The accounting artefact layer: depreciation understatement, estimated by Burry at roughly $176 billion aggregate, inflating current net income.
- The macro support layer: deficit-financed demand, tied to profits by Research Affiliates’ near one-for-one relationship, sensitive to a deficit trajectory the CBO sees rising to 7.3% of GDP by 2055.
- The genuine monetisation layer: the real, growing revenue base, $337 billion in 2025 per 451 Research, which should be measured from, not dismissed.
The honest question is not whether AI earnings are real. It is what share of the reported figure survives a normalisation of deficits and a reset of depreciation assumptions. That share is almost certainly lower than current headlines imply.
Corporate profit margin dynamics in the current cycle are further complicated by a structural transfer of income from labour to capital that Grantham identifies as among capitalism’s most mean-reverting series; a reversal driven by antitrust action, higher corporate taxes, or labour-market reform would compress the genuine monetisation layer of AI earnings independently of any depreciation or deficit adjustment.
Here are the three variables worth tracking:
- Deficit trajectory: a narrowing deficit or a recession-driven revenue collapse signals the macro profit support is fading.
- Hyperscaler capex guidance: a downward revision, especially against Amazon’s stated $200-220 billion 2026 pace, is the earliest visible sign of reversal.
- GPU depreciation disclosures: any move to shorten useful-life assumptions would confirm the two-to-three-year obsolescence thesis, with earnings headwinds likely surfacing in the 2028-2030 window.
Watch capex intensity, currently around 34% of revenue, as the single ratio that ties them together.
This article is for informational purposes only and should not be considered financial advice. Investors should conduct their own research and consult with financial professionals before making investment decisions. Past performance does not guarantee future results, and the projections discussed here are speculative and subject to change based on market developments and company performance.