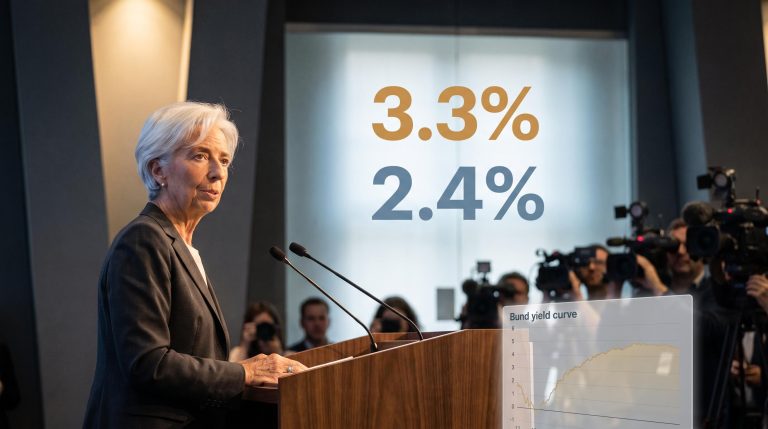
Most explanations for today’s record equity valuations point to technology and skilled management. That story is incomplete, and the missing piece matters more than the one everyone repeats.
Underneath the surface sits a historically extreme divergence: corporate profits are capturing the largest share of national income since just after the Second World War, while the slice flowing to workers has shrunk to lows not seen in the post-war era. This is the real engine behind current earnings, and it is not obviously permanent.
Here is the framework for understanding how this K-shaped imbalance, meaning gains concentrating sharply at the top while the base stagnates, quietly supports elevated equity prices, and what could trigger a violent mean reversion in the corporate profit margins your portfolio depends on.
Measuring the modern profit peak against historical extremes
Start with the raw numbers, because they are more extreme than most investors realise.
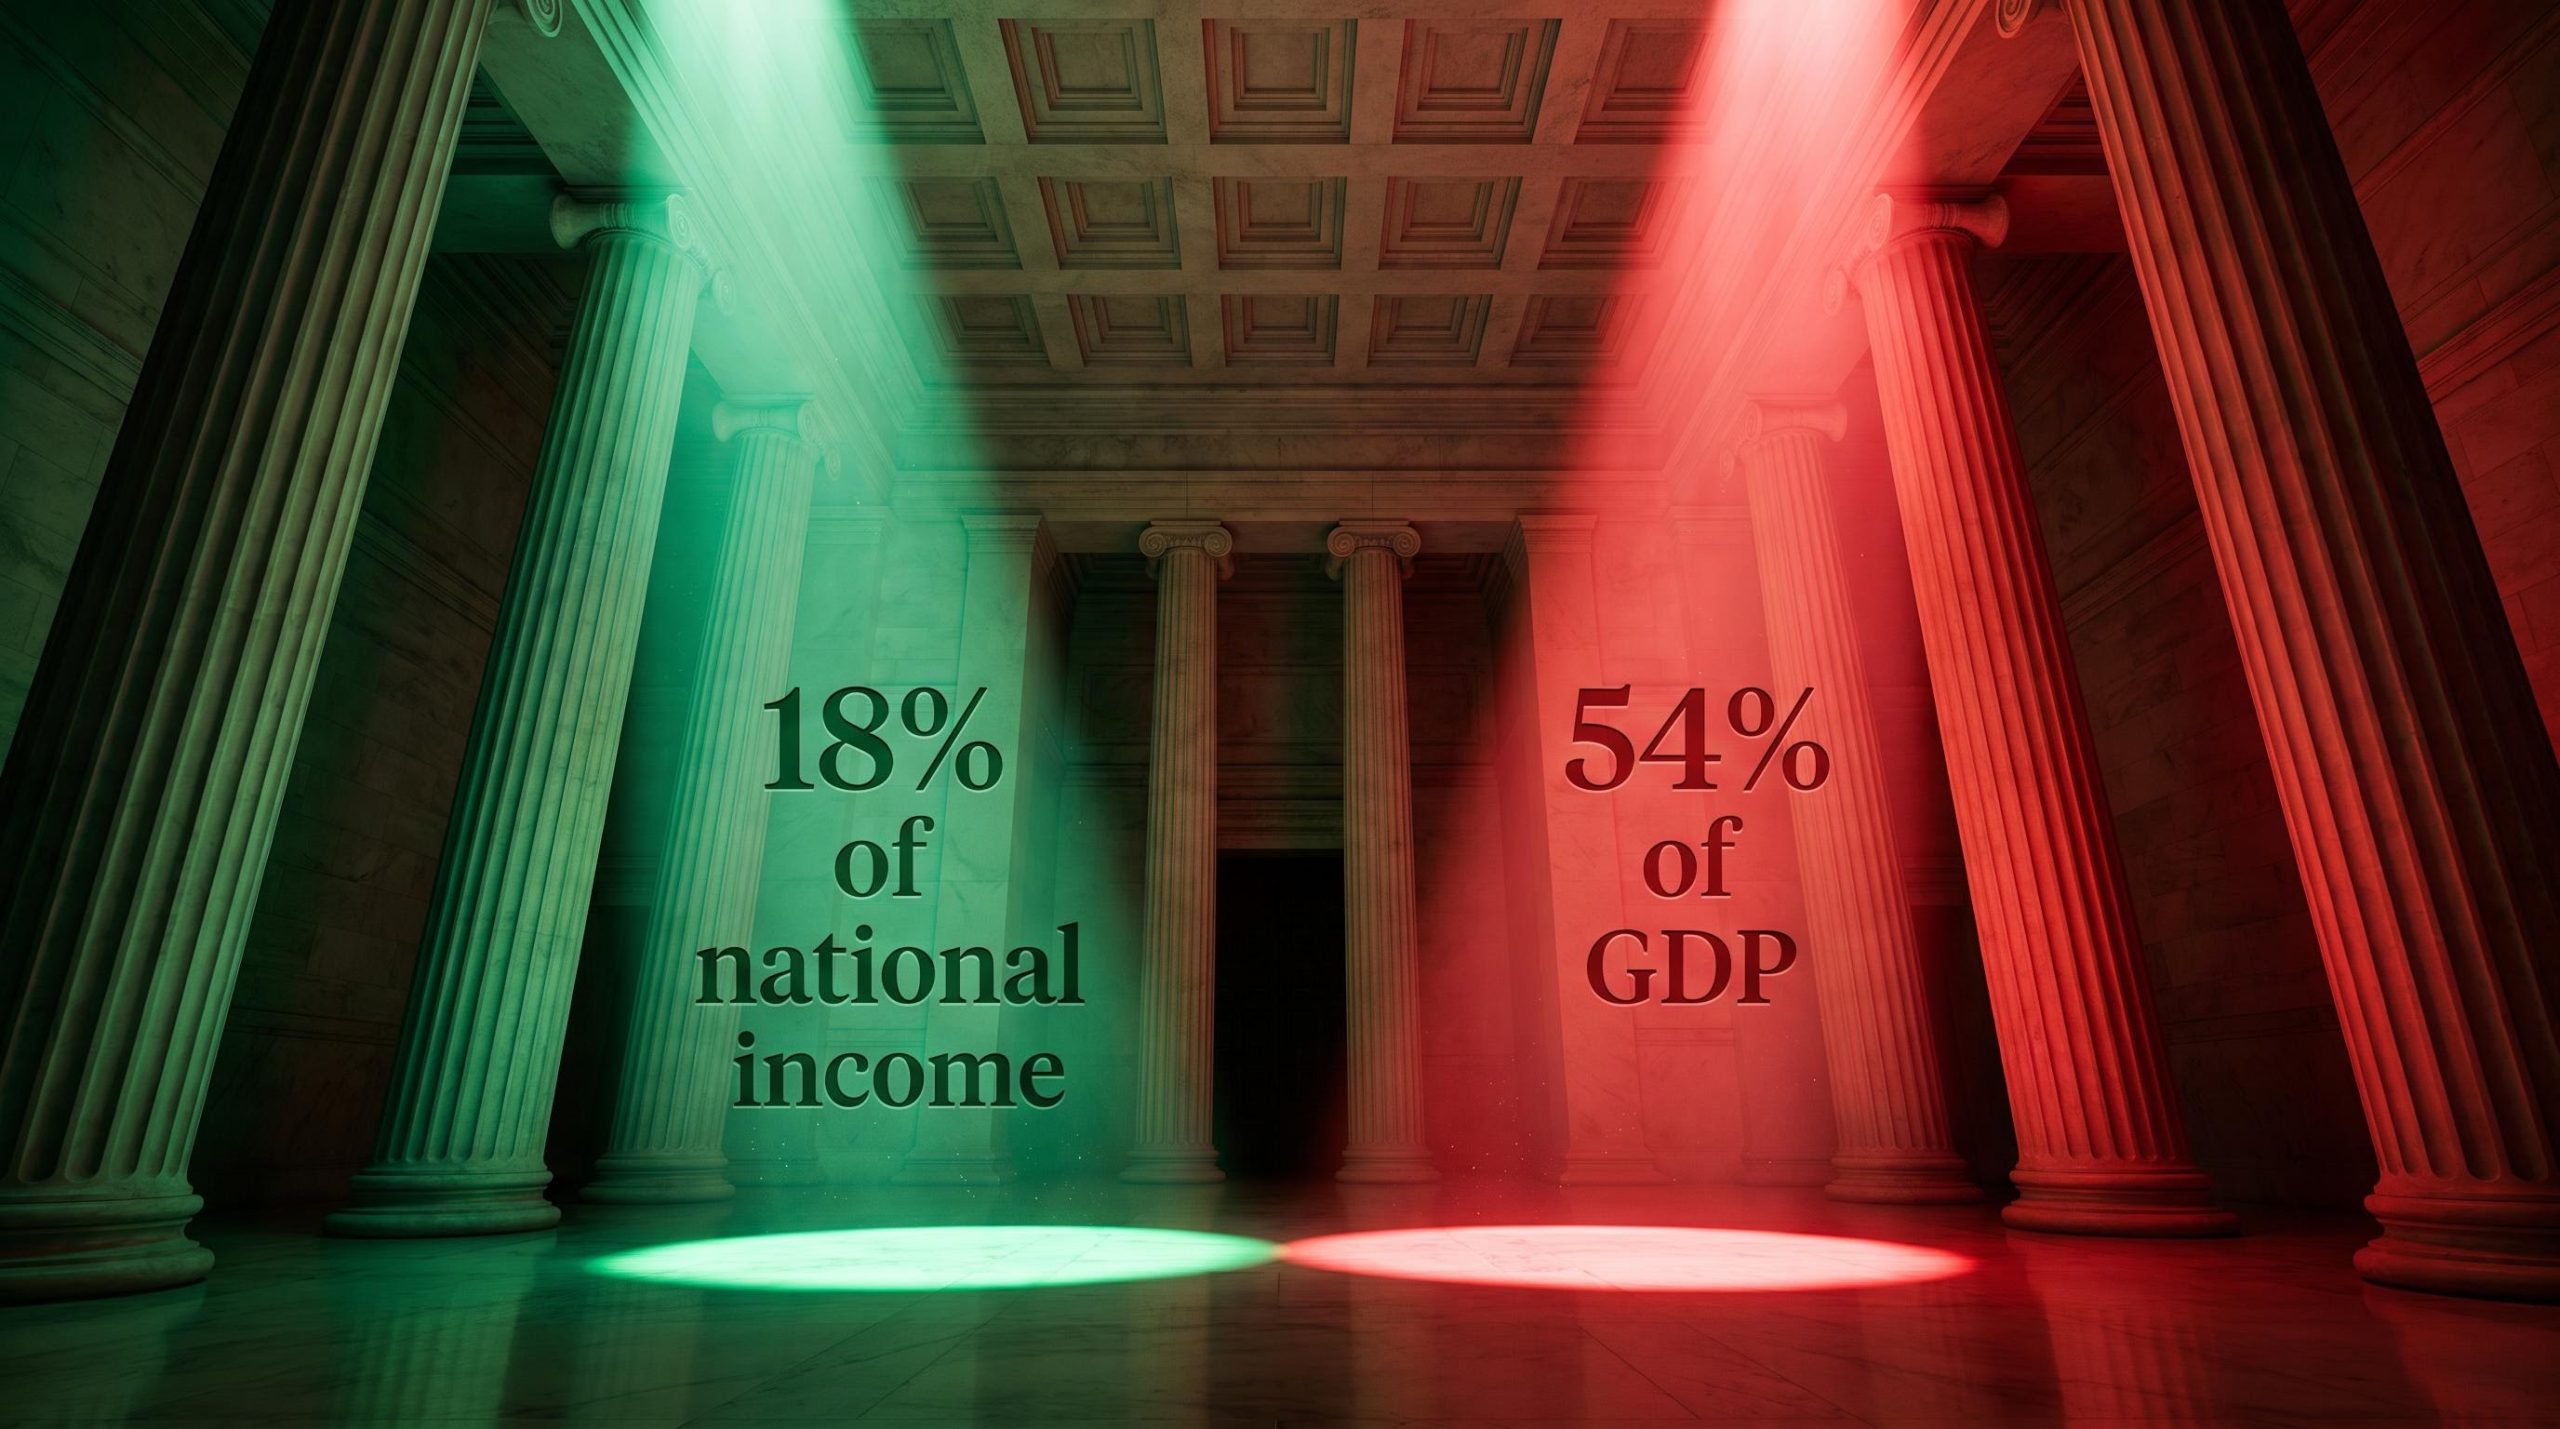
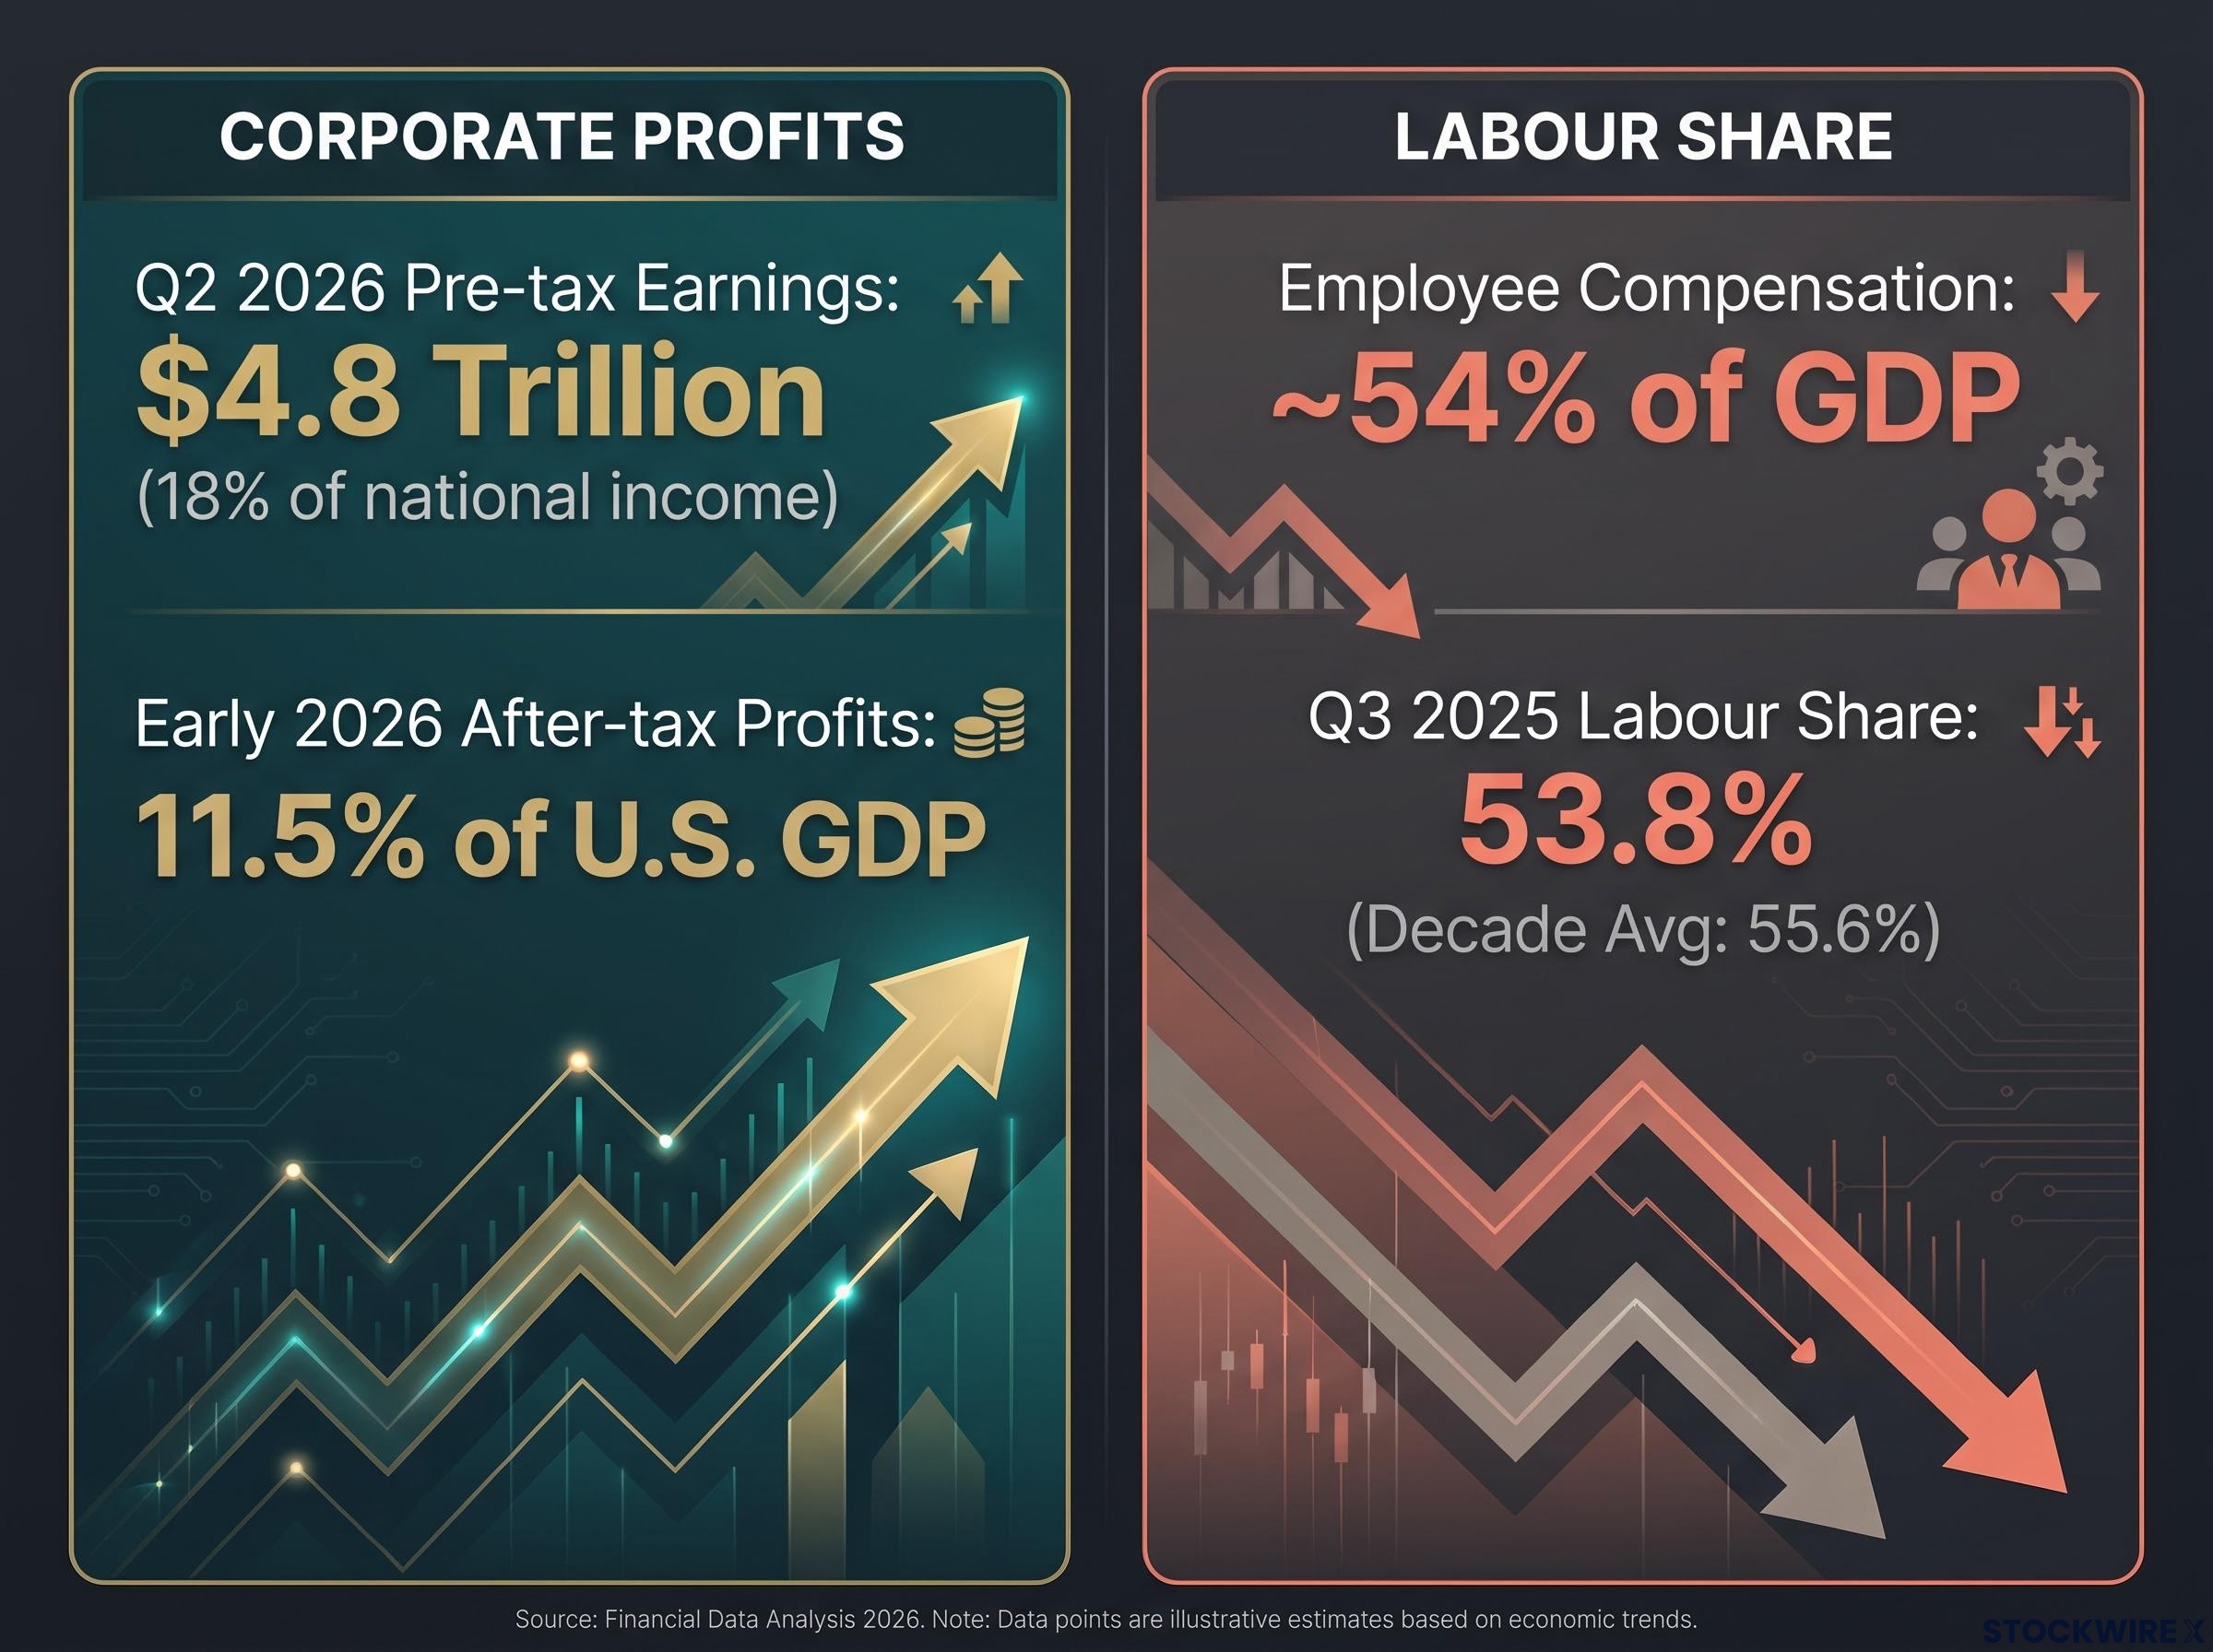
Bureau of Economic Analysis (BEA) data for Q2 2026, relayed through the Financial Times and reproduced by Moneycontrol, shows U.S. pre-tax corporate earnings reached an annualised $4.8 trillion, equal to roughly 18% of national income. That is the highest profit share since the years immediately following the Second World War.
The BEA’s Q2 2026 corporate profits release confirms profits from current production rose by $400.9 billion in the second quarter, providing the primary data series from which the record 18% profit share of national income is derived.
On an after-tax basis, the picture is just as stark. Moneycontrol’s June 2026 analysis of BEA figures put after-tax corporate profits at approximately 11.5% of U.S. GDP in early 2026, a record for that series.
Record profit margins at 14.4% of nonfinancial GDP in Q1 2026 represent the highest reading during any post-recession expansion since 1929, yet the data also shows this figure sits within the post-2021 structural band of 13-16%, meaning the absolute level alone does not determine when compression arrives.
Now the other side of the ledger. Employee compensation has moved the opposite direction, falling to roughly 54% of GDP, the lowest since records began in 1948.
The productivity data confirms it. Fortune, citing the Bureau of Labor Statistics (BLS) report released in January 2026, notes the labour share of economic output fell to 53.8% in Q3 2025, the lowest reading since that series started in 1947. The decade average was 55.6%.
J.P. Morgan Asset Management framed the current backdrop directly in its July 2026 note, “A Top Down View of the Earnings Surge,” describing an earnings environment built on historically elevated margins.
Adjusted after-tax profits of all U.S. corporations reached $3.624 trillion at an annual rate in Q1 2026, equal to 11.4% of GDP, while worker compensation’s share of GDP declined from 55.7% to 50.5% over a longer comparison window. J.P. Morgan Asset Management, July 2026
This divergence is the foundation that current valuations rest on. Forward earnings multiples assume today’s margins are a stable baseline, not a peak.
That assumption is the risk. When the profit share and the labour share both sit at post-war extremes, the baseline earnings supporting your long-term equity holdings are perched at the top of the cycle. Any return toward historical averages would not be a mild adjustment; it would be a severe valuation shock delivered straight to the multiples you paid.
When big ASX news breaks, our subscribers know first
Understanding the mechanics of a K-shaped distribution
Why has this gap opened so wide? The divergence is not an accident of the business cycle. It is the output of three structural forces working in the same direction for decades.
The first is capital-biased technological change. International Monetary Fund (IMF) research, including work by Dao, Das, Koczan and Lian on the labour share in advanced economies, identifies automation and information and communication technologies as a primary driver. These technologies substitute for routine tasks, meaning work that follows predictable steps, and raise the return to capital and high-skill workers far more than to the average employee.
The second is globalisation. IMF and OECD analyses attribute part of the decline to offshoring and global supply chains, which let firms arbitrage labour costs across borders. The ability to source mid-skill work anywhere weakens domestic bargaining power and shifts income toward capital and multinational profits.
The third is market concentration. Research by Jan De Loecker, Thomas Philippon and others documents rising markups, meaning the gap between price and cost, across sectors. Dominant firms capture productivity gains as profit rather than passing them to workers or consumers.
The three mechanisms, summarised:
- Technological change: Automation substitutes routine labour while rewarding capital owners disproportionately.
- Globalisation: Supply chain arbitrage and offshoring erode wage growth and collective bargaining power.
- Market concentration: Dominant firms convert productivity gains into markups rather than higher wages.
Political economists including Thomas Piketty, Emmanuel Saez and Gabriel Zucman add a fourth layer: institutional change. Declining unionisation, tax regimes favouring capital income, and a governance culture prioritising buybacks over wages have entrenched shareholder primacy.
Shareholder primacy, the capital allocation doctrine embedded through stock-based executive compensation and activist fund pressure since Milton Friedman’s 1970 formulation, is one of the institutional mechanisms reinforcing the profit-over-wages equilibrium; S&P 500 companies repurchased a record $942.5 billion in shares in 2024 alone, a capital outflow that compounds the divergence between labour and capital income.
This matters for how you read your own returns. The margin expansion lifting your portfolio is not a law of physics. It is a measurable transfer of income from labour to capital, which forces a harder question: has that transfer reached its political and social limit?
How superstar firms distort the aggregate data
David Autor and co-authors describe part of the mechanism through what they call superstar firms.
These are highly productive companies built on scalable intangible assets, meaning software, data and brand rather than factories and headcount. Because they generate enormous output with relatively few workers, their rise concentrates profit in a handful of names.
That concentration drags down the labour share for the entire economy. When a small group of mega-caps captures a growing share of total profit while employing comparatively few people, the aggregate figures shift even if wages elsewhere hold steady. The distortion you see in national data is partly the shadow these firms cast.
The trillion-dollar AI concentration amplifying the trend
Nowhere is the capital-over-labour story more concentrated than in private AI markets, and the parallels to past manias are hard to ignore.
Reuters reported on 28 May 2026 that Anthropic raised $65 billion in a Series H round at a post-money valuation of $965 billion, more than doubling from an estimated $380 billion in February 2026. CNBC confirmed the round the same day, naming Altimeter Capital, Dragoneer, Greenoaks and Sequoia Capital among lead investors. The valuation made Anthropic the world’s most valuable AI startup, ahead of OpenAI.
Secondary markets pushed further. The New York Post, citing trading-platform data from Hiive on 23 April 2026, reported an implied Anthropic valuation of roughly $1 trillion between primary rounds. The gap between primary financing terms and secondary pricing is itself a symptom of capital misallocation.
OpenAI’s numbers show the same pattern. A Luminix analysis from April 2026 describes OpenAI at a valuation of approximately $852 billion on around $25 billion of revenue and $14 billion in losses, implying a revenue multiple near 34x.
| Company | Primary Valuation | Date | Est. Revenue | Revenue Multiple |
|---|---|---|---|---|
| Anthropic | $965B | May 2026 | Not disclosed | Not disclosed |
| OpenAI | $852B | March 2026 | ~$25B | ~34x |
The comparison to the late-1990s dot-com bubble is real but imperfect. Today’s leading AI firms have genuine products and revenue, unlike many pre-2000 startups with negligible sales. Yet the concentrated leadership, narrative-driven inflows and multiples priced for flawless execution echo earlier cycles.
Historical bubble frameworks including Minsky, Kindleberger and Shiller CAPE deliver split verdicts on the current AI cycle: the Shiller CAPE at 40.11 in May 2026 sits at levels reached only at the dot-com peak, yet the 740% surge in AI bubble mentions on corporate earnings calls in Q4 2025 may itself be a counter-signal, since genuine manias are typically characterised by the absence of widespread risk acknowledgment.
Those revenue multiples carry a warning. Peak margin assumptions are already priced perfectly into the AI story, which means your capital faces steep downside if these firms meet even minor competitive or regulatory friction.
The regulatory and political tripwires threatening elevated margins
Extreme margins do not stay extreme quietly. Jeremy Grantham has long argued that profit margins are among the most mean-reverting series in all of capitalism, meaning they tend to pull back toward their long-run average over time. Record highs, in his framing, actively invite the competition and scrutiny that compress them.
The mechanism for reversion is often political. Piketty and colleagues frame the current gap between capital and labour incomes as socially destabilising, raising the likelihood of stronger taxation, regulation and redistribution as the divergence persists.
Governments have concrete tools to redistribute income from capital back to labour. Ranked by directness of impact on margins:
- Antitrust enforcement: Break-ups, acquisition limits and self-preferencing restrictions targeting dominant technology, healthcare and finance firms.
- Sector-specific regulation: Rules on AI deployment, data privacy, and pricing in utilities and healthcare that cap margins directly.
- Tax policy: Higher corporate rates, minimum global taxation, and windfall-profit taxes on platforms or energy firms.
- Labour-market policies: Stronger unions, higher minimum wages and enhanced worker protections that shift income from profit to pay.
History offers precedent. Analysts point to early 20th-century trust-busting and mid-century regulatory regimes as moments when political coalitions curbed corporate power in response to perceived concentration. Recent antitrust action against digital platforms in the U.S. and EU shows the pattern is live, not theoretical.
This is your practical watchlist. Antitrust developments, tax shifts and unionisation drives are not distant political theatre; they are direct catalysts capable of repricing the assets you already own, and monitoring them is how you move before the market does.
Positioning portfolios for a potential structural reversion
The core argument is simple. Record profit shares and record-low labour shares describe an unstable equilibrium, not a permanent new era, and unstable equilibria eventually correct.
That does not demand panic selling. It demands stress-testing. The question to ask of every holding is whether the business survives a margin squeeze, or whether its valuation quietly assumes today’s post-war-peak margins persist forever.
Classifying equity drawdowns as irrational overreactions, temporary setbacks, or structural disruptions before acting is exactly the discipline that margin reversion scenarios demand, because a politically-driven compression of corporate profit shares is structural by definition and requires a different analytical response than a cyclical earnings dip.
Resilience is the frame. Companies with genuine structural moats, pricing power grounded in real advantage rather than temporary concentration, and reasonable multiples are better positioned to absorb political and competitive backlash than high-multiple names priced for perfection.
Where your portfolio leans heavily on the most concentrated, highest-multiple equities, particularly in AI, the case for rebalancing toward durability grows stronger the longer the divergence stretches.
This article is for informational purposes only and should not be considered financial advice. Investors should conduct their own research and consult with financial professionals before making investment decisions.
Past performance does not guarantee future results. Financial projections are subject to market conditions and various risk factors, and forward-looking statements about margin reversion are speculative and subject to change based on market and policy developments.