
A company can post 20% revenue growth, watch its share price climb, and still leave you owning less of it than you did a year ago. No announcement. No scandal. No line item that jumps out of a headline.
The mechanism is share dilution, and it runs quietly in the background of most growth-company investments. Stock-based compensation and new share issuances are routine, legal, and rarely reported in headlines, yet each one shifts a slice of value away from you and toward employees, insiders, and capital markets.
That matters because there is a gap between how fast a company grows and how much of that growth actually reaches each share you hold. After this, you will know exactly where to look in a filing to measure how much of a company’s growth is yours, and how to decide when the dilution is a fair price for the returns you are chasing.
What share dilution actually does to your ownership stake
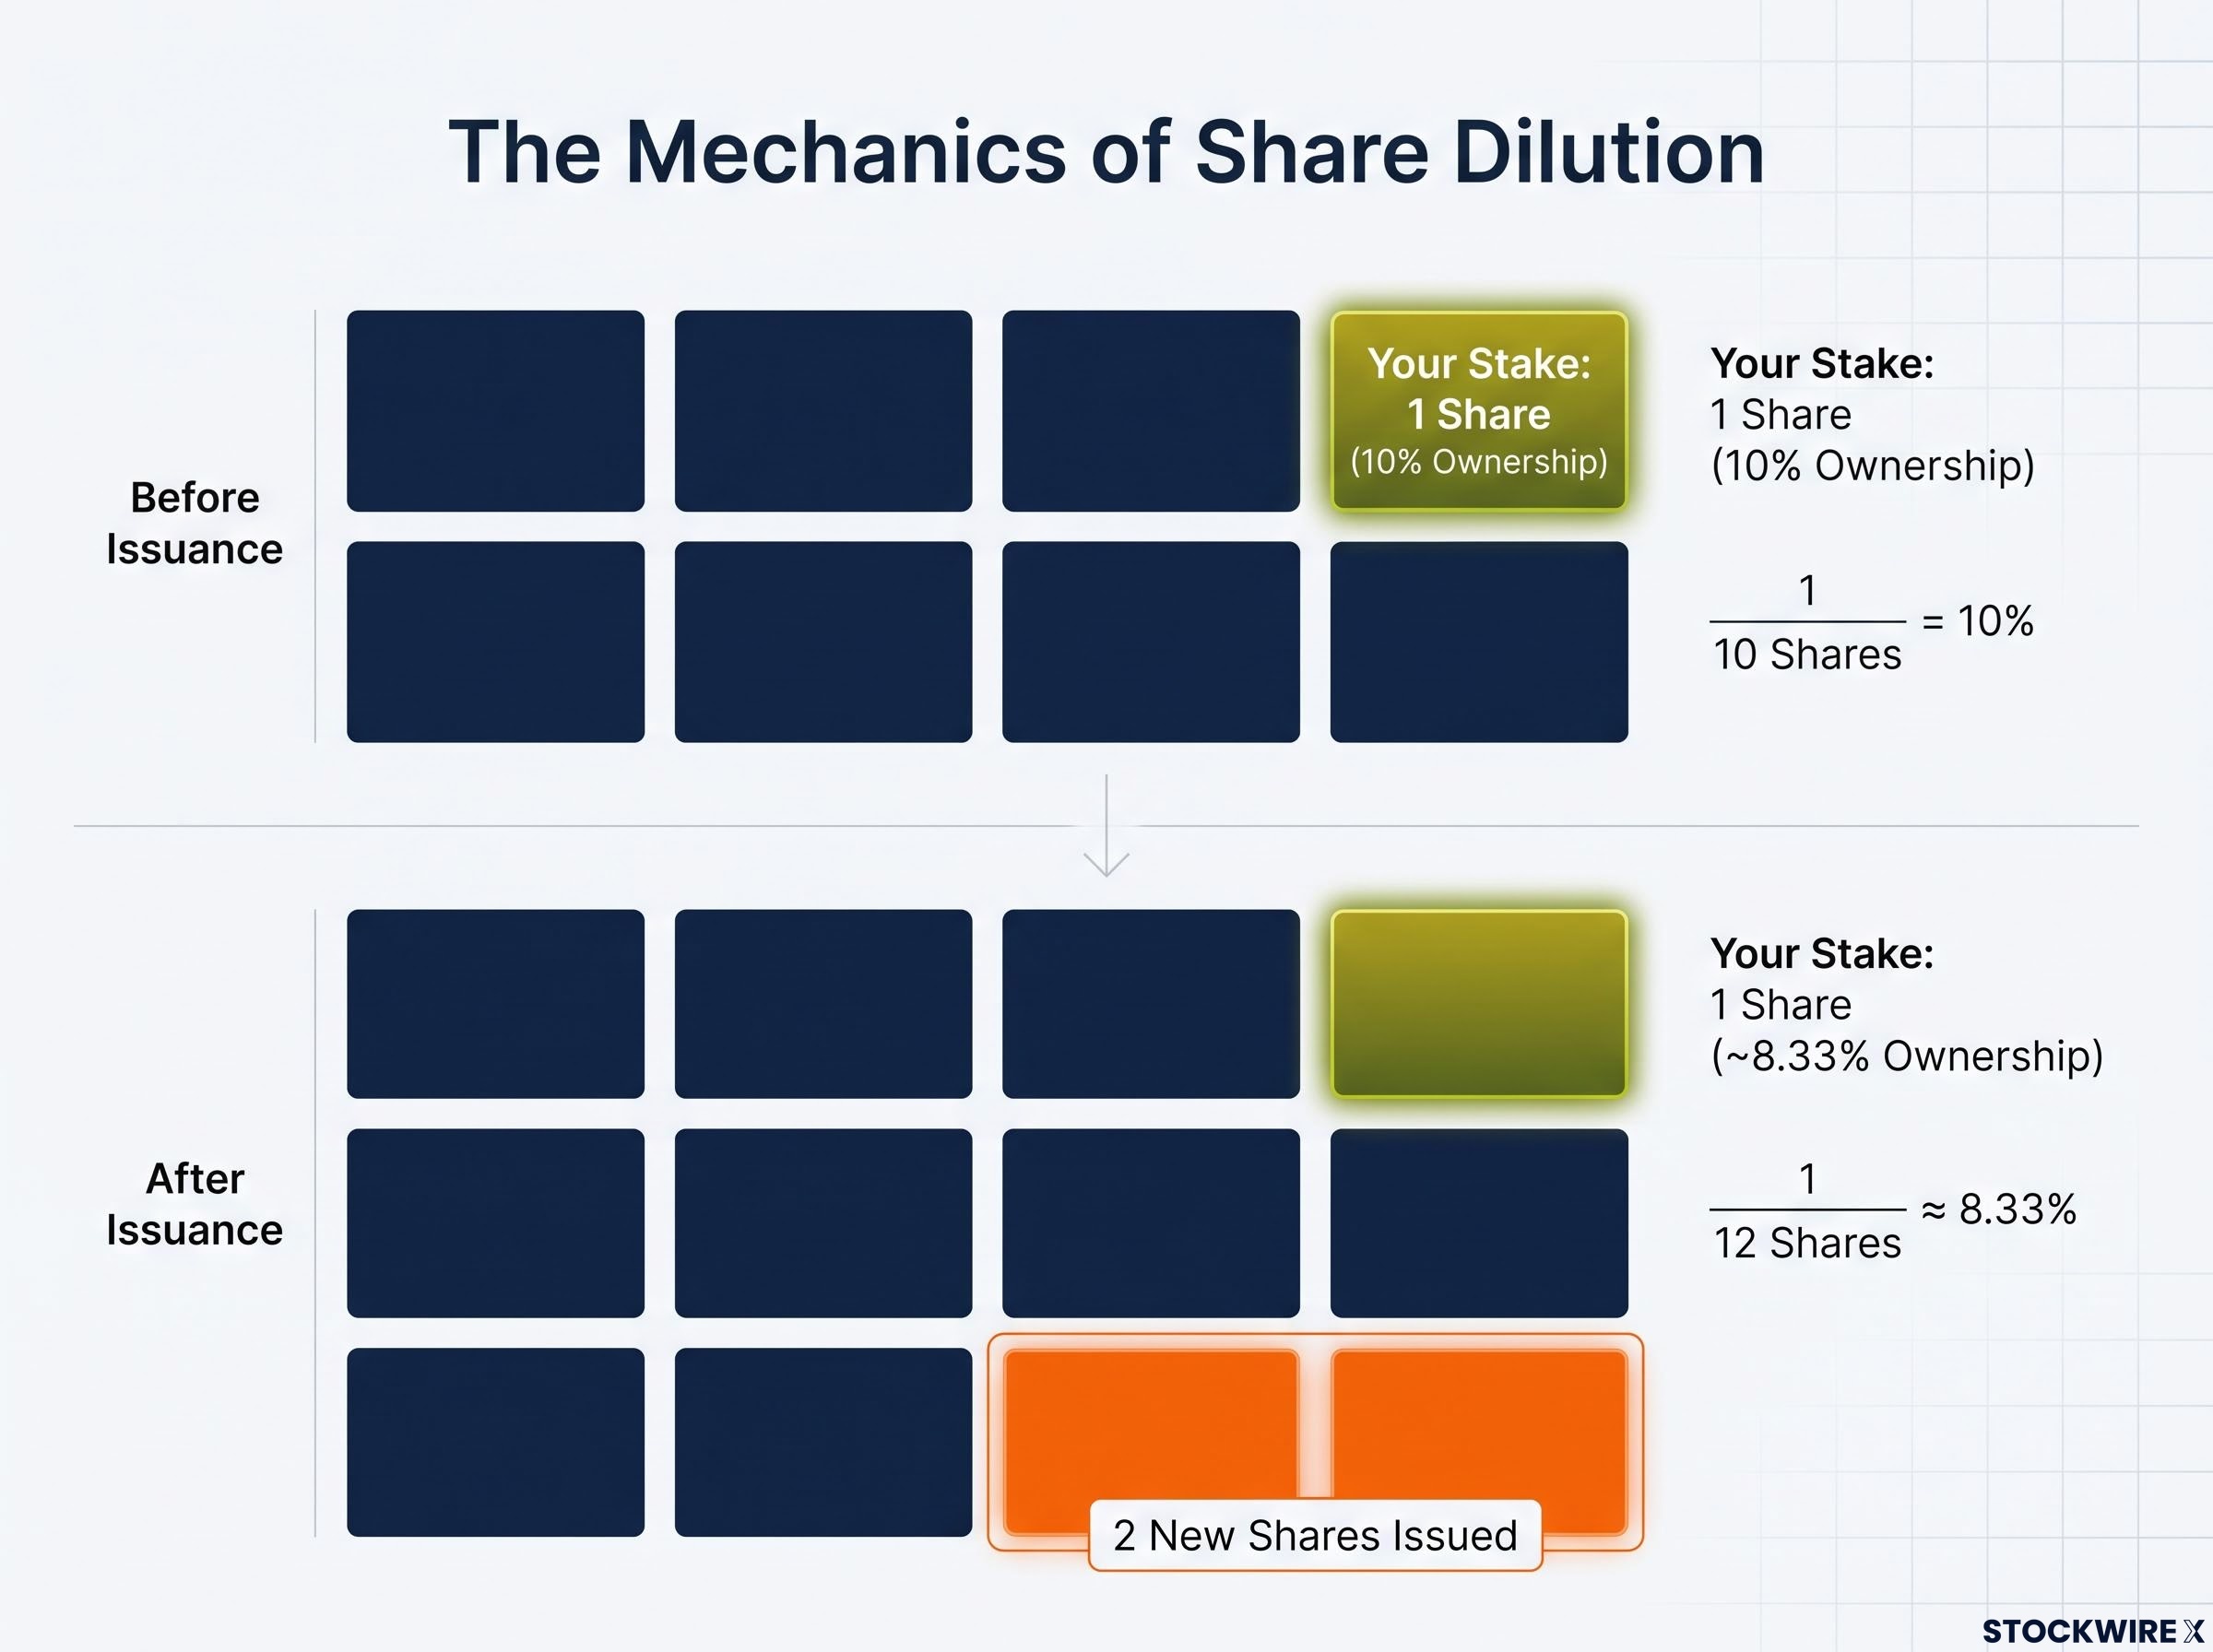
Start with the simplest version of ownership. If you hold 1 share out of 10 in existence, you own 10% of the company. Every dollar of profit, every dollar of net assets, one-tenth of it has your name on it.
Now the company issues 2 new shares. There are 12 in existence, but you still hold only your original one. Your slice has quietly fallen to roughly 8.33%, and you did nothing to cause it.
| Scenario | Your ownership % |
|---|---|
| Before issuance (1 of 10 shares) | 10% |
| After issuance (1 of 12 shares) | ~8.33% |
Morgan Stanley puts the same idea into a formula: dilution equals one minus the ratio of pre-issuance shares to post-issuance shares. That is the arithmetic behind the number. The intuition is simpler still: more slices, smaller slice.
How dilution flows into your per-share returns
Once you accept the slice model, the effect on the numbers you rely on becomes obvious. Three per-share metrics take the hit: earnings per share (EPS), free cash flow (FCF) per share, and book value per share. Each one is a company total divided by the share count, so when the share count grows faster than the total, the per-share figure falls.
The clearest way to see it is EPS. The CFA curriculum defines two versions.
Basic EPS = (Net income minus preferred dividends) ÷ weighted average common shares outstanding
Diluted EPS = (Net income minus preferred dividends) ÷ (weighted average shares plus shares from conversion or exercisable options)
Diluted EPS is the honest number for you as a shareholder. It assumes every stock option, warrant, and convertible security that could turn into shares actually does, giving you the worst-case picture of how many hands the profit will eventually be split across.
Here is why it matters. Imagine net income grows a healthy 20%, but diluted share count grows 30% because of stock-based compensation and new issuance. Total earnings rose, yet diluted EPS fell, because your claim on those earnings shrank faster than the earnings expanded.
That is the whole point of this section. Total company growth and per-share growth are two different things, and if you only track total revenue you are measuring the wrong variable for your own outcome. One more habit worth building: watch the gap between basic and diluted EPS over time. When that gap widens year after year, dilution pressure is quietly building underneath the reported numbers.
When big ASX news breaks, our subscribers know first
Where growth-stage companies hide the dilution cost
The cost is not hidden in the sense of being concealed. It is hidden in plain sight, in a metric most analysts and financial media quote by default.
Stock-based compensation (SBC) is classified as a non-cash expense. No cash leaves the building when a company pays staff in shares, so companies routinely add it back when calculating non-GAAP, or adjusted, earnings. The result is a metric that looks more profitable precisely because it has stripped out the cost that comes directly out of your ownership stake.
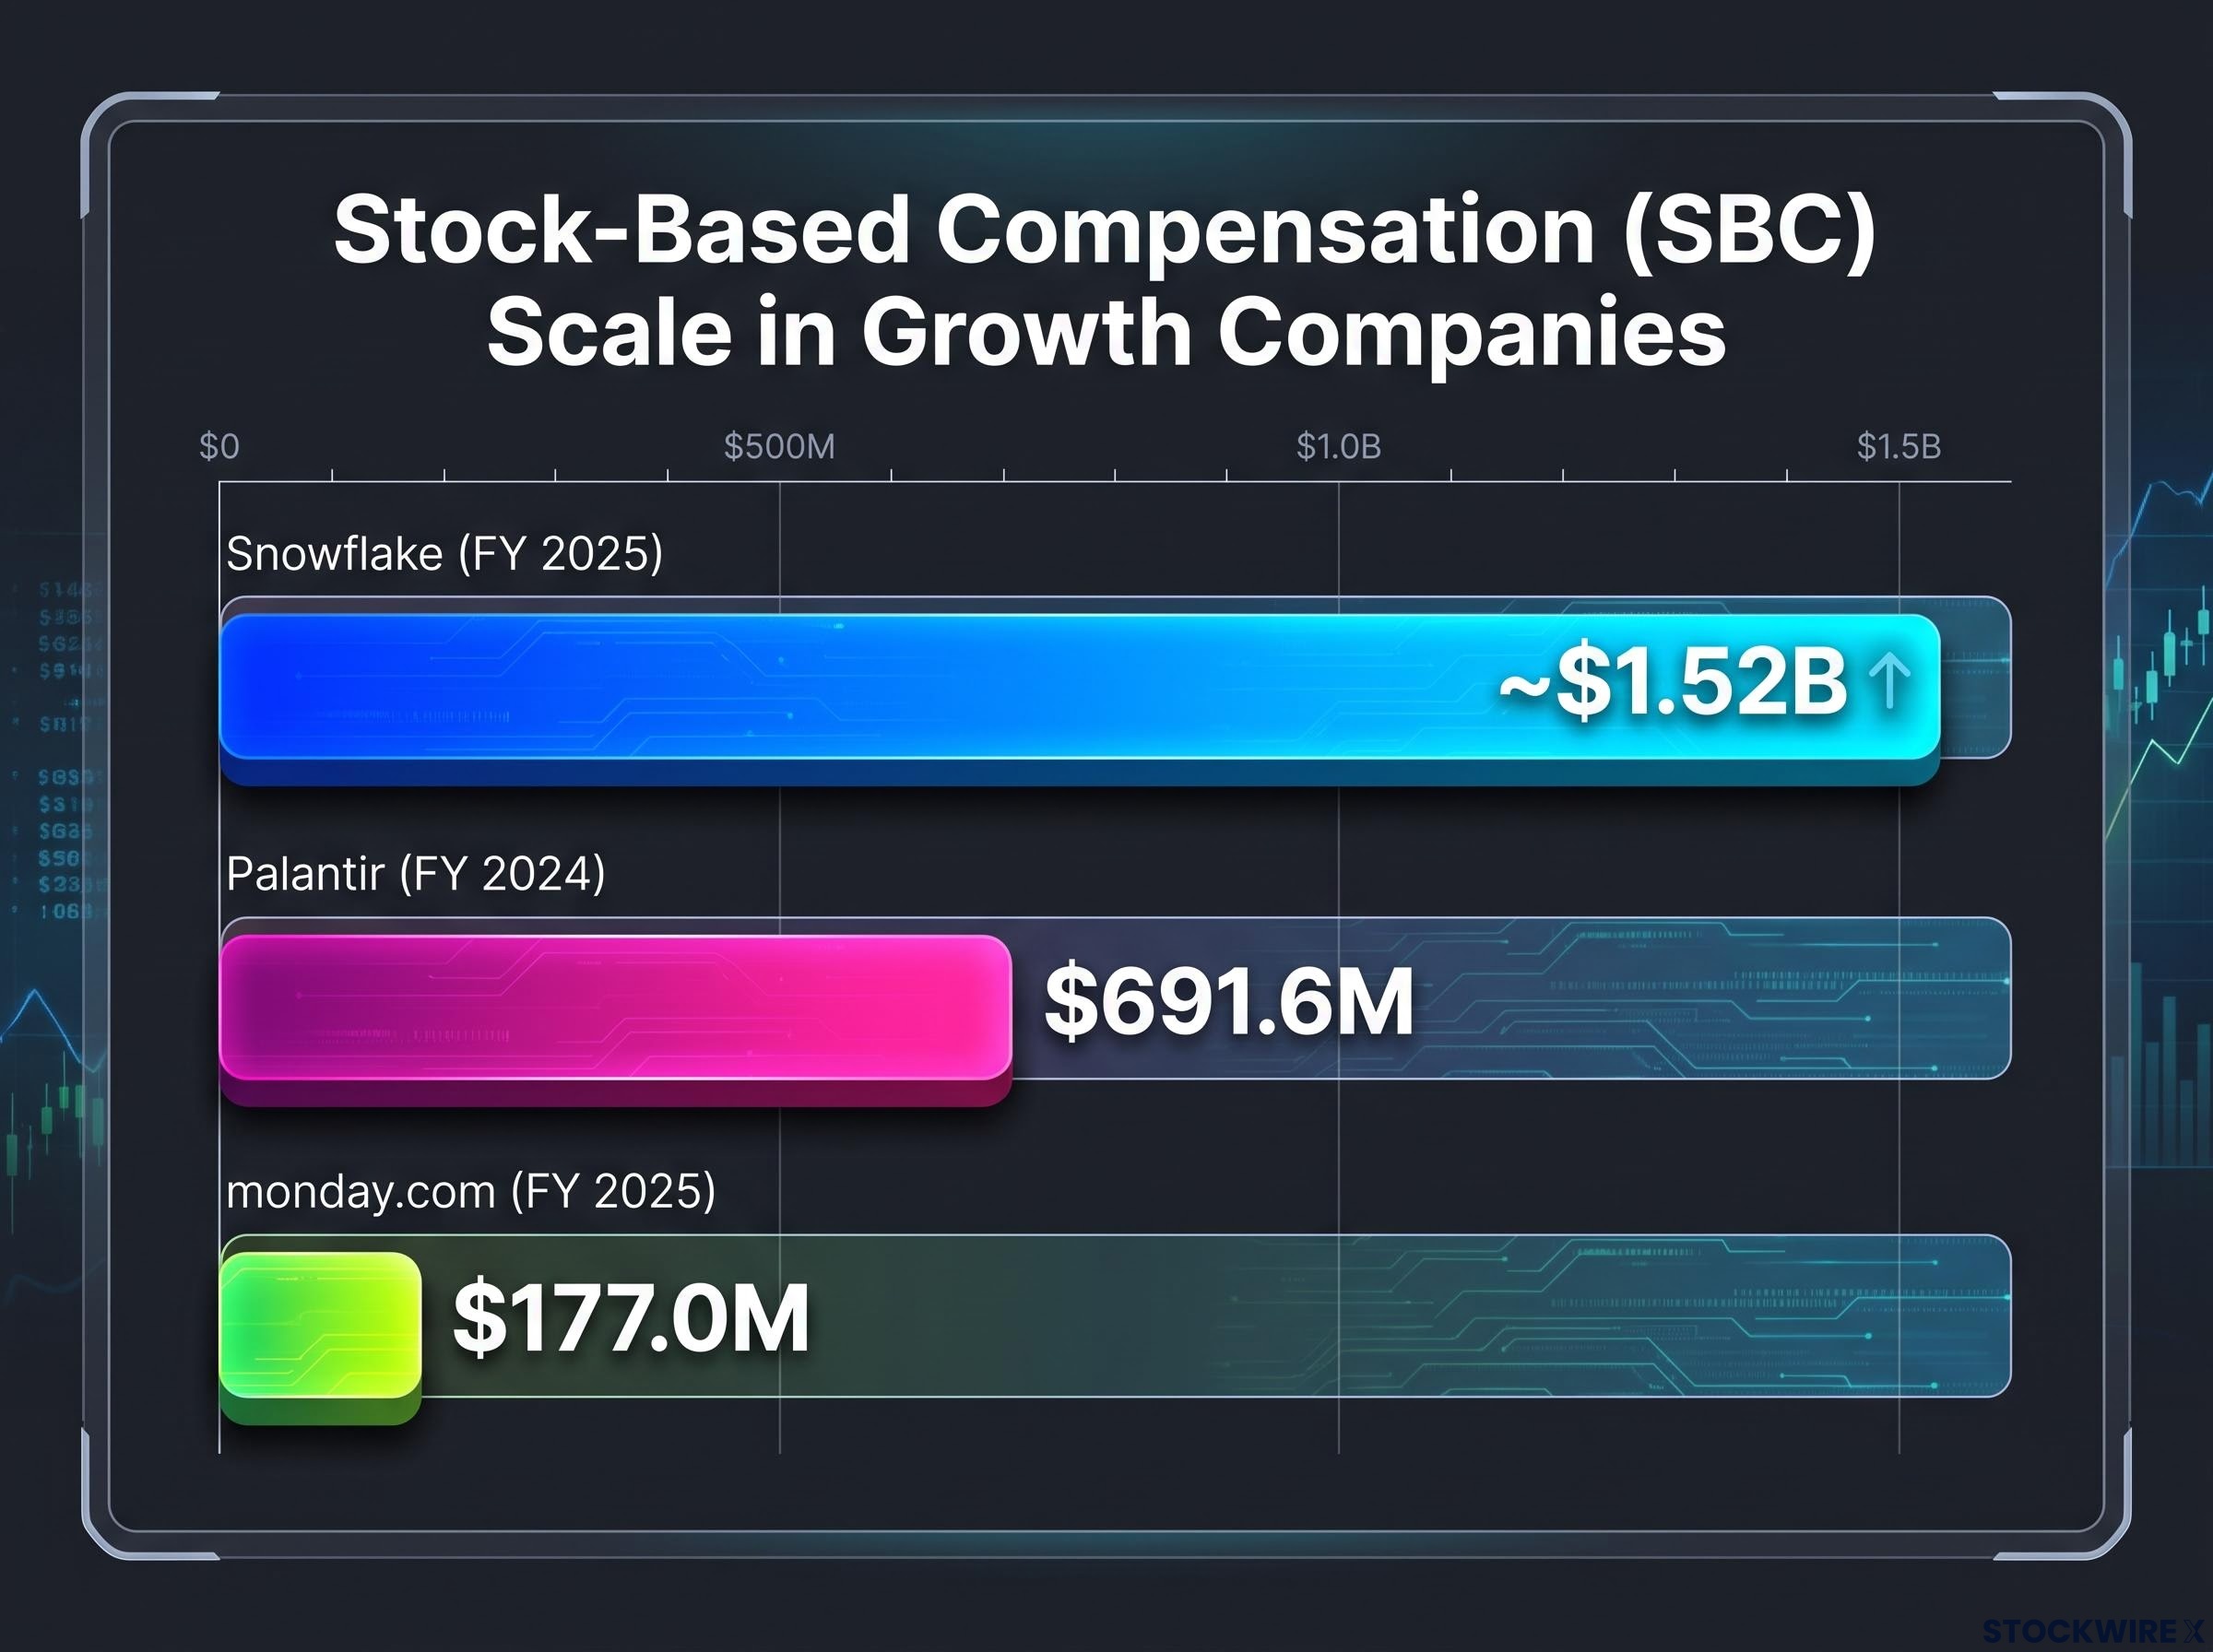
The dollar figures involved are not trivial. Three growth-stage names make the scale concrete.
| Company | Period | SBC amount | Revenue context |
|---|---|---|---|
| Palantir | FY 2024 | $691.6M (up 45% YoY) | Large share of value created |
| Snowflake | FY 2025 (to 31 Jan 2025) | ~$1.52B total | ~$3.5B-$4.7B revenue |
| monday.com | FY 2025 | $177.0M (up from $129.2M) | Rising each year |
Palantir’s Form 10-K for the year ended 31 December 2024 reports total SBC of $691.6 million, up 45% from $475.9 million the year before. Snowflake’s 10-K for the fiscal year ended 31 January 2025 reports total SBC of roughly $1.52 billion against revenue in the region of $3.5-$4.7 billion. monday.com’s FY 2025 results, released on 9 February 2026, show SBC of $177.0 million.
Why do young companies carry so much more of this than mature ones? They use equity to attract talent they cannot afford to pay in cash, and they rarely run buybacks large enough to mop up the shares they issue. Nothing offsets the dilution.
Morgan Stanley notes that ongoing shareholders realise more dilution with young companies than with mature ones, because SBC is more significant for young firms and their buybacks are modest.
Candor’s advisory commentary estimates that SBC dilution averages somewhere between 0.2% and 8.6% per year across public companies, describing it as a hidden cost that erodes shareholder value when it goes unmanaged. Treat that as a broad range rather than a precise figure, but the upper end alone should get your attention.
Three things keep this cost underappreciated:
- Investors rely on non-GAAP metrics that add SBC back, so the cost never appears in the headline number
- Attention goes to total growth, revenue and total earnings, rather than per-share fundamentals
- The disclosures sit in footnotes and equity award tables that most people never open
Put simply, when a company you own reports non-GAAP earnings that add SBC back, you are looking at a number that makes the business appear more profitable than it is for you. That is the reason to go past the headline and open the GAAP income statement and cash flow statement.
GAAP versus non-GAAP gaps are among the most consequential blind spots in growth-company analysis, because SBC is excluded from adjusted figures by nearly every major technology company, turning a real recurring cost into an invisible line that most headline readers never see.
How to read a filing for dilution risk before you invest
Knowing the cost exists is one thing. Finding it in a document that runs to hundreds of pages is another. Here is an ordered sequence you can run on your next company deep-dive, working through a 10-K (US annual filing) or 20-F (foreign issuer annual filing) from the front to the footnotes.
- Open the income statement. Find the SBC line and note the figure. If it is buried, check the cash flow statement, where SBC is added back near the top.
- Track the trend. Compare this year’s SBC to the last two or three years and against revenue growth over the same period.
- Find the equity compensation tables. These list total outstanding options and restricted stock units (RSUs), which tell you the potential fully diluted share count if everything vests.
- Compare basic and diluted EPS. A widening gap over time is a live warning signal.
- Read the buyback disclosures. Note the dollar value of shares repurchased during the year.
Andrew Sather, a financial analyst who writes on the subject, identifies the core diagnostic test in step two.
When diluted share count climbs year over year without matching growth in revenue and free cash flow, dilution is degrading per-share value even as the business appears to expand.
That is the single comparison worth memorising. DilutionWatch adds a related red flag for smaller companies: option and RSU overhang running at 20-30% of the float can materially erode your stake once those awards vest.
The buyback offset test: does the company actually reduce your dilution?
Buybacks are the counterweight to SBC. The net dilution calculation is simple: shares issued through SBC minus shares repurchased gives the net change in share count from these two forces. If SBC dollars consistently exceed buyback dollars, your net share count is rising, no matter what the capital-return press release says.
The scale of buybacks in large caps is enormous. S&P Dow Jones Indices data released on 18 December 2025 shows S&P 500 repurchases hit a quarterly record of $293.5 billion in Q1 2025, up 23.9% on Q1 2024, with $999.2 billion bought back over the 12 months to March 2025. Global buybacks reached $1.46 trillion in 2025, with the United States accounting for roughly 71%, about $1.04 trillion.
But that capacity is concentrated at the top. In Q2 2025, the top-20 S&P 500 issuers alone made up 51.3% of all buyback activity. Growth-stage companies are not in that group.
So for most growth names you evaluate, the buyback-versus-SBC comparison will show SBC winning. That means the company is not returning capital to you net of dilution, whatever the announcement claims. monday.com is the useful contrast: it has been reducing its share count through buybacks, a rarity among growth SaaS. One caveat holds even for the buyers: repurchases made at inflated valuations do not preserve per-share value, because the capital is being deployed inefficiently even as the share count falls.
Share buyback mechanics extend beyond dilution offset: when a company cancels repurchased shares outright rather than holding them as treasury stock, the per-share earnings claims of remaining holders are permanently lifted, which is why the structure of a buyback programme matters as much as its dollar size.
When dilution is a fair price to pay for growth
None of this means you should avoid every company that pays in shares. The instinct to treat all dilution as bad is where a lot of investors overcorrect and miss the best returns of the decade.
The test that actually matters is whether the pie is growing faster than the number of slices. If free cash flow per share is expanding even as the share count rises, the dilution is being more than offset by genuine value creation, and it is a trade worth making.
Palantir is the case that forces you to think it through. Its $691.6 million of SBC in FY 2024, up 45% year on year, sits alongside a real inflection in free cash flow. The stock fell from nearly $45 in early 2021 to around $6 at the bottom in late 2022, then recovered, and the recovery was driven by that FCF turn rather than by narrative. Hype drew the initial attention; sustained free cash flow growth drove the appreciation. The same SBC figure can be acceptable or damaging depending entirely on whether fundamentals are outrunning the dilution.
SBC methodology shifts can produce dramatic headline moves that have nothing to do with underlying business performance, as Intuit demonstrated in August 2026 when a change in how the company reported stock-based compensation in non-GAAP figures produced an apparent $5-per-share EPS collapse that partially reversed once analysts clarified the accounting change.
That is why your judgment cannot stop at spotting the SBC number. It has to extend to the rate of fundamental improvement underneath it.
| Acceptable dilution | Value-destructive dilution |
|---|---|
| FCF and revenue growing faster than share count | SBC growing faster than revenue and FCF |
| High return on capital raised | Large option overhang without matching performance |
| Transparent disclosure of dilution drivers | Heavy reliance on adjusted metrics that hide the cost |
| Buybacks offsetting SBC at reasonable valuations | Minimal or no buybacks against heavy SBC |
| Modest SBC scale relative to company size | Large grants issued as growth slows |
To make this measurable, two named frameworks help:
- Aswath Damodaran’s adjustment: divide your DCF equity value by the fully diluted share count (current shares plus in-the-money options and RSUs), not the basic share count, so you do not overstate value per share.
- Morgan Stanley’s model check: confirm that diluted share count growth is not systematically outpacing net income and FCF growth. If it is, apply a dilution haircut to your target price.
Financial projections are speculative and subject to change based on market developments and company performance. Past performance does not guarantee future results.
Building dilution awareness into every investment decision you make
Reduce everything above to one portable test. Before you buy any growth company, compare diluted share count growth over the past three to five years against free cash flow per share growth over the same period. If per-share value is climbing, the dilution is paying for itself. If it is not, you have found your answer.
Think of this as price discipline. Paying a high multiple for a company with rapid dilution is a compounded error, because both the price you paid and the per-share value you own are working against you at the same time.
The maths of compounding makes the point. At the high end of Candor’s estimated 8.6% annual dilution range, compounding over five years shrinks a shareholder’s stake by roughly 35% before anything else happens. That means a heavily diluting stock has to deliver substantially higher absolute returns just to match what a non-diluting equivalent would give you at the same multiple.
This is structural, not an anomaly. Large caps returned around $1.04 trillion through US buybacks in 2025, while growth-stage companies buy back little or nothing against their SBC. The universe you are shopping in is built this way.
Hyperscaler buyback trends reveal a structural shift in capital allocation: repurchase spending as a share of total cash deployed by the largest technology firms dropped from 27% to approximately 15% as AI infrastructure commitments consumed the surplus, compressing the offset that historically kept dilution in check for these names.
Run the four-step dilution audit on every new position:
- Check the SBC trend against revenue over three to five years
- Measure diluted share count growth
- Compare buyback dollars to SBC dollars for the net effect
- Use fully diluted shares, as Damodaran recommends, in every valuation denominator
Do that, and the investor watching per-share fundamentals rather than total company metrics ends up with a far more accurate picture of what their capital is actually earning. The company posting 20% revenue growth may still be a great buy. Now you can tell whether that growth is reaching your share, or slipping past it.
This article is for informational purposes only and should not be considered financial advice. Investors should conduct their own research and consult with financial professionals before making investment decisions.