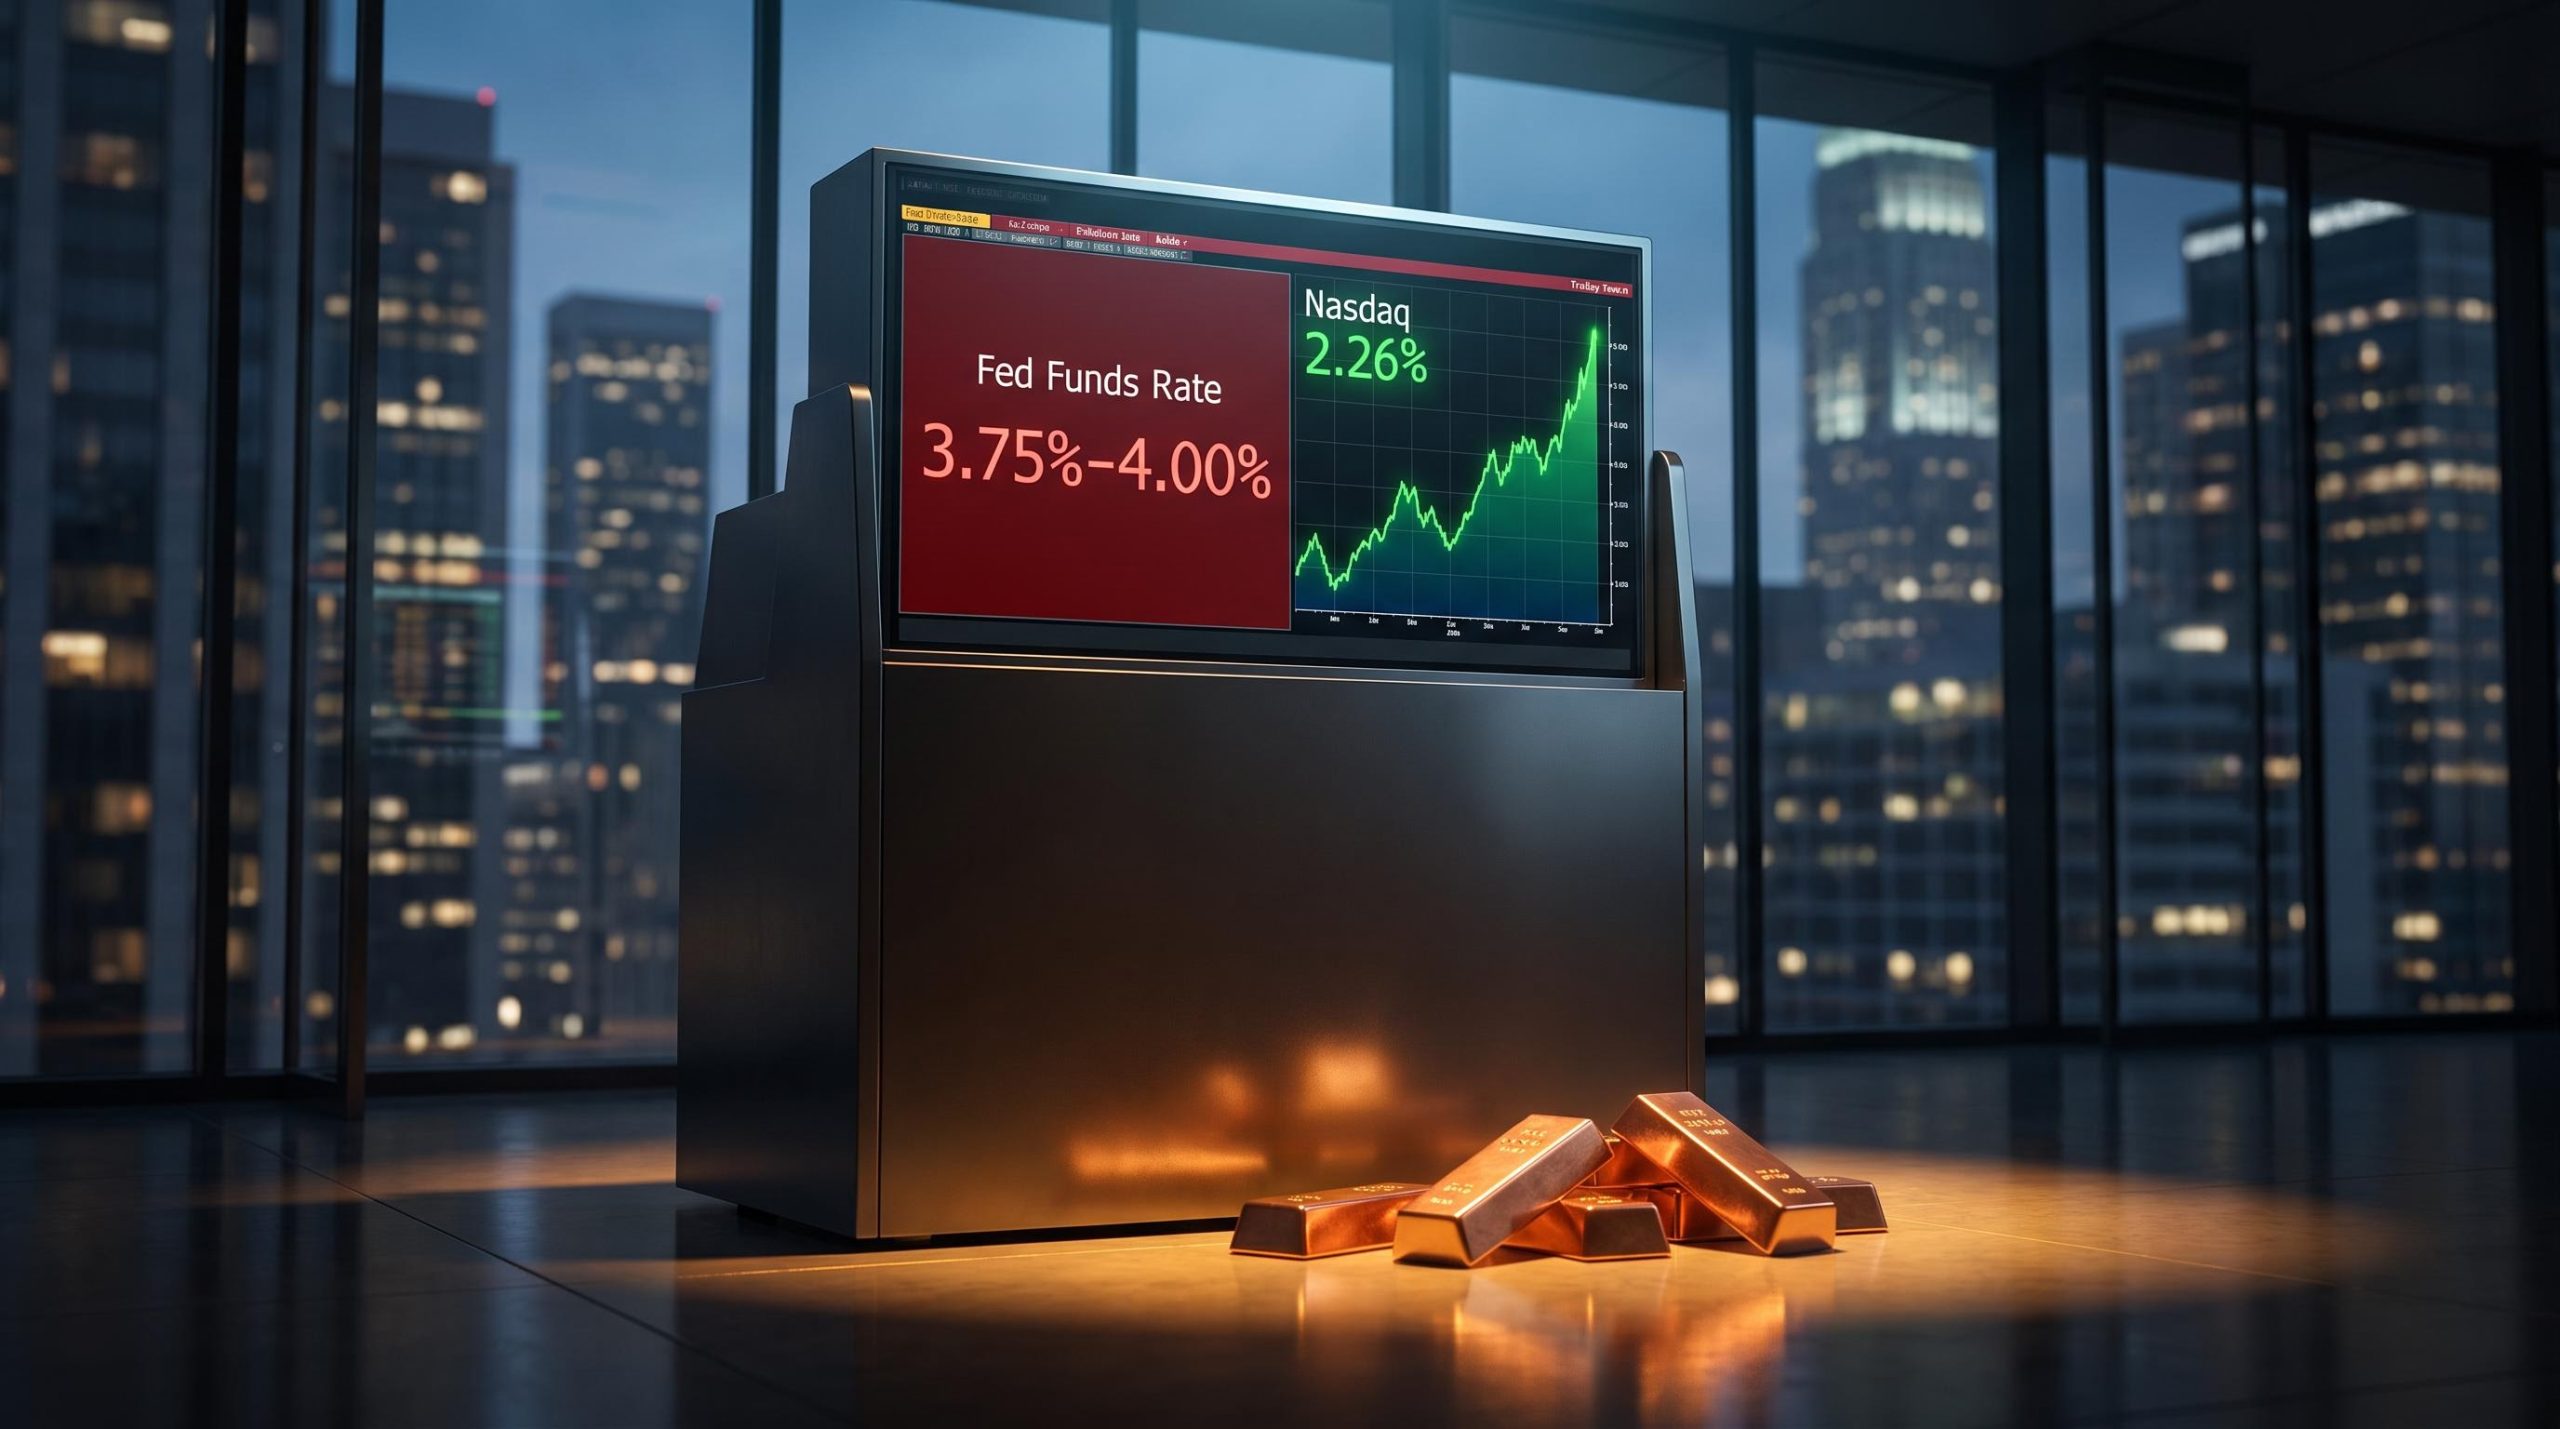
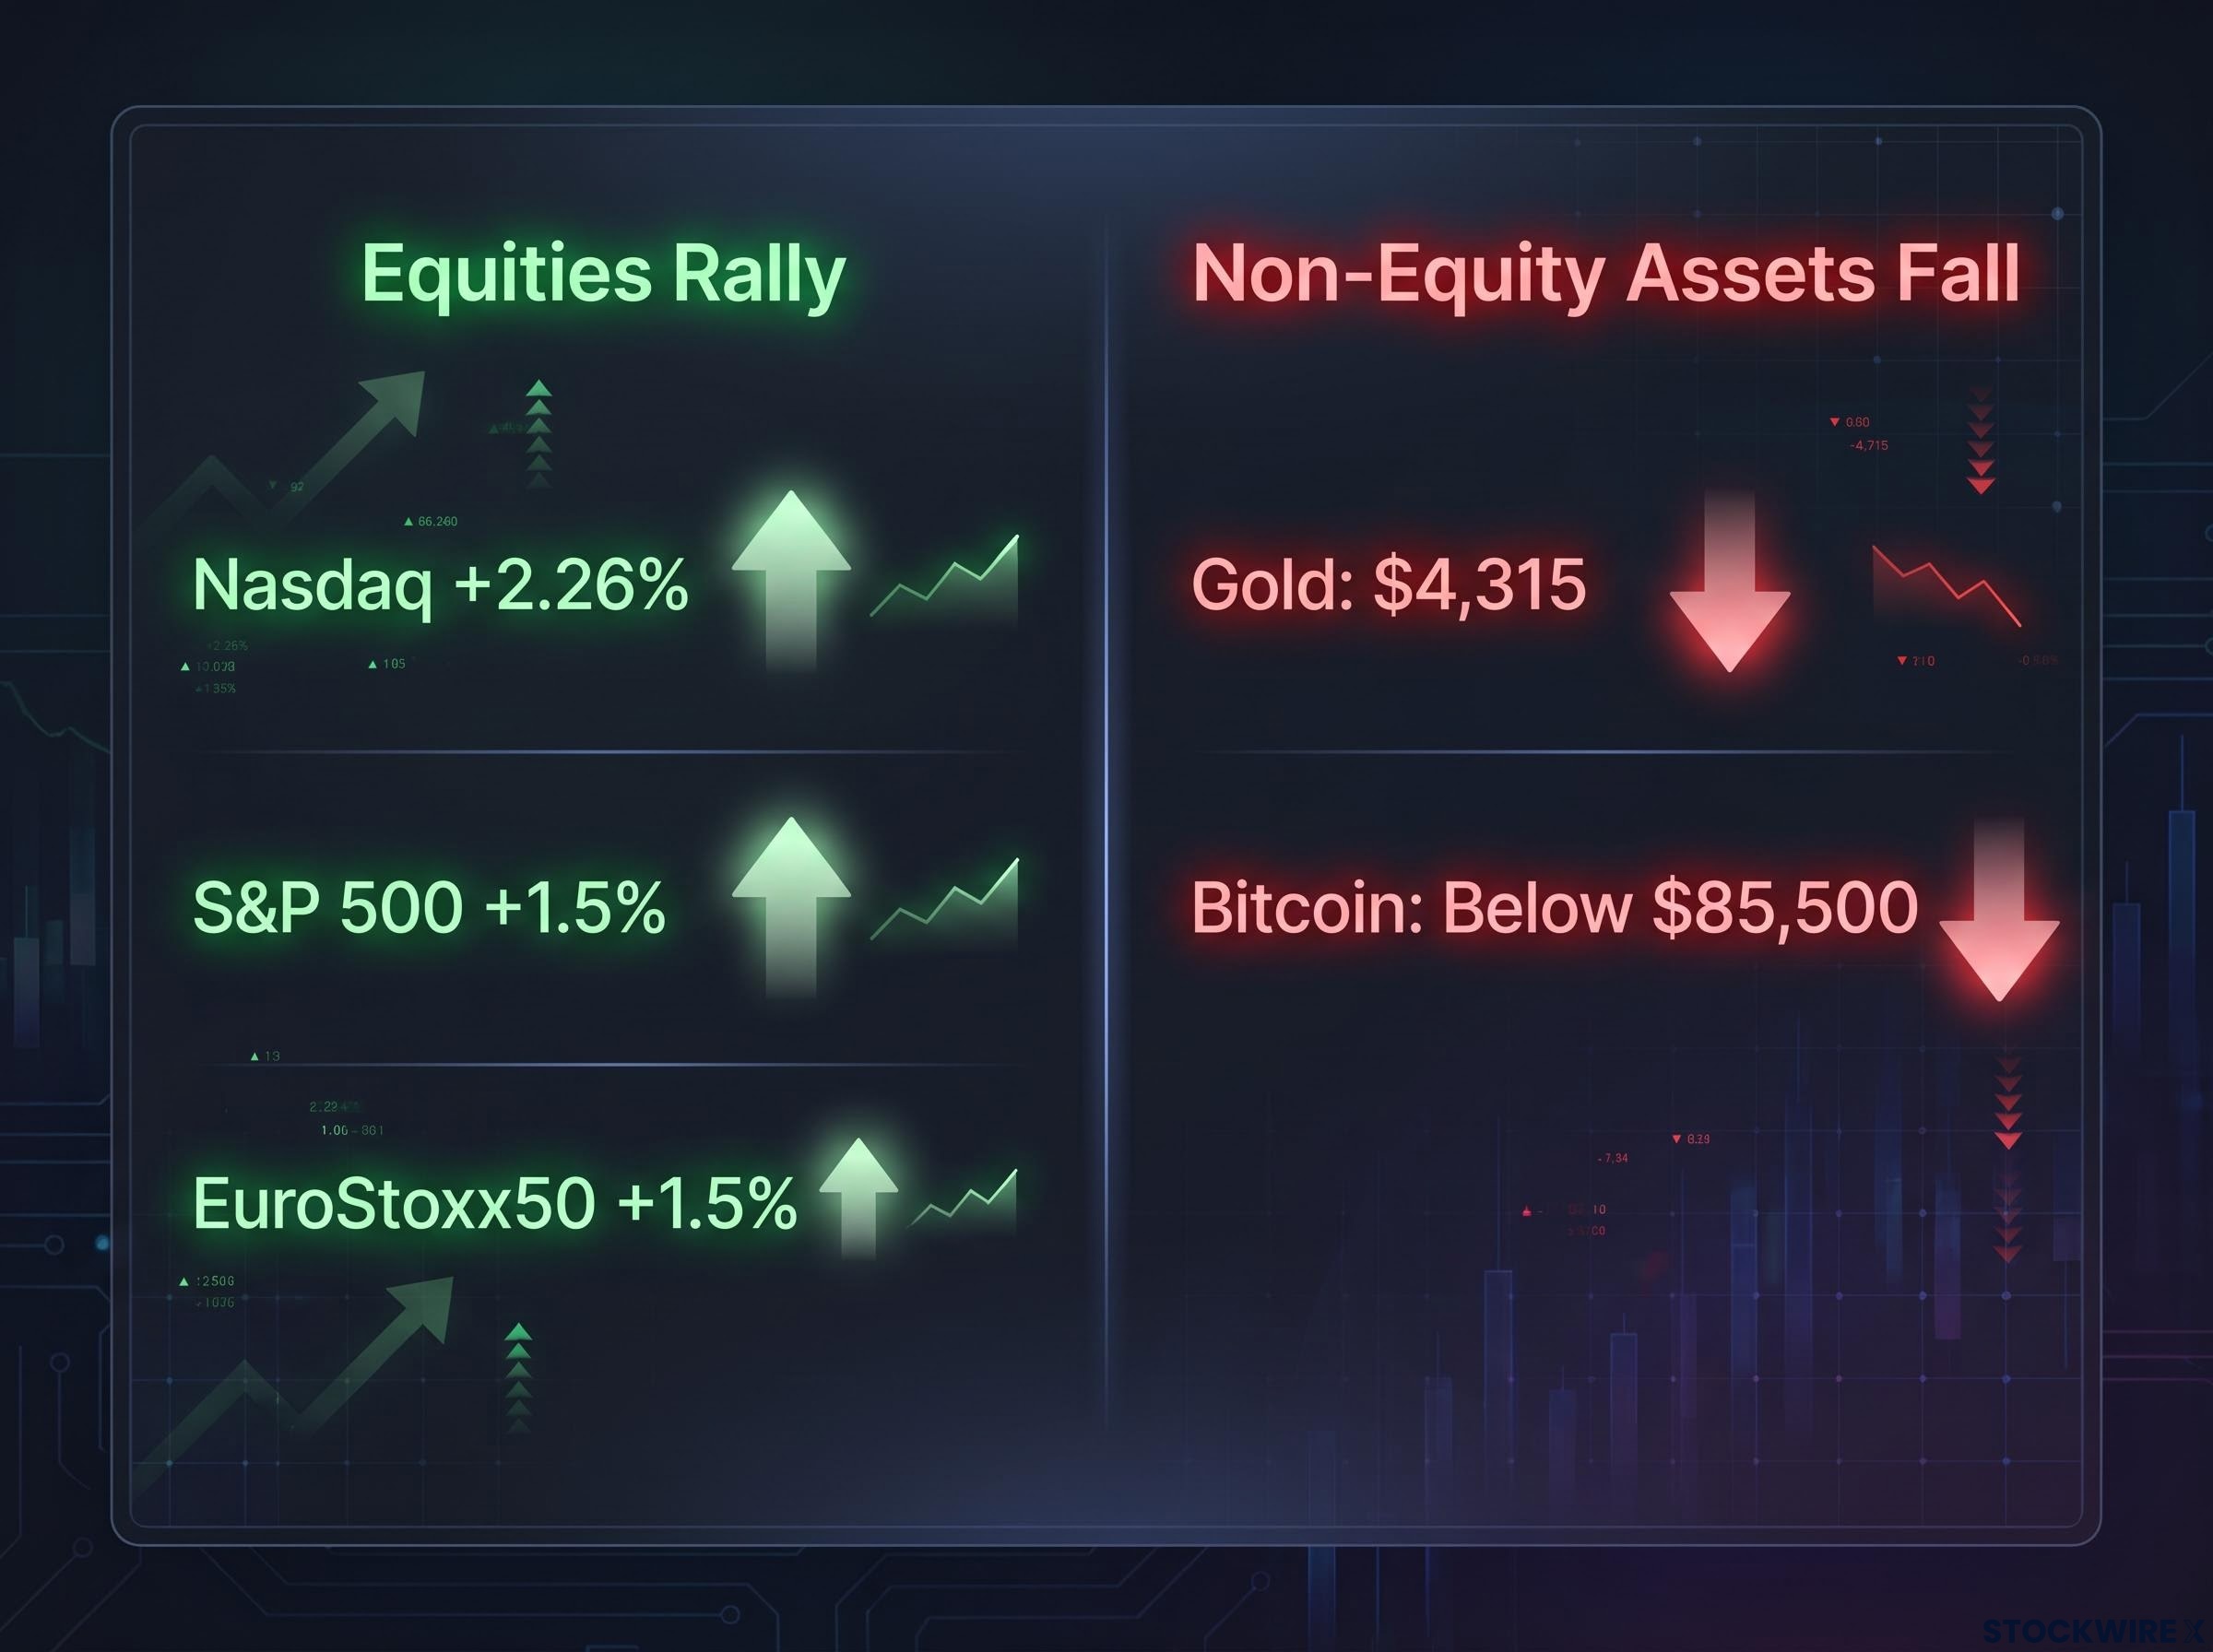
A Federal Reserve district president has just delivered one of the most hawkish policy signals of this tightening cycle. On the same day, US equity markets rallied hard, with the Nasdaq climbing 2.26% toward an all-time high.
That is the contradiction worth sitting with before trying to explain it.
The setting matters. Alberto Musalem, president of the Federal Reserve Bank of St. Louis, made his case just days after the Fed raised the target range for the federal funds rate to 3.75%-4.00% on 16 September 2026, the first hike under new Chair Kevin Warsh. Core inflation is running near 3%, and the Fed’s own projections do not see a return to the 2% target until 2029.
This is not a routine policy disagreement. Musalem is publicly arguing for front-loaded rate increases because he believes the alternative, waiting and then moving larger, is the more dangerous path for the economy.
Here is what the data actually tells you: what Musalem argued and why his position carries institutional weight, why broad commodity inflation makes the Fed’s task structurally harder, and what the market’s reaction reveals about where investor positioning sits right now.
Why Musalem is sounding the alarm now, and what he actually said
Musalem’s argument holds together on its own terms, which is why it deserves to be understood before it is judged. His central preference is for the Fed to raise rates earlier and in smaller increments rather than delay and then be forced into larger, more disruptive adjustments later.
The logic is about sequencing. If inflation expectations begin to drift because households and businesses see the central bank moving too slowly, the eventual tightening required becomes far greater. Moving early and steadily, in his view, keeps expectations anchored and reduces the total damage.
His characterisation of inflation is what makes the argument sharper. Musalem described price pressures as broad-based, originating from both demand-side and supply-side sources, and he specifically flagged copper alongside other commodity pressures rather than treating this as an oil story.
His stance breaks down into three distinct elements:
Only 12 FOMC members vote at each meeting, and the FOMC structure means that public commentary from non-voting regional presidents like Musalem and Kashkari carries informational weight without binding authority, which is precisely why tracking sentiment indices alongside voting records produces a more accurate read of policy direction than headline counts alone.
- A front-loading preference: earlier, incremental hikes over delayed, larger ones
- A broad inflation read: pressures across demand and supply, extending well beyond energy
- A labour market assessment: near full employment, but not the primary driver of current inflation
Musalem’s position is that inflation will stay well above the 2% target for at least the next 18 months unless the Fed applies additional policy restraint.
That warning sits alongside the Fed’s own median PCE inflation forecast of 3.7% for 2026 and its projection that inflation will not return to target until 2029. In other words, Musalem is not describing a fringe scenario. He is describing the institution’s own baseline.
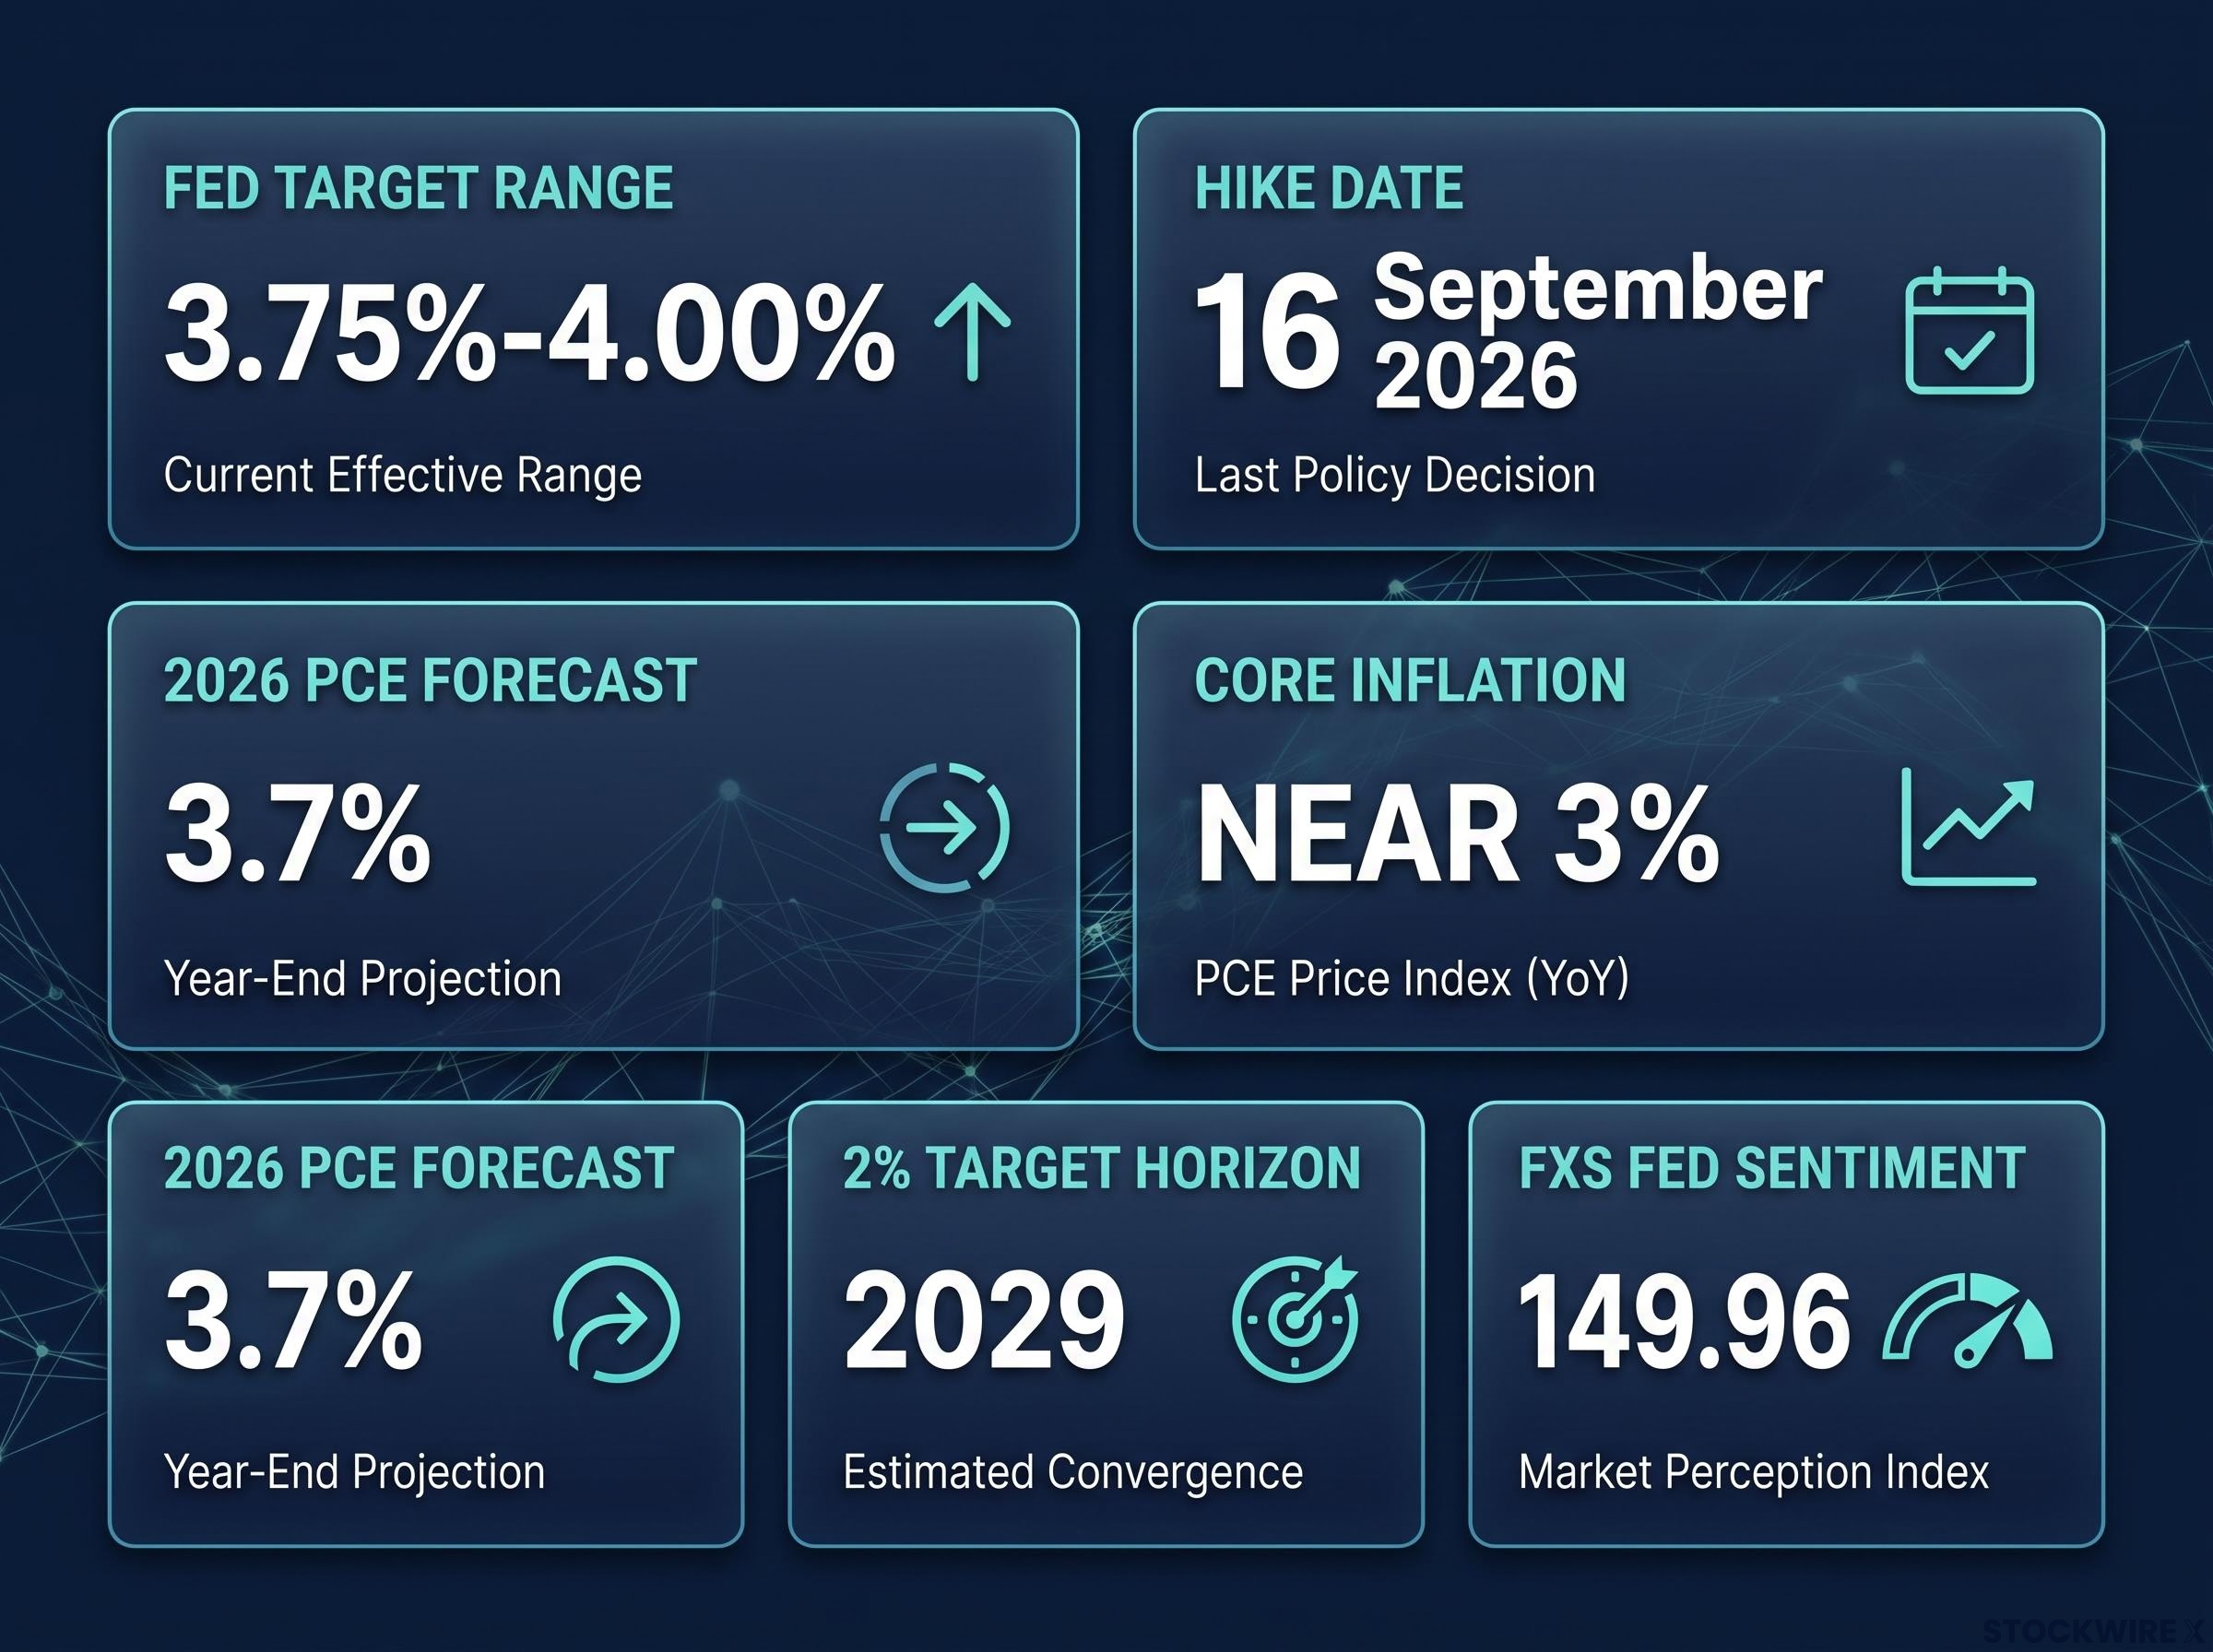
The tracking data reinforces this. The FXS Speechtracker scored his speech 8/10, above its historical average of 7.4/10, and the FXS Fed Sentiment Index climbed 0.42 points to 149.96, firmly in hawkish territory and well above the neutral threshold of 100. On 20 September 2026, Minneapolis Fed President Neel Kashkari added corroboration, telling Fox News that inflation is too high across all sectors, not just oil.
What this tells you is that hawkish momentum is building inside the Fed, not around its edges.
How rate futures are pricing the Fed’s next moves
Markets are not dismissing this guidance. They are internalising it.
Rate futures currently imply roughly a two-in-three chance that the policy rate ends 2026 in the 4.00%-4.25% range, with a strong likelihood of at least another quarter-point increase by mid-2027.
That pricing tells you the base case has already shifted. The market is not betting on the Fed backing down; it is positioning for at least one more move.
When big ASX news breaks, our subscribers know first
What commodity inflation across copper and oil actually means for the Fed’s options
To understand why the Fed’s task is harder than it looks, follow the cost from the raw material to the shelf. When copper and other industrial inputs rise in price, manufacturers, builders, and infrastructure operators face higher production costs regardless of how strong or weak consumer demand happens to be.
Those higher costs tend to get passed through into final prices. This is cost-push inflation, where prices rise because of what it costs to make things rather than because buyers are competing for scarce goods. Musalem’s point about copper matters precisely because it signals this dynamic, and Kashkari’s framing that inflation is elevated “in all aspects” of the economy points the same way.
The copper and oil price dynamics driving cost-push inflation are structurally distinct: COMEX copper hit an intraday all-time high of $6.87 per pound in early September 2026 on electrification demand from EVs, renewables, and AI data centres, while Brent crude’s move above $100 reflected a geopolitical supply premium rather than a demand shock, making the two inputs respond to very different policy levers.
Here is why that complicates the Fed’s toolkit. Interest rates work primarily by cooling demand. They do nothing to fix a shortage of copper or a disrupted supply chain.
The difference between the two types of inflation is worth laying out directly.
| Factor | Demand-driven inflation | Supply-driven inflation |
|---|---|---|
| Fed rate effectiveness | High: rates directly cool demand | Limited: rates do not fix supply constraints |
| Growth risk from tightening | Proportionate to the disinflation achieved | Higher: more growth sacrificed per unit of disinflation |
| Sector impact | Broad slowdown as spending eases | Input-heavy sectors squeezed on both sides |
| Duration | Tends to ease as demand cools | Can persist while supply issues remain |
Several structural forces are keeping supply-side pressure elevated:
- Chronic underinvestment in mining and commodity production
- Geopolitical fragmentation and trade restrictions
- A surge in AI-related capital spending driving demand for industrial inputs
When inflation is driven by both supply and demand at once, raising rates addresses only the demand half. The supply-side cost pressure stays put, which means the Fed may have to inflict more damage on growth to achieve the same drop in inflation.
That is the dilemma. Push hard enough and you risk stagflation: suppressed demand and slower growth, but sticky prices that refuse to fall because their source was never demand in the first place.
For you, the read is that the sectors leaning most on commodity inputs are the ones absorbing pressure from both directions, and rate policy alone will not relieve it.
The Nasdaq paradox: why markets rallied on hawkish day
So how does a market rally on a day the Fed is signalling more pain? The session data makes the contradiction plain: the Nasdaq rose approximately 2.26%, testing a prior all-time high, while the S&P 500 and EuroStoxx50 each recovered up to roughly 1.5%, led by artificial intelligence and technology names.
The standard model says the opposite should happen. Higher rates raise the discount rate applied to future earnings, which compresses the valuations of high-multiple growth stocks whose value sits mostly in cash flows far out in the future.
The September hike market reaction showed a near-identical pattern to the current session: the S&P 500 closed up 1.14% on 16 September 2026 and the VIX fell approximately 12%, confirming that uncertainty resolution rather than a fundamental repricing drove the initial rally, a dynamic that sets the baseline against which each subsequent hawkish signal now gets measured.
By that logic, a hawkish Fed is precisely the wrong backdrop for a tech rally. Yet tech led the gains.
The resolution lies in the other side of the valuation equation: earnings. If AI and productivity-driven earnings growth is strong enough, it can outrun the drag from higher discount rates, at least for a while.
That is the bet investors are making. The rally is not the market ignoring the Fed; it is the market wagering that AI earnings momentum is powerful enough to overwhelm the rate headwind.
The trouble with that bet is that it is conditional, not permanent. It breaks down under three specific circumstances:
- Inflation expectations become unanchored, forcing the Fed to go harder than priced
- AI and tech earnings disappoint relative to already-elevated estimates
- The Fed signals a terminal rate meaningfully above where markets currently sit
Recognising that distinction matters. A rally on a hawkish day is not irrational; it is a specific thesis about two opposing forces, with a defined set of conditions under which it fails.
Gold, Bitcoin, and what non-equity assets are signalling
While equities diverged from the hawkish message, Gold heard it clearly.
Gold fell to around $4,315, marking a three-day low across two consecutive declining sessions, as the hawkish Fed policy outlook pulled capital toward yielding assets and away from the non-yielding metal.
The mechanism is straightforward. Higher policy rates lift real yields, and Gold pays no income, so it competes poorly against assets that do. There is a counter-argument that inflation uncertainty and geopolitical risk should support Gold as a safe haven, but in this session the real-yield story dominated.
Bitcoin told a different story again. It slipped below $85,500 after surging 6.7% the prior session, with profit-taking cited even after spot Bitcoin ETFs recorded nearly $1 billion in net inflows on Monday.
That pullback reads as risk sensitivity rather than directional conviction. Taken together, the cross-asset picture shows the hawkish signal landing hardest where yields matter most, which is exactly where you would expect it if the market is taking the Fed seriously.
What the historical record says about staying restrictive near 3% inflation
History offers three episodes worth walking through in order, because each one adds nuance the previous one lacks.
Start with the Volcker era of the late 1970s and early 1980s. The Fed raised rates aggressively and held them high until inflation fell markedly, accepting a severe recession as the price of re-anchoring expectations. This is the maximum-cost, maximum-effectiveness end of the spectrum: it worked, but the damage was substantial.
The mid-1990s under Alan Greenspan is the more encouraging counterexample. The Fed tightened pre-emptively to head off rising inflation, then held a moderately elevated stance while inflation stayed contained, and it did so without triggering a hard landing. Economists often cite this cycle as evidence for exactly the front-loading approach Musalem prefers.
The 2015-2018 normalisation adds a warning. Even gradual rate increases from near-zero levels, combined with balance-sheet runoff, triggered volatility in equities and credit and eventually forced a policy reversal. It showed that markets can be sensitive to both the level and the pace of tightening, even when rates are only moderate.
| Era | Inflation character | Fed approach | Outcome | Relevance to 2026 |
|---|---|---|---|---|
| Volcker (late 1970s-early 1980s) | Entrenched, expectations unanchored | Aggressive, held high | Inflation crushed, severe recession | Maximum-cost path if expectations drift |
| Greenspan (mid-1990s) | Rising but moderate | Timely, front-loaded | Soft landing avoided | Supports Musalem’s front-loading case |
| Normalisation (2015-2018) | Fluctuating near 2-3% | Gradual, plus balance-sheet runoff | Market volatility, eventual reversal | Warning on rate and pace sensitivity |
Across all three, the recurring lessons are consistent:
- Keeping rates elevated trades growth and employment against price stability
- Extended restriction exposes leveraged and rate-sensitive parts of the credit market
- The interaction of rate policy with financial structures can produce non-linear stress
The record does not settle the debate between Musalem’s front-loading and a more cautious, data-dependent alternative. It shows that outcomes hinge on whether inflation is mainly structural or cyclical, which is precisely the question the current commodity picture has left open.
What the Fed’s hawkish path means for investors navigating the next 18 months
Pull the threads together and the core tension is clear. The Fed is on a hawkish path with real institutional momentum behind it, from Musalem to Kashkari to Warsh’s September hike, yet the effectiveness of that path depends on whether commodity inflation is structural or cyclical, and today’s data cannot answer that definitively.
That uncertainty is not a reason to wait. It is a reason to watch the right variables.
Three will determine how this plays out:
- The trajectory of core PCE relative to the 3% level Musalem flagged
- Commodity price direction, with copper and oil serving as a proxy for supply-side pressure
- Earnings momentum in AI and tech, the key offset to rate-driven valuation headwinds
The asset class implications follow directly from those variables. Prolonged restrictive policy is a headwind for rate-sensitive sectors such as REITs, utilities, and high-yield credit, and for non-yielding assets like Gold in a rising real-yield environment. AI and tech names sit in a more conditional position that depends on whether earnings keep outrunning the discount-rate drag.
The asset class picture, in short:
- Rate-sensitive sectors: under sustained pressure while restriction persists
- Gold: facing real-yield competition unless safe-haven demand reasserts
- AI and tech: conditional, dependent on the three variables above
This is not a uniquely American story either. AUD/USD was trading above 0.7100, supported in part by hawkish commentary from Reserve Bank of Australia officials, a reminder that the restrictive policy environment spans multiple central banks.
The Fed’s projection that inflation will not return to 2% until 2029 is the duration anchor for this entire analysis.
For you, the takeaway is that the hawkish stance is a regime condition to plan around, not a single event to react to. Treating each rate decision as a discrete shock, rather than a signal within a longer cycle, is how investors end up mispositioned in the sectors where the rate regime matters most.
A regime, not an event: positioning for a prolonged hawkish Fed
The single most useful mental model here is this: the Fed’s hawkish stance is a multi-year regime, not a passing phase that resolves in a quarter or two. The institutional momentum behind it, from Musalem and Kashkari to Warsh’s September hike, combined with a 2029 return-to-target horizon and persistent commodity inflation, points to conditions that will persist rather than fade quickly.
The FXS Fed Sentiment Index at 149.96 puts a number on that bias, sitting far above the neutral threshold of 100.
The error to avoid is treating each Fed communication as a binary buy-or-sell signal. The Nasdaq paradox already showed why that misfires: markets can rally on a hawkish day when earnings momentum offsets valuation pressure, but that offset is conditional and can reverse. A single headline is rarely the whole story.
The better approach is to update a probabilistic view of the rate cycle’s likely duration and terminal level, and to recalibrate it as new data arrives. The three monitoring variables from the previous section, core PCE, commodity direction, and tech earnings, are the ongoing toolkit for doing exactly that.
The Fed’s 16 September statement framed its action as supporting a “timelier return to the 2% goal,” signalling that the policy intention remains intact regardless of short-term market moves.
The question is not whether the Fed stays hawkish in the near term. The evidence strongly suggests it will. The question is how long the conditions that make that path necessary will last, and only the commodity and earnings data can answer it.
For investors wanting to map the rate regime to specific portfolio exposures, our dedicated guide to Fed hike portfolio implications covers duration risk in bonds, equity valuation compression mechanics, and the structural constraint that US federal debt at 122% of GDP places on each additional hike.
This article is for informational purposes only and should not be considered financial advice. Investors should conduct their own research and consult with financial professionals before making investment decisions.
Past performance does not guarantee future results. Financial projections are subject to market conditions and various risk factors, and forward-looking statements are speculative and subject to change based on market developments.