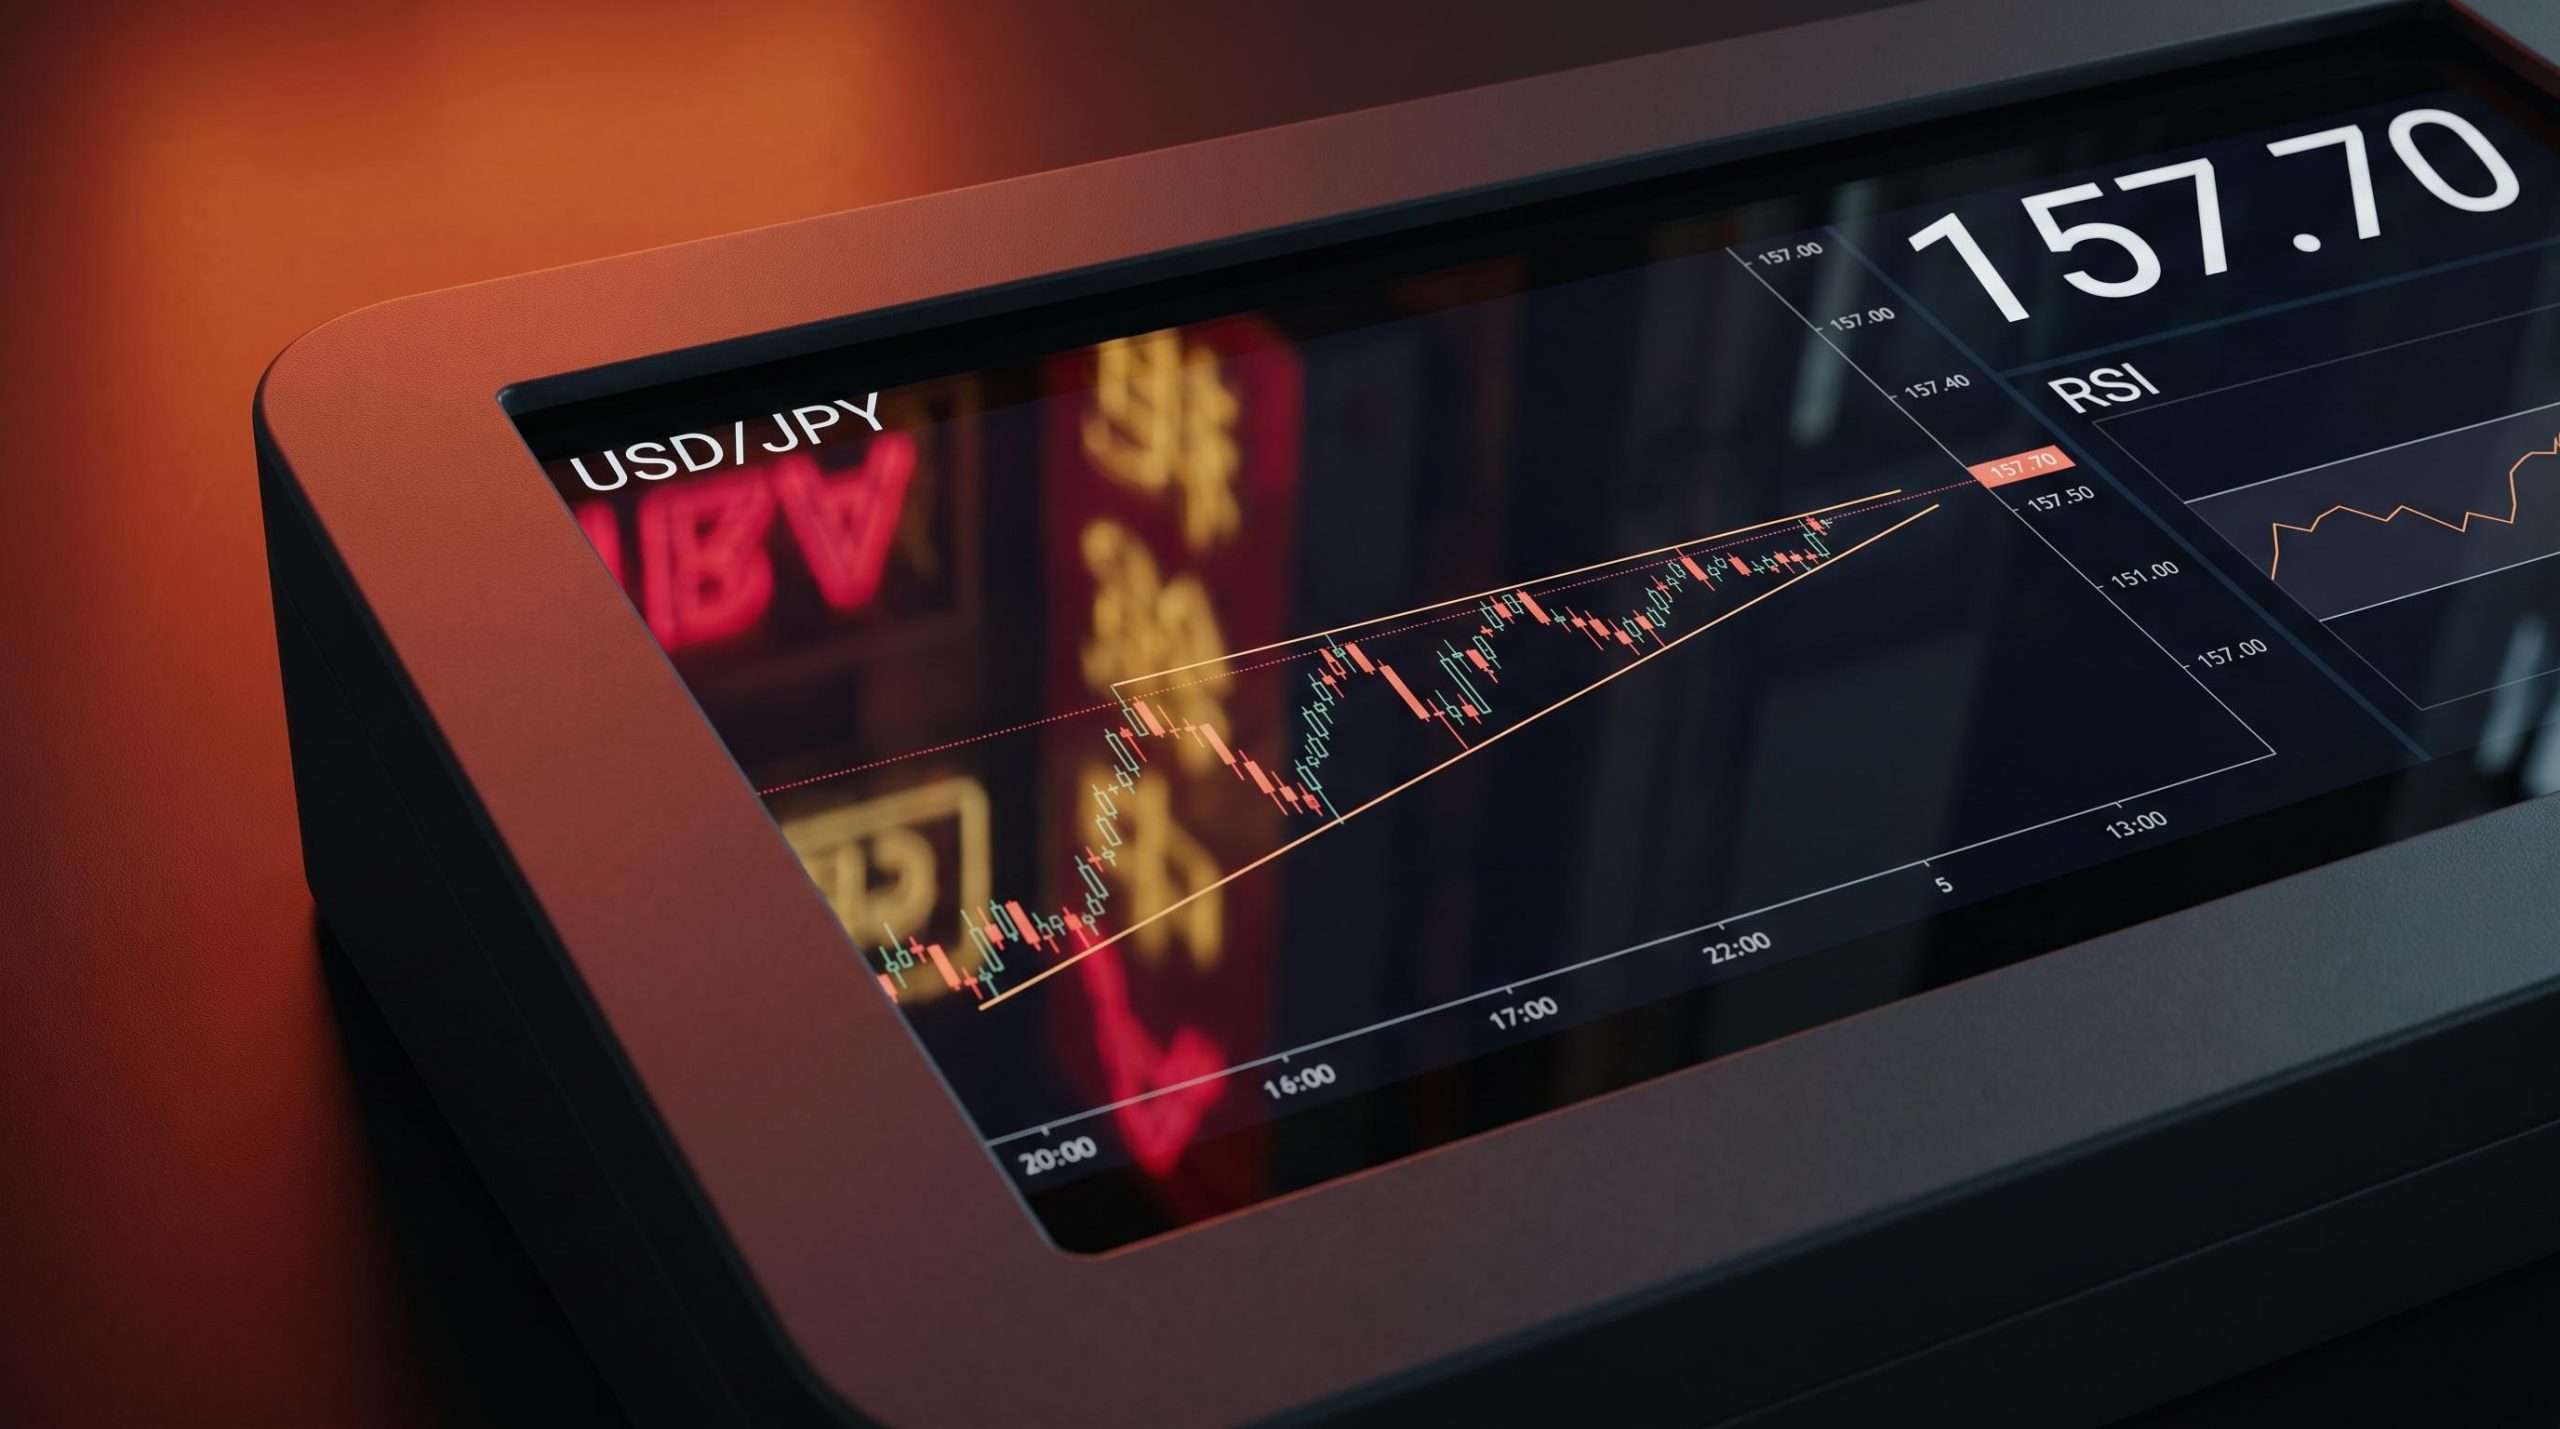
The Dollar Index is trading in a zone that, on a pure chart basis, looks constructive. But this week, a geopolitical wildcard is sitting directly on top of that setup, and the two are pulling in opposite directions.
As of 22 September 2026, the DXY is hovering around 100.40, holding above its key moving averages and printing a Relative Strength Index that signals positive momentum without yet reaching overbought territory. At the same time, Iranian President Masoud Pezeshkian is in New York for the United Nations General Assembly High-Level Week, and President Donald Trump has described a potential Trump-Pezeshkian meeting as “on the cards.” For anyone watching the dollar, a bullish chart layered under a risk-sentiment wildcard is exactly the kind of setup that rewards structured thinking over instinct.
Here is what the chart actually says about near-term DXY direction, what a diplomatic breakthrough or breakdown at the assembly would do to that picture, and how to hold both signals at once without letting either dominate the read prematurely.
What the DXY chart is actually saying right now
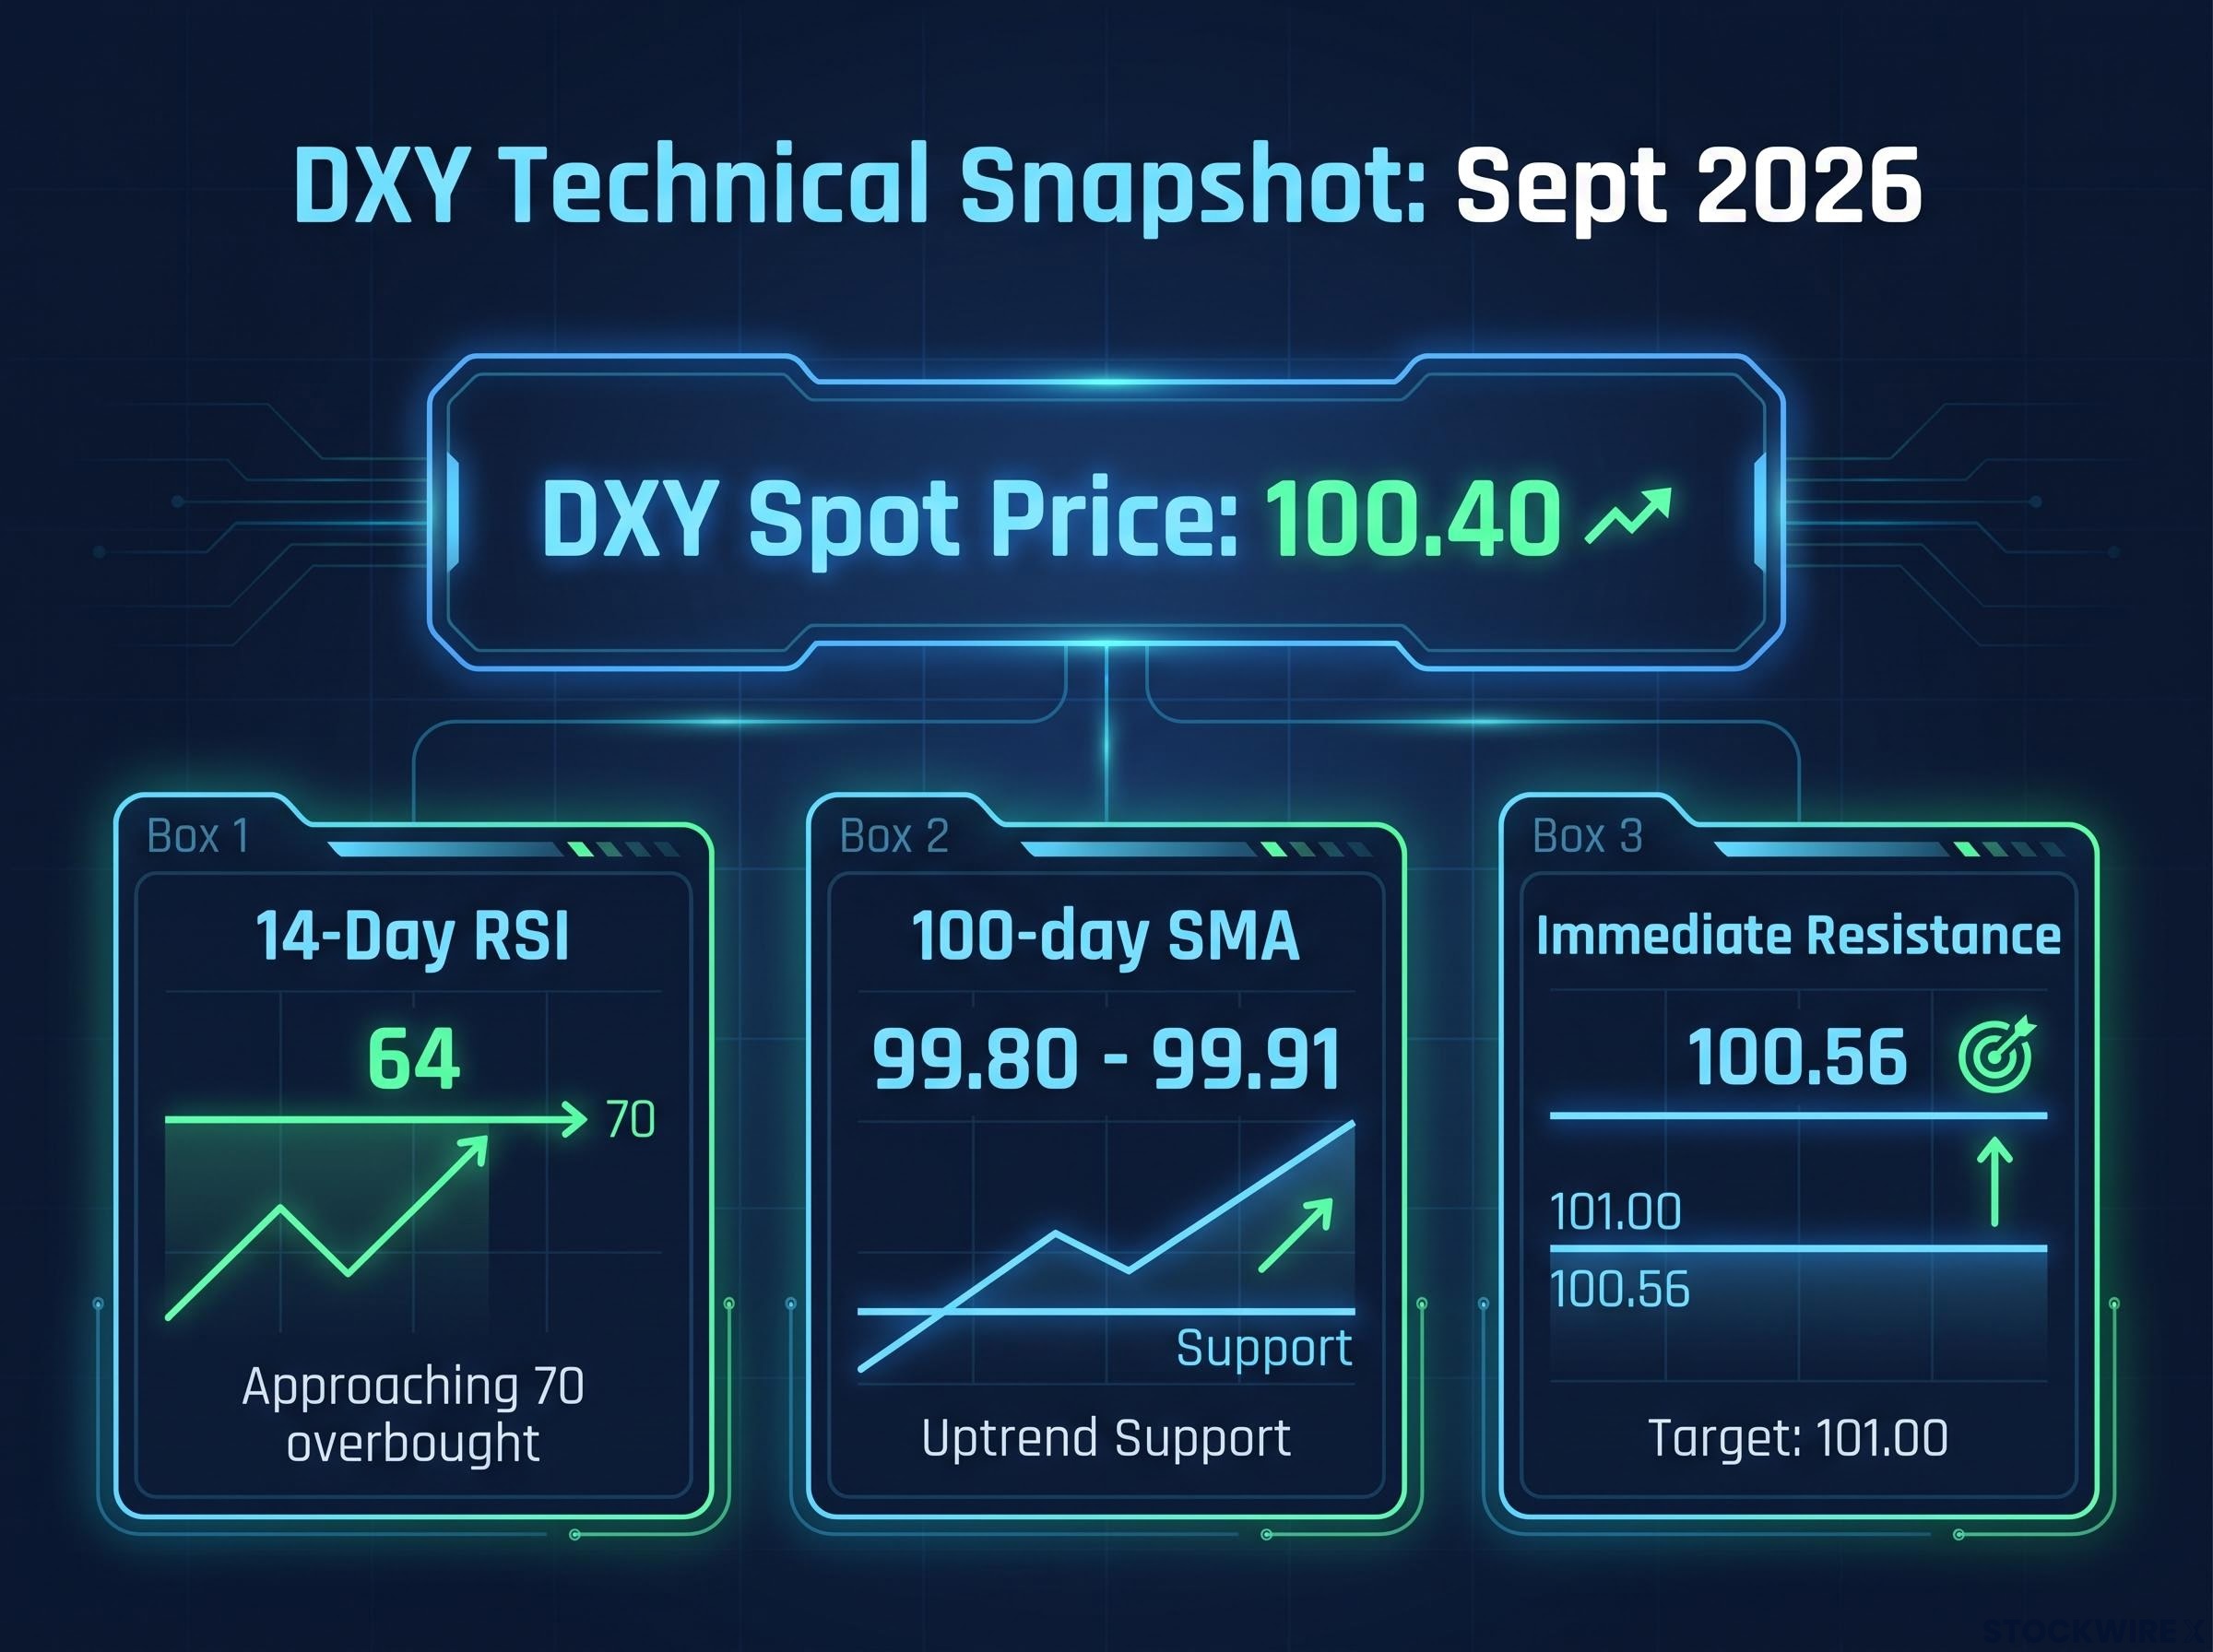
Start with where price sits. The Dollar Index is trading firmly around 100.40 as of 21-22 September 2026, according to readings from TMGM and TradingEconomics, and it is doing so above a cluster of moving averages that matter.
That cluster is the first piece of the story. Data from Mitrade in mid-September placed the 100-day simple moving average near 99.80-99.91 and the shorter-term averages sitting just under current price around 100. When the index trades above these lines, the technical read is that buyers, not sellers, have controlled the recent trend.
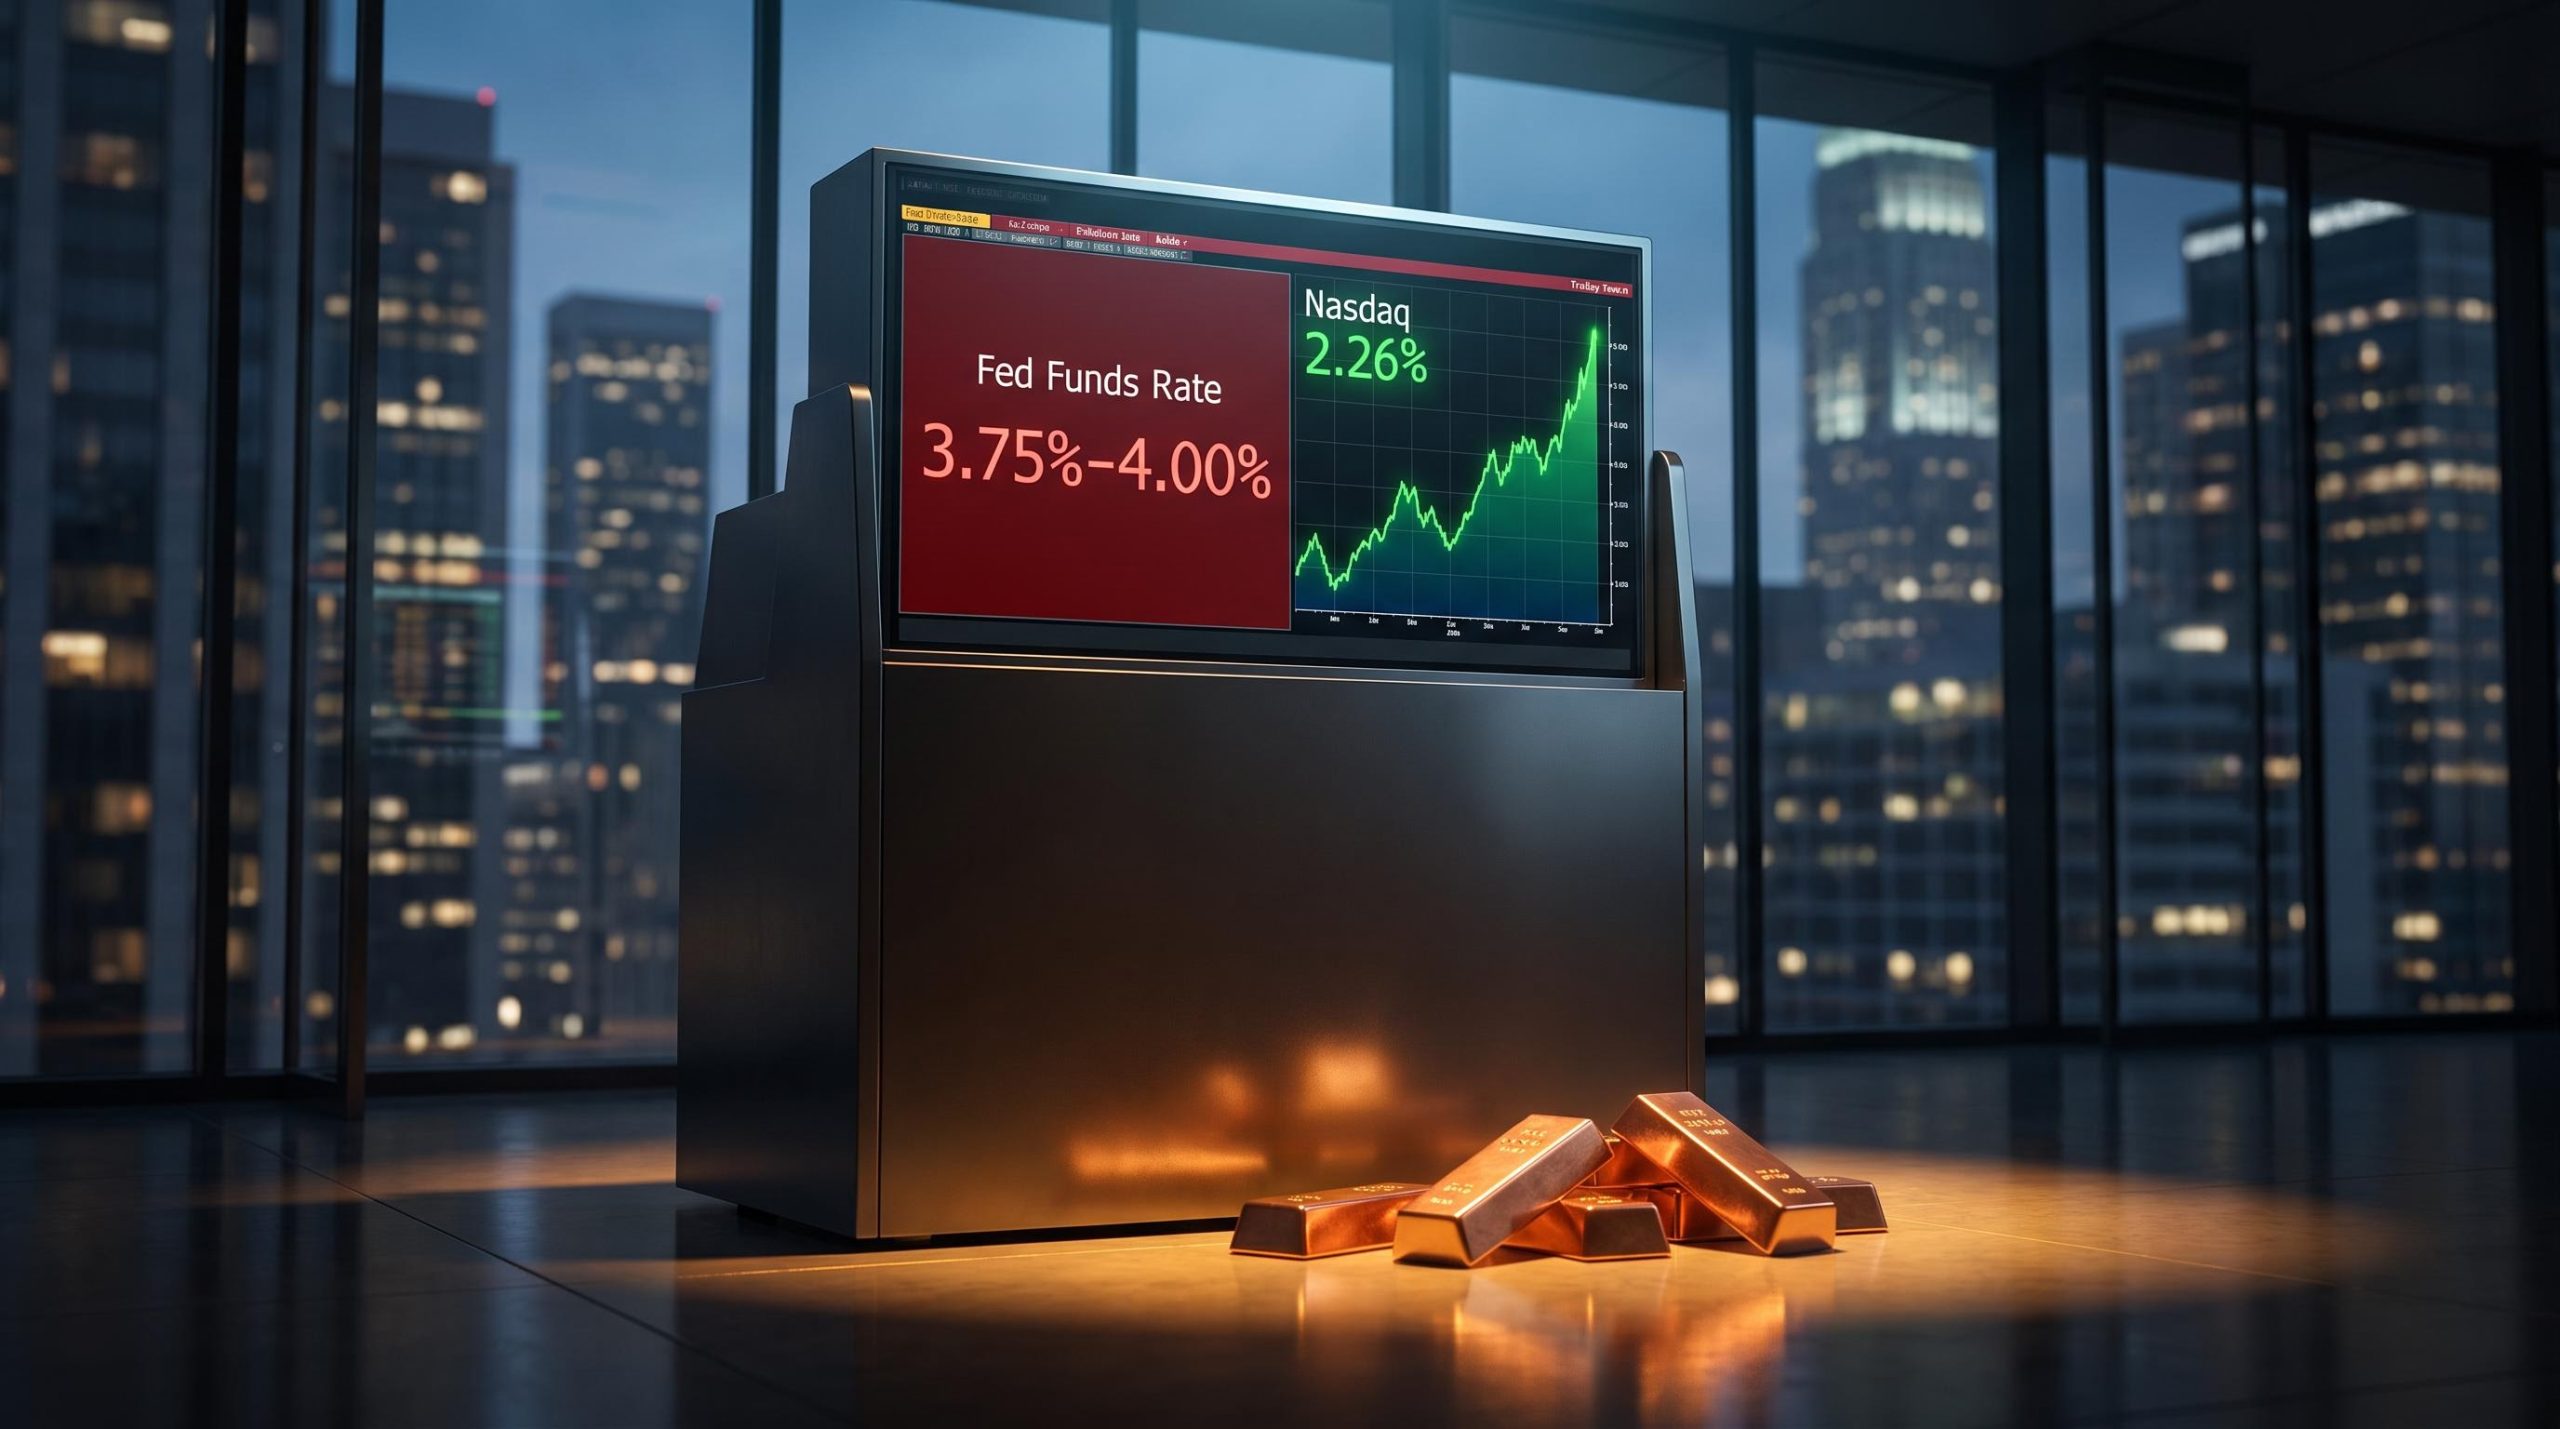
The DXY breakout above 100 earlier in September was driven by three simultaneous forces: a unanimous Fed rate hike to 3.75-4.00%, a 30-basis-point dot-plot revision, and geopolitical risk layering safe-haven demand on top of an existing yield-differential move, making the current price cluster directly traceable to those catalyst conditions.
The Bollinger Band structure tells you the same thing from a different angle. Across the September readings, the middle band sat in the 99.15-99.50 range, the lower band near 98.45-98.60, and the upper band anywhere from 99.75 to 100.60 depending on the period measured. What that means in practice: the DXY is trading in the upper half of its own recent range, closer to the ceiling than the floor.
Then comes the nuance that changes everything. Mitrade’s 18 September 2026 reading put the 14-day RSI near 64, with a positive MACD backing it up.
The RSI matters because it measures how much momentum is already in the move. A reading near 65 confirms genuine positive momentum. It also sits close enough to the overbought line at 70 that there is limited room left for momentum-driven buying before the indicator itself starts working against a further push higher.
That is the read you should take from the chart. The market has already priced in a meaningful chunk of the bullish case, which means a fresh catalyst is needed to break resistance rather than the current momentum carrying the index through on its own.
A decisive move above 100.56 is needed to extend the rally toward 101.00.
That figure, flagged by TMGM on 22 September 2026, is the immediate gate.
| Indicator | Current Reading | What It Signals |
|---|---|---|
| Spot price | Around 100.40 | Trading above key support, constructive bias |
| 100-day SMA | 99.80-99.91 | Price above it confirms recent uptrend control |
| 14-day RSI | Near 64 | Positive momentum, but limited room before overbought |
| Upper Bollinger Band | 99.75-100.60 | Price in upper half of recent range |
| Immediate resistance | 100.56 | Break needed to target 101.00 |
For anyone sizing exposure or placing stops, that distinction between early and late is what counts. The setup is constructive, but it is not wide open.
When big ASX news breaks, our subscribers know first
The geopolitical variable that charts cannot price in advance
A chart can tell you where price sits relative to its own history. It cannot tell you what a room in Manhattan is about to decide. That is the problem sitting on top of the DXY this week.
Start with what is confirmed. Pezeshkian and Foreign Minister Abbas Araghchi are in New York under a restricted visa covering a “core delegation,” with limited movement around Manhattan and a delegation smaller than in previous years. Reuters, The Washington Post, and the BBC have all confirmed the attendance.
Now the gap. Trump has called a meeting “on the cards,” but that phrase is not a schedule. There is no confirmed bilateral US-Iran session on any official agenda with a stated time and a participant list. UN Secretary-General António Guterres put the limit plainly on 16 September 2026, saying the UN can offer to host negotiations but can only organise what the parties themselves are willing to do.
That gap between “on the cards” and a confirmed meeting is where the volatility lives this week.
How markets price diplomatic possibilities before they materialise
Here is the mechanism that makes the gap matter. FX markets do not wait for outcomes; they reprice risk premiums in anticipation. The moment a credible possibility of diplomatic engagement appears, some of the geopolitical risk premium embedded in the dollar starts to bleed out, because traders reposition on expectation rather than confirmation.
The evidence is recent. Reuters reported on 4 March 2026 that the Dollar Index slipped 0.1% to 98.93 as investors unwound safe-haven positions on hopes the Middle East conflict would prove shorter than feared. No deal was signed. The hope alone was enough to move the index.
Iran peace talks repricing extended well beyond the dollar in May 2026, with WTI crude dropping nearly 5% in a single session to around $99.08 per barrel while 30-year Treasury yields retreated from 19-year highs, confirming that diplomatic signals in this conflict cascade across asset classes simultaneously rather than staying contained in FX.
For the current setup, that timing is awkward. The DXY is sitting near resistance, which means a risk-on shift from an encouraging diplomatic signal would hit the index at a technically vulnerable moment, compressing the upside precisely where momentum was already running thin.
The risk is asymmetric, and understanding the direction of that asymmetry is the analytical edge here. Three broad outcomes are on the table:
- A diplomatic breakthrough or credible signal. Risk appetite improves, the dollar’s crisis premium fades, and the DXY most likely faces downward pressure back toward its moving average support.
- A stalemate with no substantive news. The geopolitical variable neutralises itself and the technicals reassert as the dominant driver.
- A breakdown or hostile exchange. Safe-haven demand for the dollar firms briefly, though the chart already reflects some of that geopolitical support, limiting how much fresh upside a fear spike can generate.
For a benchmark on that escalation case, look at October 2024, when an Iranian missile attack on Israel drove the DXY up 0.5% intraday toward 101.25 as capital rushed to safety. That is the shape of an escalation-driven move.
Positioning around DXY resistance levels this week without accounting for the diplomatic gap is a framework error. The calendar has become a market variable, not background noise, and knowing the difference between confirmed, speculated, and officially unscheduled is what separates signal from static.
When chart signals and geopolitical risk collide
So the chart says one thing and the diplomatic calendar threatens another. The question is how these two forces actually interact when they meet, and history offers a clear answer: neither cancels the other, but one can temporarily override it, and the direction of that override is not random.
Geopolitical shocks routinely push the DXY through technical levels that would otherwise hold. The October 2024 episode is the cleanest example. That 0.5% intraday spike toward 101.25 was event-driven, not generated by momentum or a chart pattern. Resistance broke because fear, not technical structure, was doing the buying.
Sustained tension can extend a setup even further. In Q1 2026, Middle East conflict pushed the DXY up 1.43% over the quarter, briefly carrying it above 100 for the first time since November 2025. That move ran well beyond what the momentum indicators alone would have predicted, because a geopolitical bid does not respect an overbought RSI.
| Event | Timeframe | DXY Move | Duration of Effect |
|---|---|---|---|
| Iran-Israel missile attack | October 2024 | +0.5% intraday, toward 101.25 | Short-lived spike |
| Middle East conflict | Q1 2026 | +1.43%, crossed 100 | Extended, then settled lower |
| De-escalation hopes | March 2026 | -0.1%, to 98.93 | Reversal on unwinding safe-haven bids |
Now the counterweight. The structural analyst consensus does not see any of this as trend-changing. Morgan Stanley projects the DXY falling from around 100 to 94 by Q2 2026 before a partial rebound. MUFG forecasts roughly 93.6 in Q1 2026 and about 92.3 by Q2 2026. The bullish technical setup, in other words, exists inside a larger structural downtrend.
The longer-run picture underlines it. IMF COFER-based data shows the dollar’s share of global FX reserves slipping to around 56-57% by Q1 2026, the lowest in roughly three decades. That is a slow demand-side drag no single chart week captures.
The average one-month performance of the DXY around wars and crises is slightly negative, at -0.19%.
That composite figure anchors the point. Fear spikes look dramatic on the day, but they tend to fade within weeks.
Here is what that history tells you. Geopolitical spikes through resistance are real, but they are usually short-lived, which means anyone reading the current bullish chart should distinguish a technically driven breakout from an event-driven one. The follow-through logic differs entirely. A technical breakout can build; an event-driven spike is more often an exit point than an entry. Conflating the two leads straight to the wrong positioning call.
The structural headwinds sitting behind the chart
Everything so far has treated the chart as the starting point. Zoom out, and the chart starts to look less like the story and more like a symptom. The structural forces sitting behind it are what set the ceiling for any technically bullish move, and they explain why that ceiling keeps holding.
Why technical breakouts above 101 have struggled to hold
The first force is monetary policy. TD Economics anticipates around 3% of additional dollar downside into 2026, and both TD and Lombard Odier tie that expectation directly to the Federal Reserve easing cycle and the narrowing yield spreads that come with it. Lombard Odier’s argument is specific: the dollar can weaken further because the Fed is cutting while other major central banks have already finished their tightening. Lower relative rates remove one of the DXY’s primary supports.
The second force is slower and deeper. That erosion of the dollar’s reserve share to 56-57%, a multi-decade low on IMF COFER data, does not move the September 2026 chart on any given day. What it does is explain why institutional price targets sit so far below current spot: the structural demand base is drifting lower even when safe-haven spikes push price higher temporarily.
Put those together and the resistance picture makes sense. StoneX has framed the DXY’s failure to break its multi-year downtrend as a vulnerability, identifying resistance layered above 101 at 101.92, 102.72, and 103 (levels flagged in StoneX commentary and not independently verified). The 100.56 gate this week is not the ceiling. It is simply the next gate, with a wall of downtrend resistance stacked above it.
The multi-year downtrend resistance that stalled the DXY through August, with every prior support level rotating into resistance and the 200-day EMA near 99.70-99.75 acting as the critical line for bulls to reclaim, is the same structural ceiling that now sits above the 100.56 gate this week.
The bearish-dollar camp is well populated:
- Morgan Stanley: DXY falling toward 94 by Q2 2026 before a partial rebound.
- MUFG: DXY near 93.6 in Q1 2026, around 92.3 by Q2 2026.
- TD Economics: roughly 3% of further downside into 2026.
- Lombard Odier: further weakening as the Fed eases against completed tightening cycles elsewhere.
There is a credible counter-view, and it deserves weight rather than dismissal:
- Robert Waldner, strategist at Invesco (via Morningstar): expects the dollar to keep appreciating near to medium term on rate expectations and growth.
- State Street Global Advisors: argues escalating war risks and energy disruptions reinforce dollar strength, positioning it as a crisis hedge.
For anyone reading the DXY chart in isolation, these structural signals are why the bullish setup has struggled to produce sustained breakouts above the 101-102 zone, and why the base case for most institutional strategists remains a weaker dollar by mid-2026 despite the constructive near-term picture.
For investors wanting to understand the structural forces behind the institutional bearish consensus in more depth, our deep-dive into dollar reserve currency risk covers the OMFIF survey data showing central banks planning to reduce dollar allocations for the first time, the $4 trillion in hedge fund Treasury exposure, and the fiscal trajectory that analysts identify as the live portfolio risk variable.
Holding both signals at once before the week is out
That leaves you holding two truths that point in different directions, and the task is to hold both without letting either one take over the read.
The chart is constructive but not open-ended. 100.56 is the near-term gate, and with the RSI near 64-65, there is limited momentum room to force it without a fresh catalyst. The geopolitical variable at the assembly is unconfirmed but real enough to move markets on expectation alone, with Trump’s “on the cards” framing marking the uncertainty.
Map the week onto three scenarios:
- Risk-on breakthrough. A diplomatic signal improves sentiment and pressures the DXY back toward its moving average support.
- Stalemate, technicals reassert. No substantive news, and the chart becomes the dominant driver again around the 100.56 level.
- Escalation, safe-haven spike. Hostile developments firm dollar demand briefly, though the chart already carries some geopolitical premium, limiting fresh upside.
Then anchor it to the longer view.
Morgan Stanley projects the Dollar Index near 94 by Q2 2026.
Even if the bullish setup survives the week, that structural reference reframes any near-term breakout as tactical rather than strategic.
The chart gives you the near-term range. The assembly calendar gives you the event risk. The structural consensus tells you which direction a sustained move is more likely to resolve over the coming quarters. Holding all three at once, rather than defaulting to one, is what separates a tradeable setup from a misleading one, and that is exactly what this week’s DXY picture demands.
This article is for informational purposes only and should not be considered financial advice. Investors should conduct their own research and consult with financial professionals before making investment decisions. Past performance does not guarantee future results, and financial projections are subject to market conditions and various risk factors. These statements are speculative and subject to change based on market developments.