
A three-day rally usually gets traders excited. This one should make them nervous.
USD/JPY has pushed steadily higher, closing its third consecutive session of gains near 157.70 during recent European trading. On the surface, that looks like momentum. Look closer at the daily chart, though, and the pair resembles a coiled spring pressed hard against a concrete ceiling, with structural forces pushing up and formidable technical barriers pushing back.
This particular moment matters because two powerful forces are colliding. Wide interest rate differentials between the United States and Japan keep rewarding dollar buyers, yet the pair is running straight into long-term moving averages that have capped every advance, all while Japanese authorities conduct rate checks that historically precede intervention.
The USD/JPY technical outlook right now is not a simple bullish story or a simple bearish one. It is a decision point. Here is the framework for reading the current chart structure, understanding the central bank forces driving the price, and pinpointing the exact levels where this market could reverse violently.
Mapping the current technical battlefield
Start with where price actually sits. As of 22 September 2026, USD/JPY is consolidating in a tight band between roughly 157.45 and 157.70, according to technical analysis from FXStreet and Bloomberg’s currencies dashboard. That places it right in the middle of a contested zone, above short-term support but below the heavier resistance overhead.
The pair is advancing within an ascending channel, a rising corridor of price defined by higher highs and higher lows. That structure signals a developing bullish bias. But it is running into trouble at the top.
Upside resistance sits at the 50-day exponential moving average of 158.08 and again at the channel’s upper boundary near 158.60. These two levels stack close together, forming a dense ceiling that price has been unable to clear.
On the downside, the nine-day EMA near 156.41 offers the first cushion, with the channel floor around 154.60 acting as secondary support. Below that, a breach exposes a near 11-month trough at roughly 152.10.
Momentum itself is sitting on the fence. The 14-day Relative Strength Index reads between 53.48 and 54.93 across FXStreet and Investing.com data, squarely in neutral territory. That tells you neither buyers nor sellers have seized control, and the market is waiting for a catalyst before committing.
Here is what makes this setup so tense. A rising channel is pushing price up, while falling long-term averages are pressing it down. When those two lines converge, the pair squeezes into an ever-tighter range, and a breakout becomes a matter of when, not if.
Knowing these precise boundaries matters for you directly. It stops you buying into a false breakout that fizzles at 158, and it stops you panicking out of a position during what is only normal consolidation. It also gives you the logical points to place a stop-loss order rather than guessing.
For readers wanting to apply the same level of structured scenario mapping to other currency pairs they trade, our comprehensive walkthrough of forex technical analysis demonstrates the full five-step conditional framework using a live USD/MXN case study, including how to handle converging moving averages and RSI context.
| Key Level | Price Point | Technical Significance |
|---|---|---|
| Channel upper boundary | ~158.60 | Primary upside resistance; a clean break signals continuation |
| 50-day EMA | 158.08 | Dynamic resistance in sell territory, capping the advance |
| Current spot | 157.45-157.70 | Consolidation zone between support and resistance |
| Nine-day EMA | ~156.41 | First downside support |
| Channel floor | ~154.60 | Secondary support; a break exposes 152.10 |
When big ASX news breaks, our subscribers know first
Understanding the indicators driving the setup
Those numbers on the chart are only useful if you know what they actually tell you about how buyers and sellers are behaving. Three concepts do most of the work in this setup, and once you understand them here, you can read them on any currency pair you trade.
- Ascending channel: A pattern formed when price makes a series of higher highs and higher lows, contained within two upward-sloping parallel lines. In USD/JPY, that channel currently runs between roughly 154.60 at the floor and 158.60 at the ceiling. It signals that buyers keep stepping in at progressively higher prices.
- Exponential moving averages (EMAs): An EMA is an average of recent prices that weights the most recent data more heavily, so it reacts faster than a simple average. Traders watch it because price often bounces off it or stalls at it. The 50-day EMA at 158.08 is currently acting as dynamic resistance, meaning it moves with price but keeps rejecting attempts to push above it.
- Relative Strength Index (RSI): A momentum gauge that runs from 0 to 100, measuring the speed and size of recent price moves. Readings above 70 suggest a market is overbought, below 30 oversold. The current mid-50s reading sits in the middle, which tells you the rally has neither exhausted itself nor built decisive strength.
CME Group’s guide to moving averages explains precisely why EMAs respond faster to recent price action than simple averages, which is the property that makes the 50-day EMA at 158.08 a genuinely dynamic ceiling rather than a static line drawn on a chart.
Put together, these indicators show you a market that is cautiously optimistic but badly short of the momentum needed to smash through major historical ceilings. Without a fresh fundamental catalyst, the pair simply lacks the fuel to break out.
The psychology behind the channel
An ascending channel is a picture of measured accumulation. Each higher low means buyers were willing to pay more than they were the last time price dipped, and each higher high means sellers keep giving up ground.
That is persistent demand, but it is disciplined rather than euphoric. Nobody is chasing the market wildly; they are buying dips inside a defined structure.
For a trader, those boundaries become tools. The channel floor near 154.60 is where you might look to buy with a tight risk cushion below, while the ceiling near 158.60 is where you set profit targets or brace for rejection. The pattern hands you a ready-made map of where risk and reward sit.
The fundamental tug-of-war powering the trend
Charts tell you where the battle lines are. Central banks tell you which side has the ammunition. The relentless bid under USD/JPY comes down to one thing: the yawning gap between what the United States pays on its money and what Japan pays on its own.
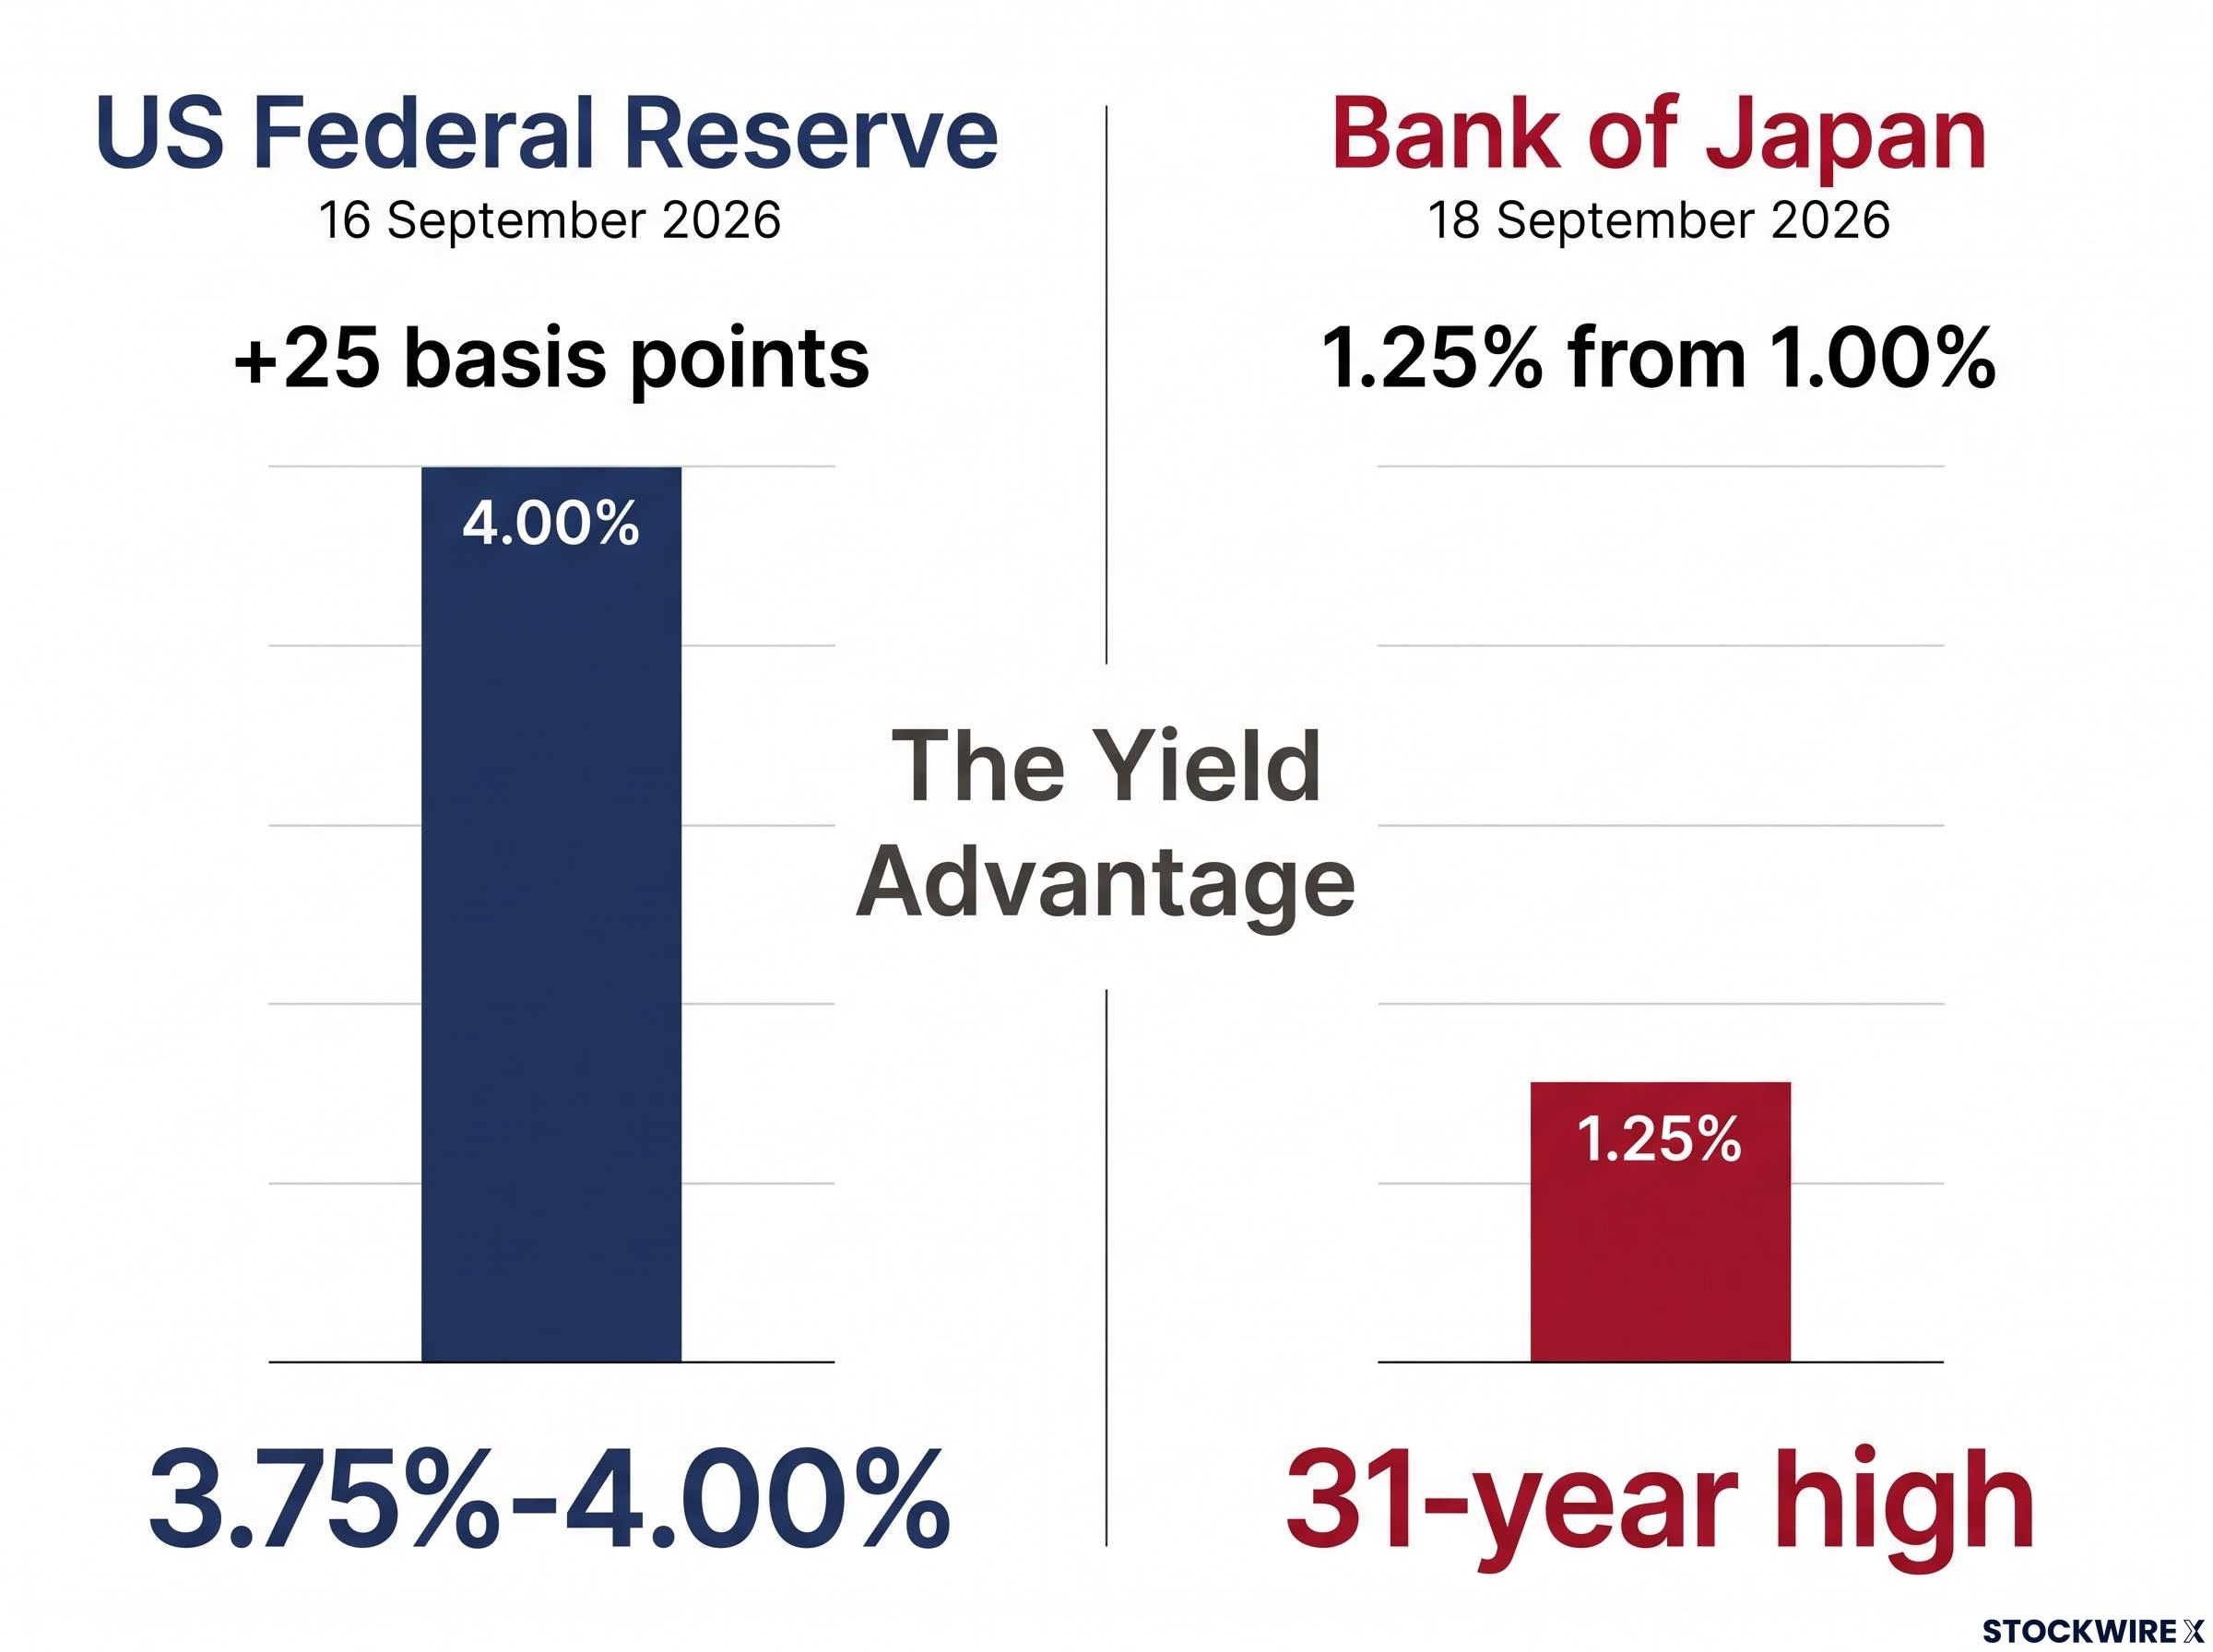
On 16 September 2026, the US Federal Reserve raised its target range by 25 basis points to 3.75%-4.00% and signalled more increases could follow, according to Reuters. Two days later, the Bank of Japan lifted its short-term rate target to 1.25% from 1.00% in a 7-2 vote, a 31-year high for Japanese policy rates.
Both banks tightened. But the direction of travel does not close the gap that matters, and that is the whole story.
Central bank rate transmission works through multiple channels simultaneously: the policy rate governs overnight interbank lending and flows into mortgage rates, business loan costs, and deposit rates before reaching the yield differentials that currency traders actually price, which is why a 25 basis point move by either the Fed or BoJ carries consequences well beyond the FX market.
The ongoing yield advantage
Even after the BoJ’s move, US rates sit almost three full percentage points above Japan’s. Holding dollars still pays you far more than holding yen, and that difference is the engine behind the carry trade.
A carry trade is where investors borrow in a low-yielding currency, the yen here, and buy a higher-yielding one, the dollar, pocketing the difference. As long as that spread stays wide, the structural incentive is to sell yen and buy dollars, which is exactly why traders keep buying the dips.
The Fed’s own projections reinforce this. FOMC forecasts point to a long-run policy rate of 3.2%, and OANDA’s MarketPulse noted that 12 of 18 policymakers projected another hike before year-end. That keeps the yield advantage firmly in the dollar’s corner.
Geopolitics adds a second layer of dollar demand. Heightened tensions in the Middle East, described by the original source as an ongoing driver, push investors toward the dollar as a haven and lift energy prices, which weakens the yen further given Japan’s reliance on imported fuel.
Connecting the chart to central bank policy is how you judge whether a breakout has staying power. A technical break above 158.60 backed by this rate gap is far more credible than one running on momentum alone.
Navigating the asymmetry of intervention risk
Here is the danger that no moving average will warn you about. USD/JPY tends to grind higher slowly, session by session, then can gap violently lower in minutes when Japanese authorities strike. That is asymmetric risk, and it is the defining feature of trading this pair right now.
The warnings are already flashing. On 18 September 2026, Reuters reported that Japanese authorities conducted “rate checks” in the FX market after the dollar jumped following the BoJ hike, a step the Nikkei describes as a preliminary move before direct intervention.
Japan’s top currency diplomat Atsushi Mimura told reporters on 4 September 2026 that he remained “on alert” to exchange-rate moves, keeping alive Tokyo’s warning on its readiness to intervene against excessive yen declines.
History shows these are not idle threats. In late July and early August 2026, Japan and the United States launched a rare joint yen-buying intervention, and WisdomTree estimated one single-day operation at around US$52.8 billion, described as possibly the largest on record (a figure not independently confirmed).
The coordinated intervention mechanics of the August 2026 operation reveal an important structural detail: the US deliberately sold euro reserves rather than dollars or Treasuries, because flooding the Treasury market with supply at that fiscal moment would have pushed yields higher and compounded the problem Washington was trying to contain.
The precedents stretch back further. Japan first intervened in September 2022 near 145, and its most aggressive defences have clustered as the pair climbed toward the low-160s, including the multi-decade peak of 163.99 recorded in July. Analysts infer the trigger zone has drifted upward over time, but authorities react most sharply to the speed of a move, not just the level.
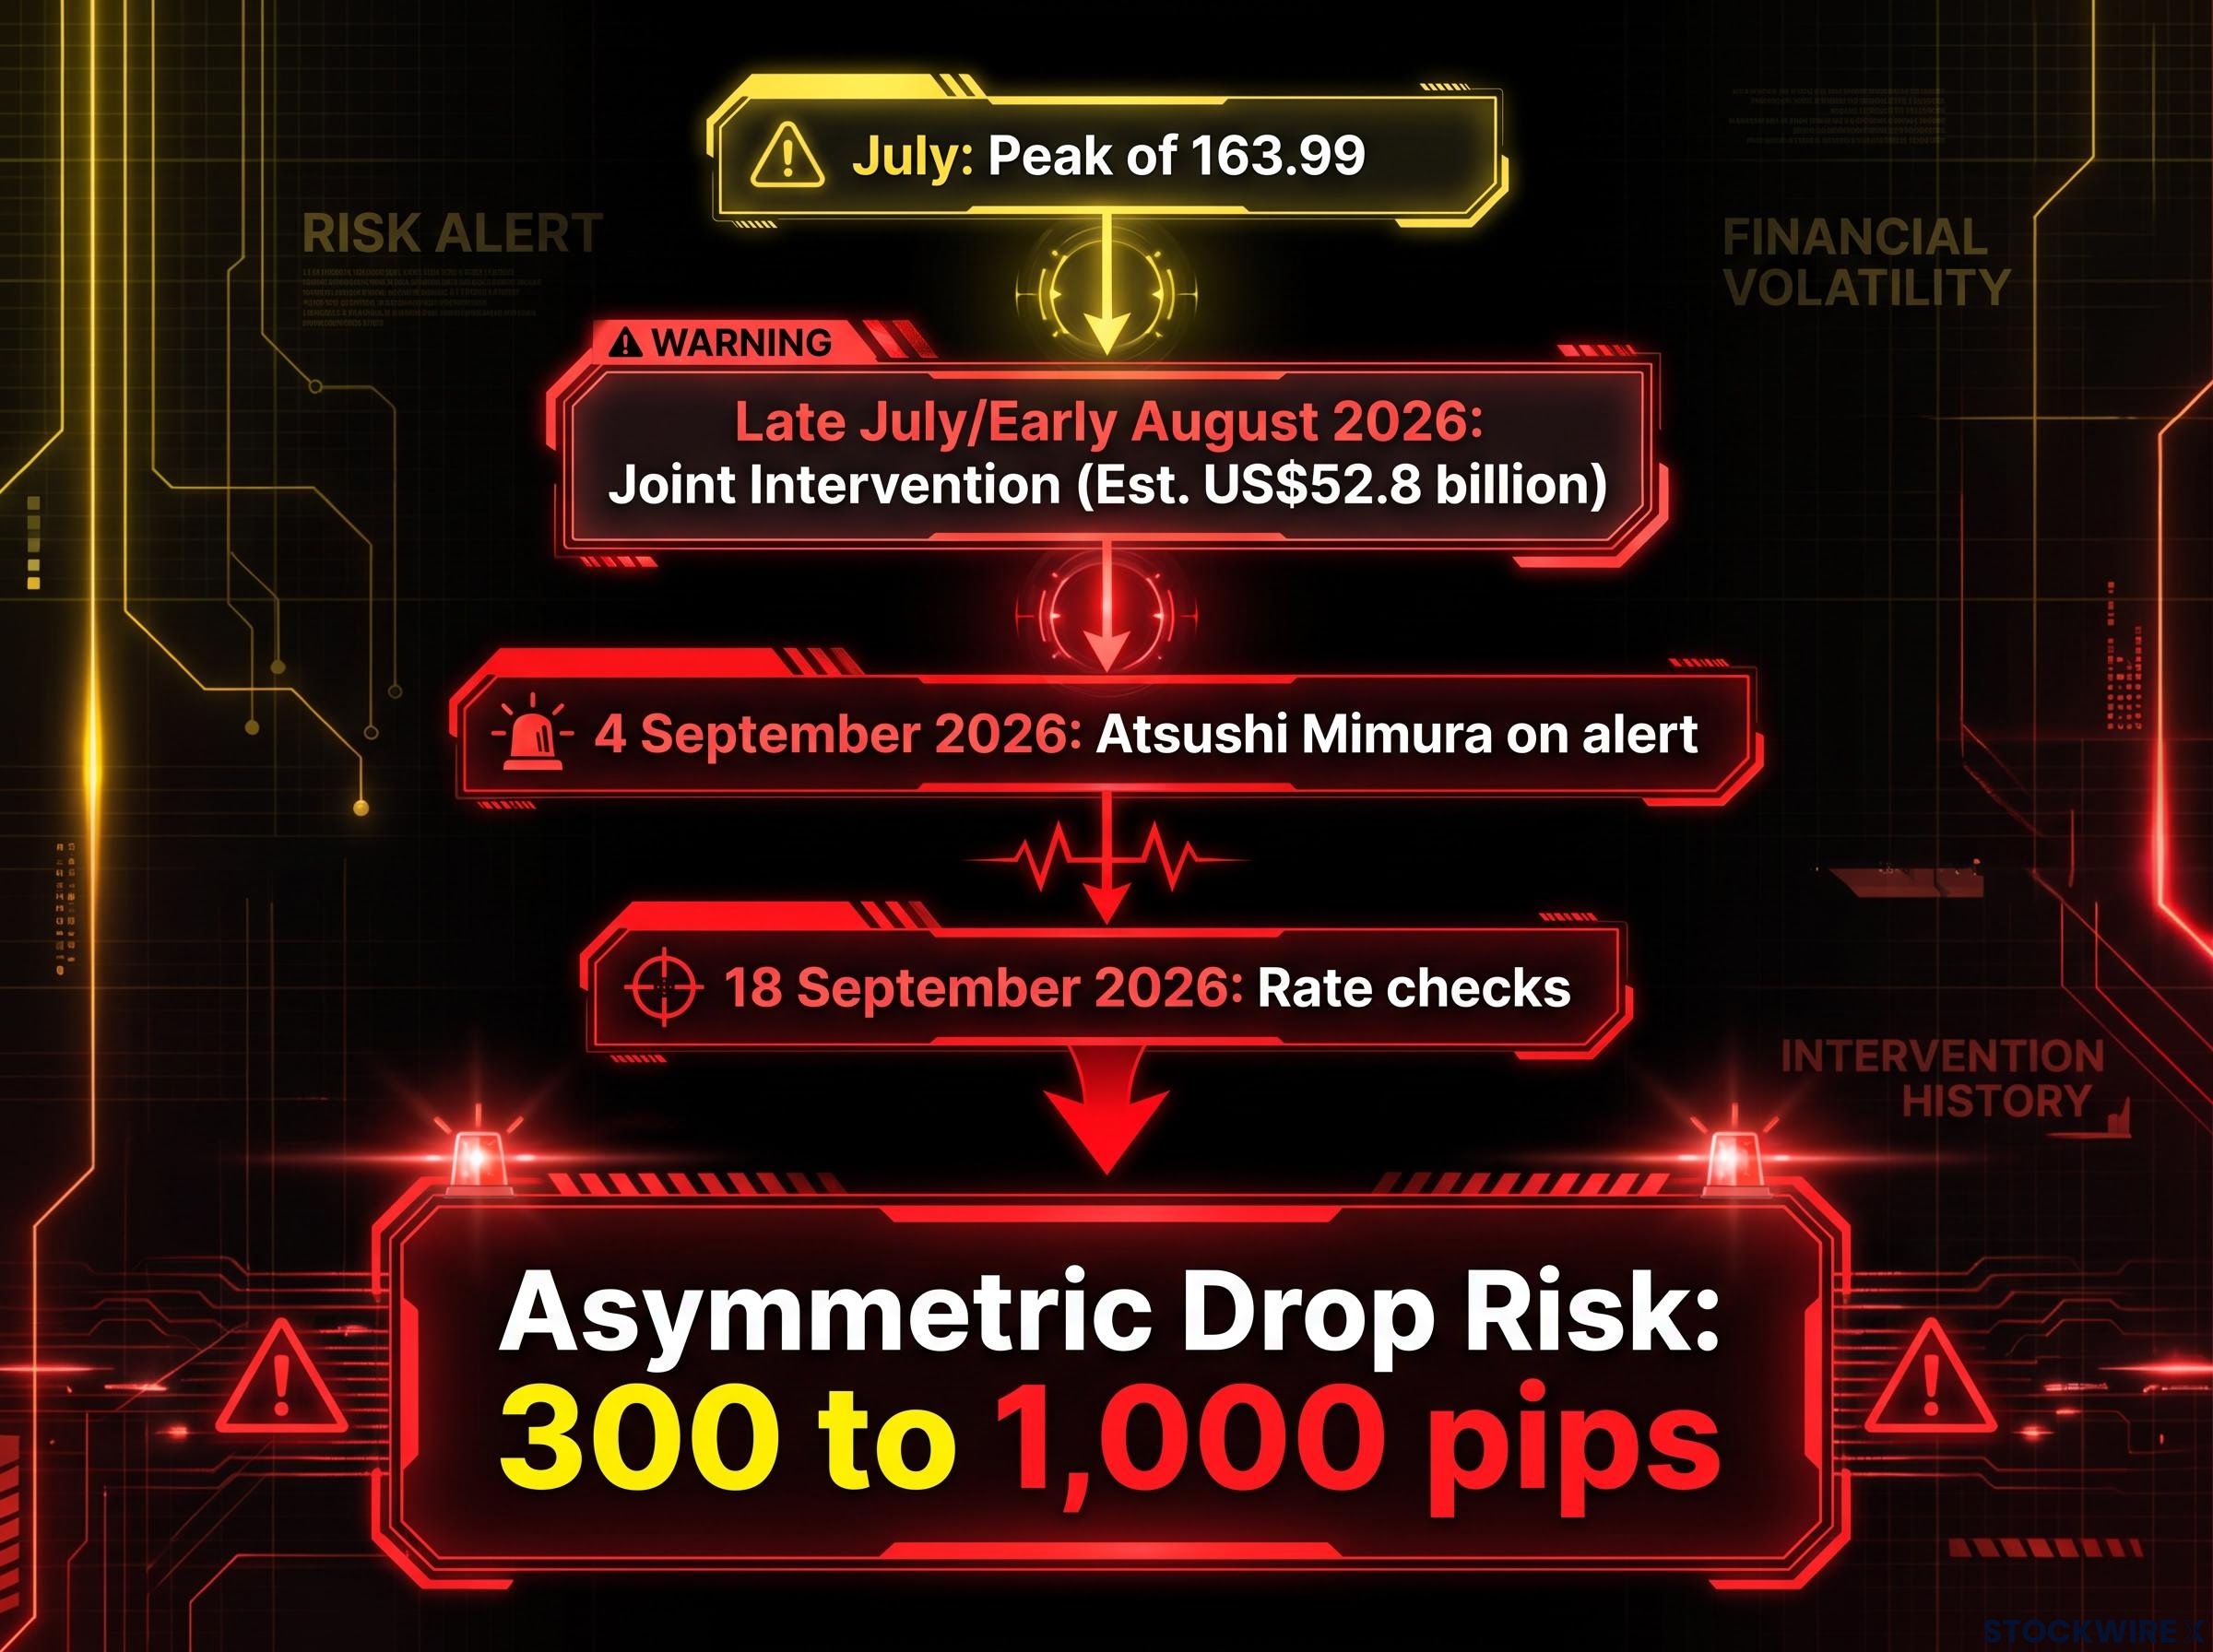
The practical stakes are severe. Investing.com has warned that a surprise intervention or a soft US inflation print could trigger asymmetric drops of 300 to 1,000 pips, often in thin liquidity where losses compound fast.
For you, this means a sudden policy trigger could erase weeks of technical gains in the time it takes to read a headline. That is why position sizing, not just stop placement, is the real defence here. Tail risks like these never appear on a standard chart.
Formulating a strategy in a top-heavy market
The picture that emerges is a market pulled hard in two directions. Wide rate differentials keep rewarding dollar buyers and pushing the pair up, while a wall of long-term resistance and the ever-present threat of intervention cap the upside and threaten sudden reversals.
That leaves you with a clear watch list. A decisive break above the 158.60 channel ceiling, ideally confirmed by the rate backdrop, would signal continuation toward the policy-sensitive zone above 160. A break below 154.60 support opens the door toward the 152.10 trough and suggests the bullish structure is cracking.
Above all, trade this pair aware that headlines, not charts, may dictate the next big move. In a market this top-heavy, disciplined position sizing matters more than picking the perfect entry.
Fixed-dollar-risk sizing is the practical tool behind that discipline: once a stop is placed on the chart, the formula computes position size as dollar risk divided by the distance to the stop, which removes all discretion from the sizing step and prevents conviction from inflating exposure ahead of a binary catalyst like an intervention announcement.
This article is for informational purposes only and should not be considered financial advice. Investors should conduct their own research and consult with financial professionals before making investment decisions. Past performance does not guarantee future results, and these statements are speculative and subject to change based on market developments.