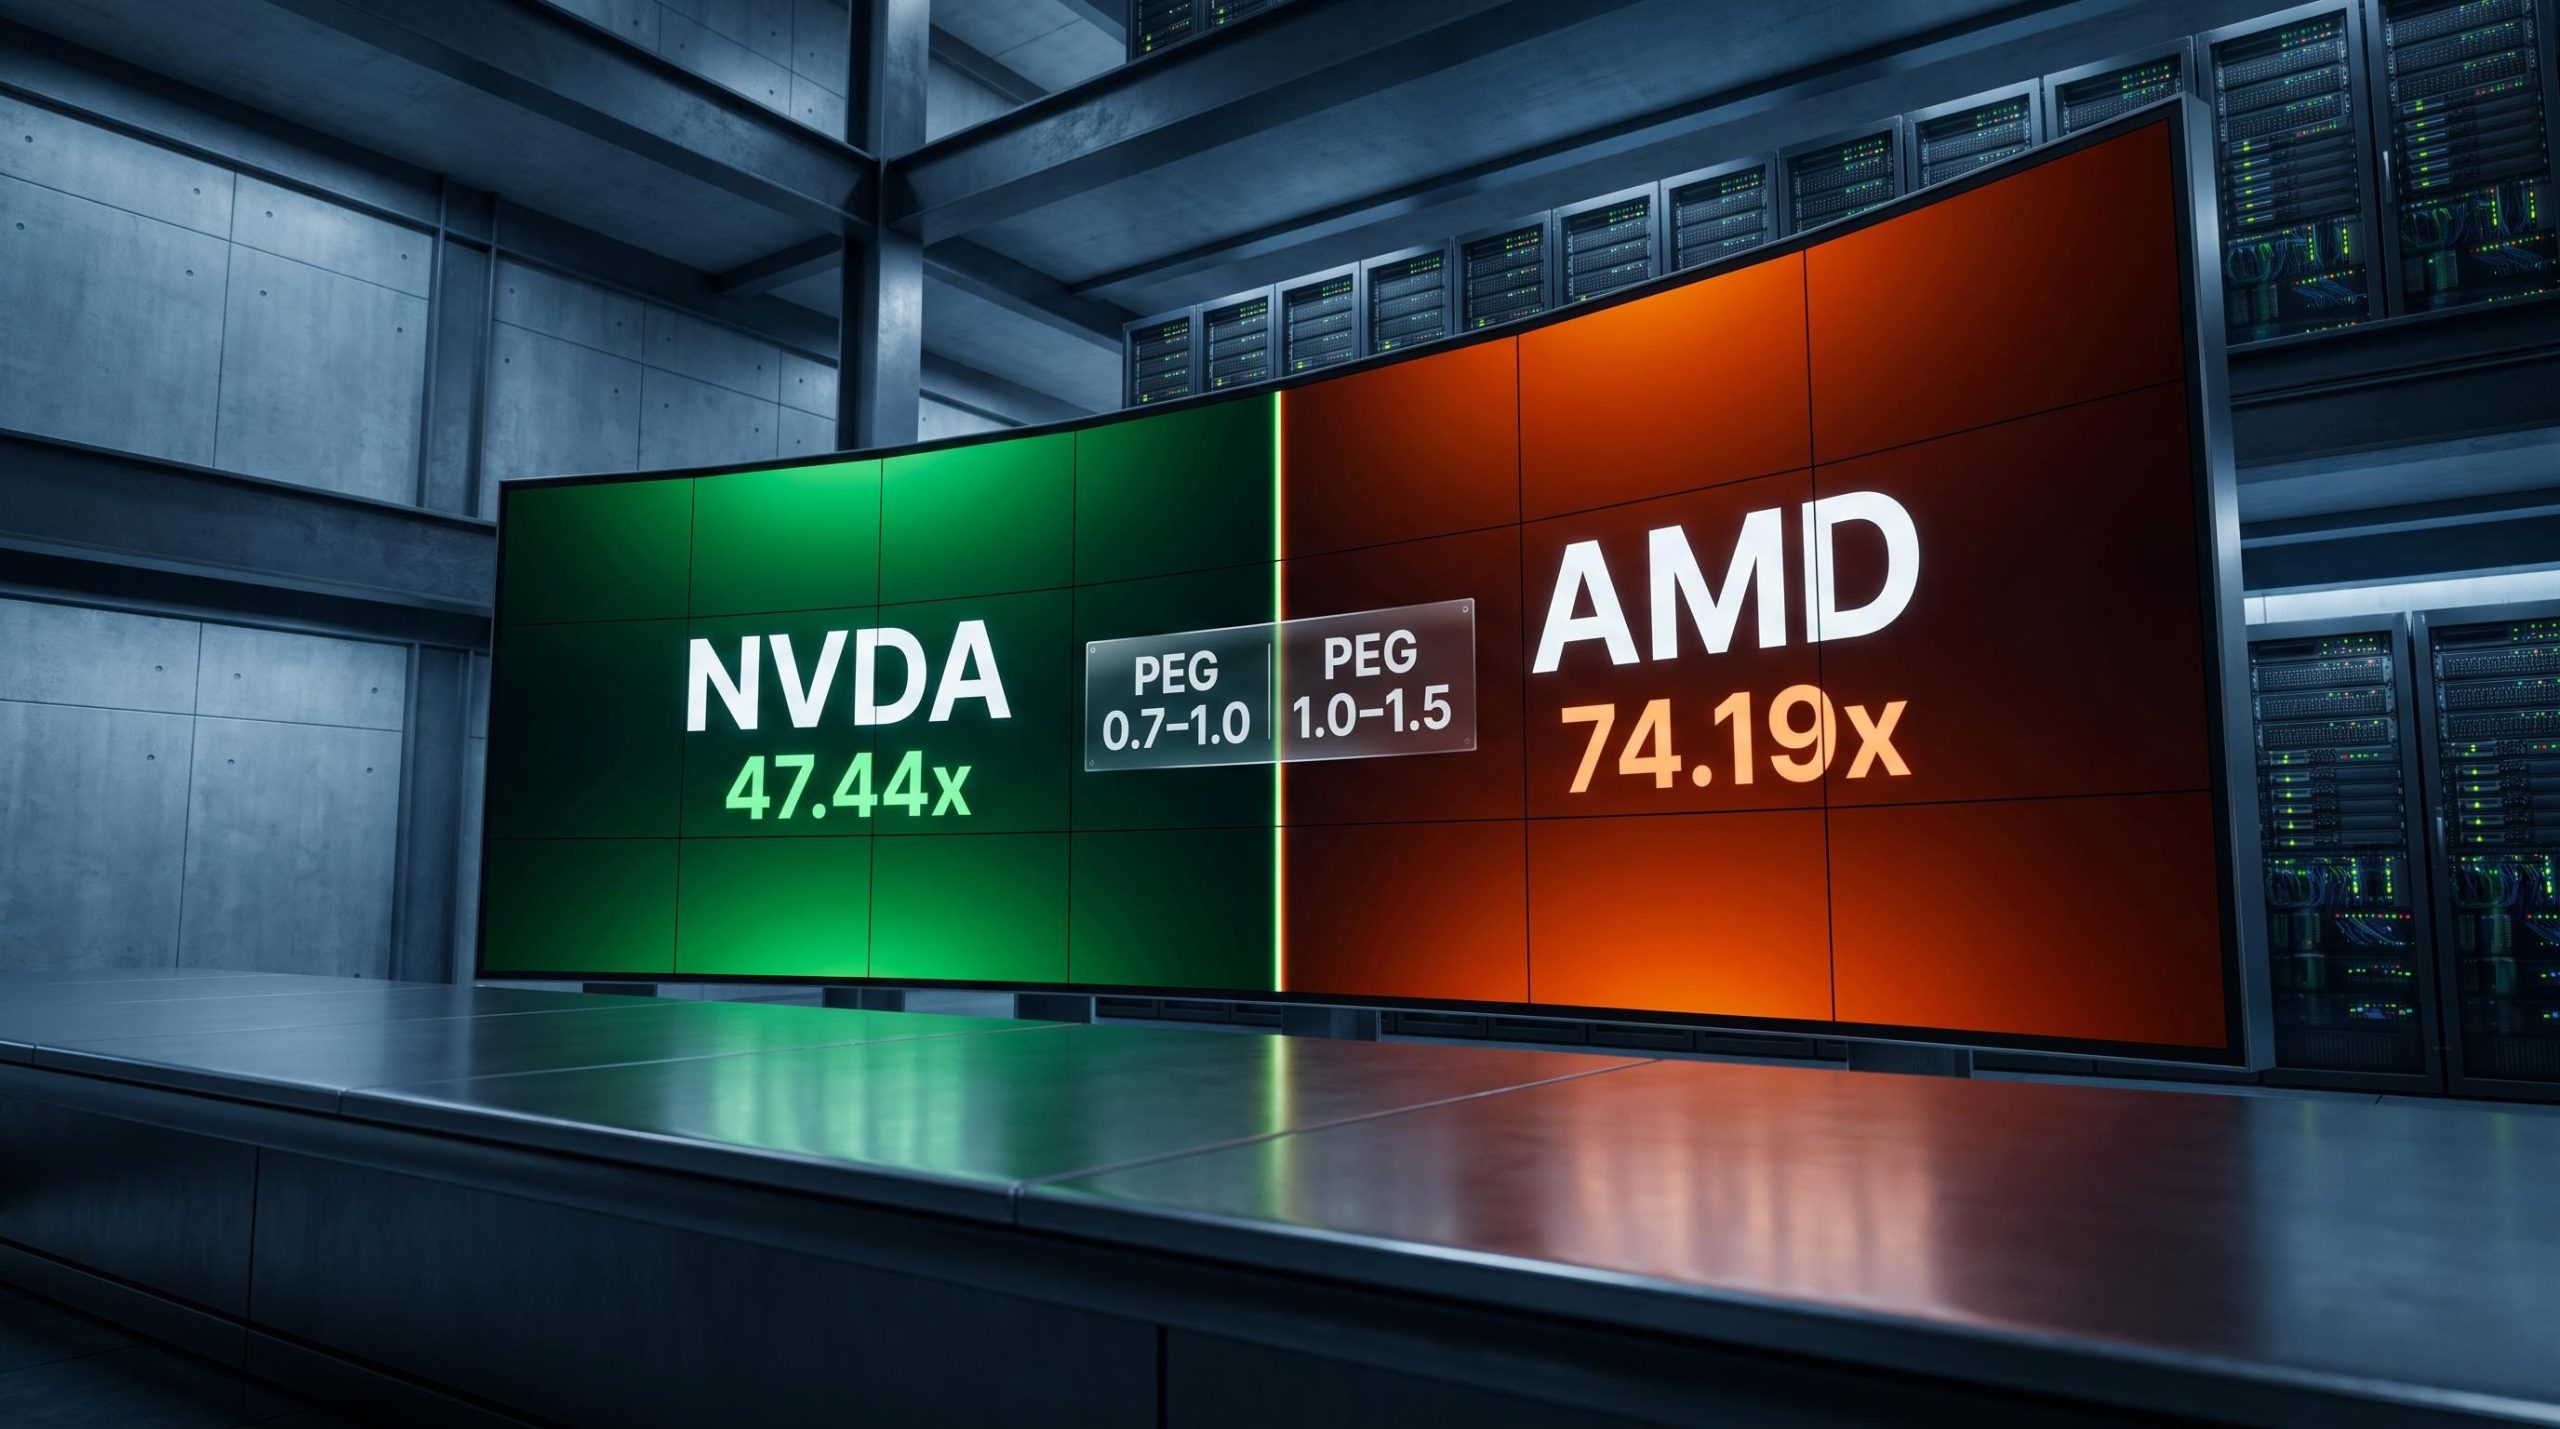
Nvidia has become the stock most people reach for when they want exposure to artificial intelligence. So here is something that should stop you: right now, Nvidia trades at a lower trailing earnings multiple than AMD, its smaller rival in the same AI semiconductor race. Sit with that for a moment, because it runs against almost every instinct the headlines have trained into investors.
Two companies are riding the same wave of demand for AI computing chips. Both carry strong analyst conviction. Both have posted growth that would have seemed implausible a few years ago. Yet the market prices them as if they are entirely different propositions, and that gap is not an accident. It reflects where each company actually sits in the AI infrastructure stack and how much future performance the market has already agreed to pay for.
Here is what the data actually tells you about whether the valuation gap between these two stocks is justified, and which entry point rests on a more defensible set of assumptions. The comparison is not about which company builds better chips. It is about which price asks less of the future.
Why Nvidia’s numbers look like a different business entirely
Start with the scale, because the scale is the thing that reframes everything else. For its most recent quarter (Q2 FY27, ended July 2026), Nvidia reported $96.221 billion in revenue, a 106% jump on the same quarter a year earlier. That is not a growth rate you associate with a company already valued in the trillions.
What makes that output structurally durable is where Nvidia sits in the AI value chain. It supplies the foundational computing infrastructure, the GPUs that everyone building AI systems needs first. That “picks-and-shovels” position insulates it from much of the working capital pressure felt further down the chain, where buyers carry the risk of turning expensive silicon into profitable products.
The margin figure is where this positioning becomes visible. Nvidia posted a gross margin of 75.0% on both a GAAP and non-GAAP basis for the quarter.
A 75% gross margin on a hardware business For a company that sells physical chips, this is remarkable. It tells you Nvidia is operating more like a software platform than a traditional chipmaker, extracting pricing power from GPU compute that is extraordinarily difficult for any competitor to replicate.
That pricing power flows straight through to cash. Over the trailing twelve months, Nvidia generated roughly $193 billion in operating cash flow against net income of about $134 billion, supporting a free cash flow yield of between 2.09% and 2.30%.
There is one caveat worth holding. Nvidia’s inventory has scaled sharply, climbing from around $7.65 billion in July 2024 to $31.58 billion by July 2026. That signals genuine demand and rising supply commitments, but it is a number to watch rather than dismiss.
| Metric | Nvidia | AMD |
|---|---|---|
| Revenue (latest quarter) | $96.221B | $11.536B |
| Year-over-year growth | 106% | 50% |
| Gross margin (GAAP) | 75.0% | 54% |
| Operating cash flow (TTM) | ~$193B | ~$8.4B |
| FCF yield | 2.09%-2.30% | ~0.8% |
The moderate valuation multiples Nvidia carries start to make sense once you see the margin architecture underneath the revenue. This is a business generating software-like economics at hardware scale, which is precisely why its size does not inflate its multiple the way you might expect.
When big ASX news breaks, our subscribers know first
AMD’s data-centre pivot is real, but the market is pricing in perfection
AMD is a genuinely different story than it was two years ago, and that deserves full credit before any scepticism enters. For Q2 2026, AMD posted record revenue of $11.536 billion, up 50% year-over-year and 13% sequentially.
The engine behind that is the data-centre segment, which grew 107% year-over-year to $6.718 billion and now accounts for somewhere between 52% and 58% of total revenue. This is a real structural mix shift, driven by EPYC server CPUs and Instinct data-centre AI GPUs, not a cyclical bump that fades next quarter. Management forecasts data-centre revenue growth of 60% over the next three to five years.
The ROCm software ecosystem is the single most binary variable in the AMD long-term investment thesis, because AMD’s AI accelerator revenue stays hyperscaler-dependent until ROCm reaches mainstream enterprise accessibility, which the MI400 generation is expected to test.
What the margin trajectory tells you
The margin story supports the transformation narrative. AMD’s non-GAAP gross margin reached 56% for the quarter (54% on a GAAP basis), reportedly more than 200 basis points higher year-over-year and 80 basis points higher sequentially, a direct benefit of the richer data-centre mix.
That improvement is real, but it remains roughly 19 percentage points below Nvidia’s 75%. That gap is not a rounding error; it is the difference that explains why AMD’s cash generation lags so far behind.
Here is the forward-looking read. AMD’s margin story is genuine but early-stage, and at today’s price, investors are paying now for a margin profile that has not yet arrived.
What the market has already priced in
This is where the valuation figures do the unsettling work. AMD’s stock appreciated roughly 232% over the one-year period into late 2026, pushing its multiples to stretched levels.
- Trailing P/E: cited in a range of 143x to 194x depending on the source and reporting window
- Forward P/E: exceptionally dispersed, ranging from 30.64x to 87.06x
- FCF yield: approximately 0.8%, against Nvidia’s 2.09% to 2.30%
- Insider selling: a persistent pattern flagged by some analysts alongside weakening price momentum
- Analyst price target range: a strikingly wide $235 at the low end to $1,250 at the high end
That FCF yield of 0.8% is the number to hold onto. It tells you the current price embeds almost no margin of safety on a cash-generation basis, which means any slowdown in data-centre uptake would land on the stock with outsized force.
Some analysts have flagged the risk/reward as unfavourable, citing a ratio around 1.31-to-1. The business transformation is compelling. Whether the entry price is defensible is a separate question entirely, and the valuation data is what makes that distinction visible.
What PEG ratios and sector comparisons reveal about relative value
Comparing two high-growth stocks on raw P/E alone is misleading, because it ignores the growth each is expected to deliver. When companies grow at materially different rates, the more honest lens is the Price/Earnings-to-Growth (PEG) ratio, which divides the P/E by the expected earnings growth rate. A PEG below 1.0 suggests you are paying less for each unit of growth; above 1.0 suggests you are paying more.
The instability of AMD’s trailing P/E range (143x to 194x depending on reporting window) is a textbook illustration of why valuation metrics beyond P/E matter: PEG, P/FCF, and EV/EBITDA each resolve a specific failure mode that raw earnings multiples cannot handle for high-growth, capital-intensive businesses.
On that basis, the two stocks separate cleanly. Nvidia trades at a PEG of 0.7 to 1.0, incorporating expected EPS growth of 25% to 35%. AMD trades at a PEG of 1.0 to 1.5, on expected growth of 30% to 40%.
The read is direct: investors are paying a richer premium for each unit of expected growth at AMD, embedding more optimistic assumptions about its long-term market capture than Nvidia’s price requires.
| Stock | Trailing P/E | Forward P/E (mid) | PEG Ratio | FCF Yield |
|---|---|---|---|---|
| Nvidia | ~28x | ~21x | 0.7-1.0 | 2.09%-2.30% |
| AMD | 143x-194x | ~59x | 1.0-1.5 | ~0.8% |
The sector context sharpens the picture further. An August 2026 cross-sectional study found AI-exposed semiconductor stocks averaging a 55.80x P/E, against 43.54x for non-AI peers.
The counterintuitive anchor Nvidia’s sector P/E of 47.44x sits below the AI semiconductor average of 55.80x. The stock most synonymous with the AI trade is, on a peer-relative basis, not the most expensively priced one in its own group.
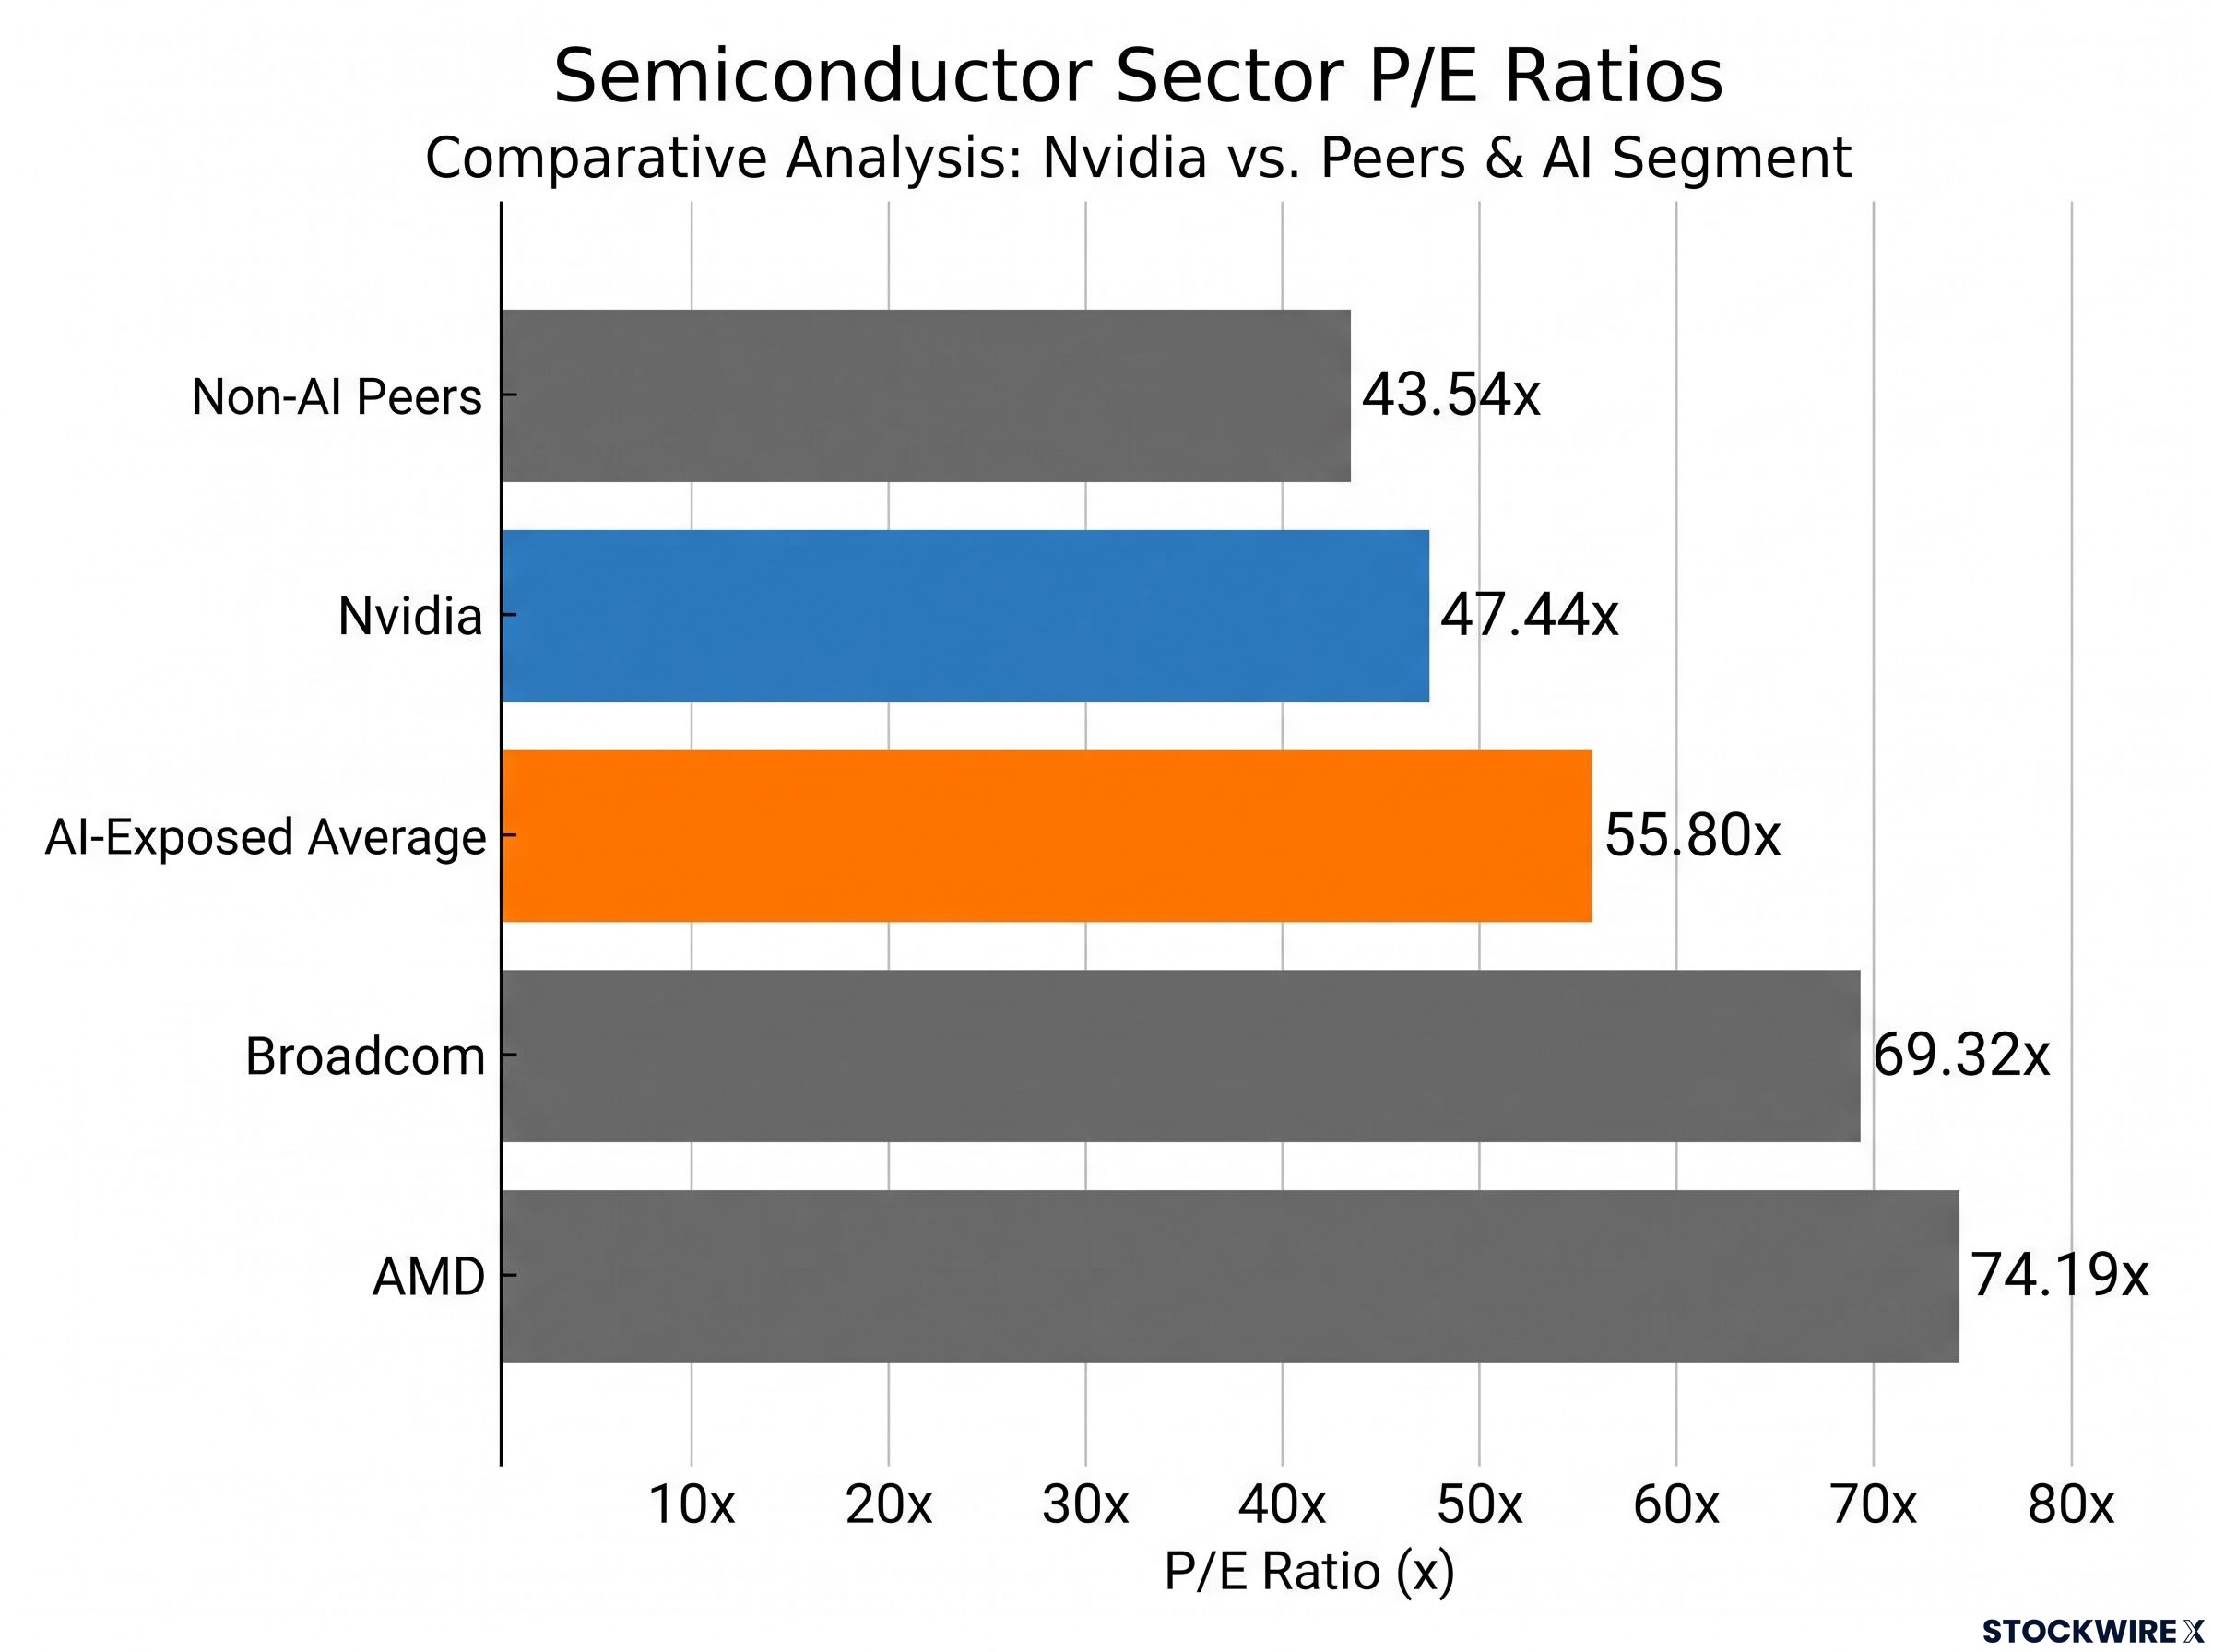
By contrast, AMD sits at 74.19x and Broadcom at 69.32x, both well above the sector average. That is the figure that should make you update your assumptions: being the face of the AI trade and being the most expensive AI stock are not the same thing.
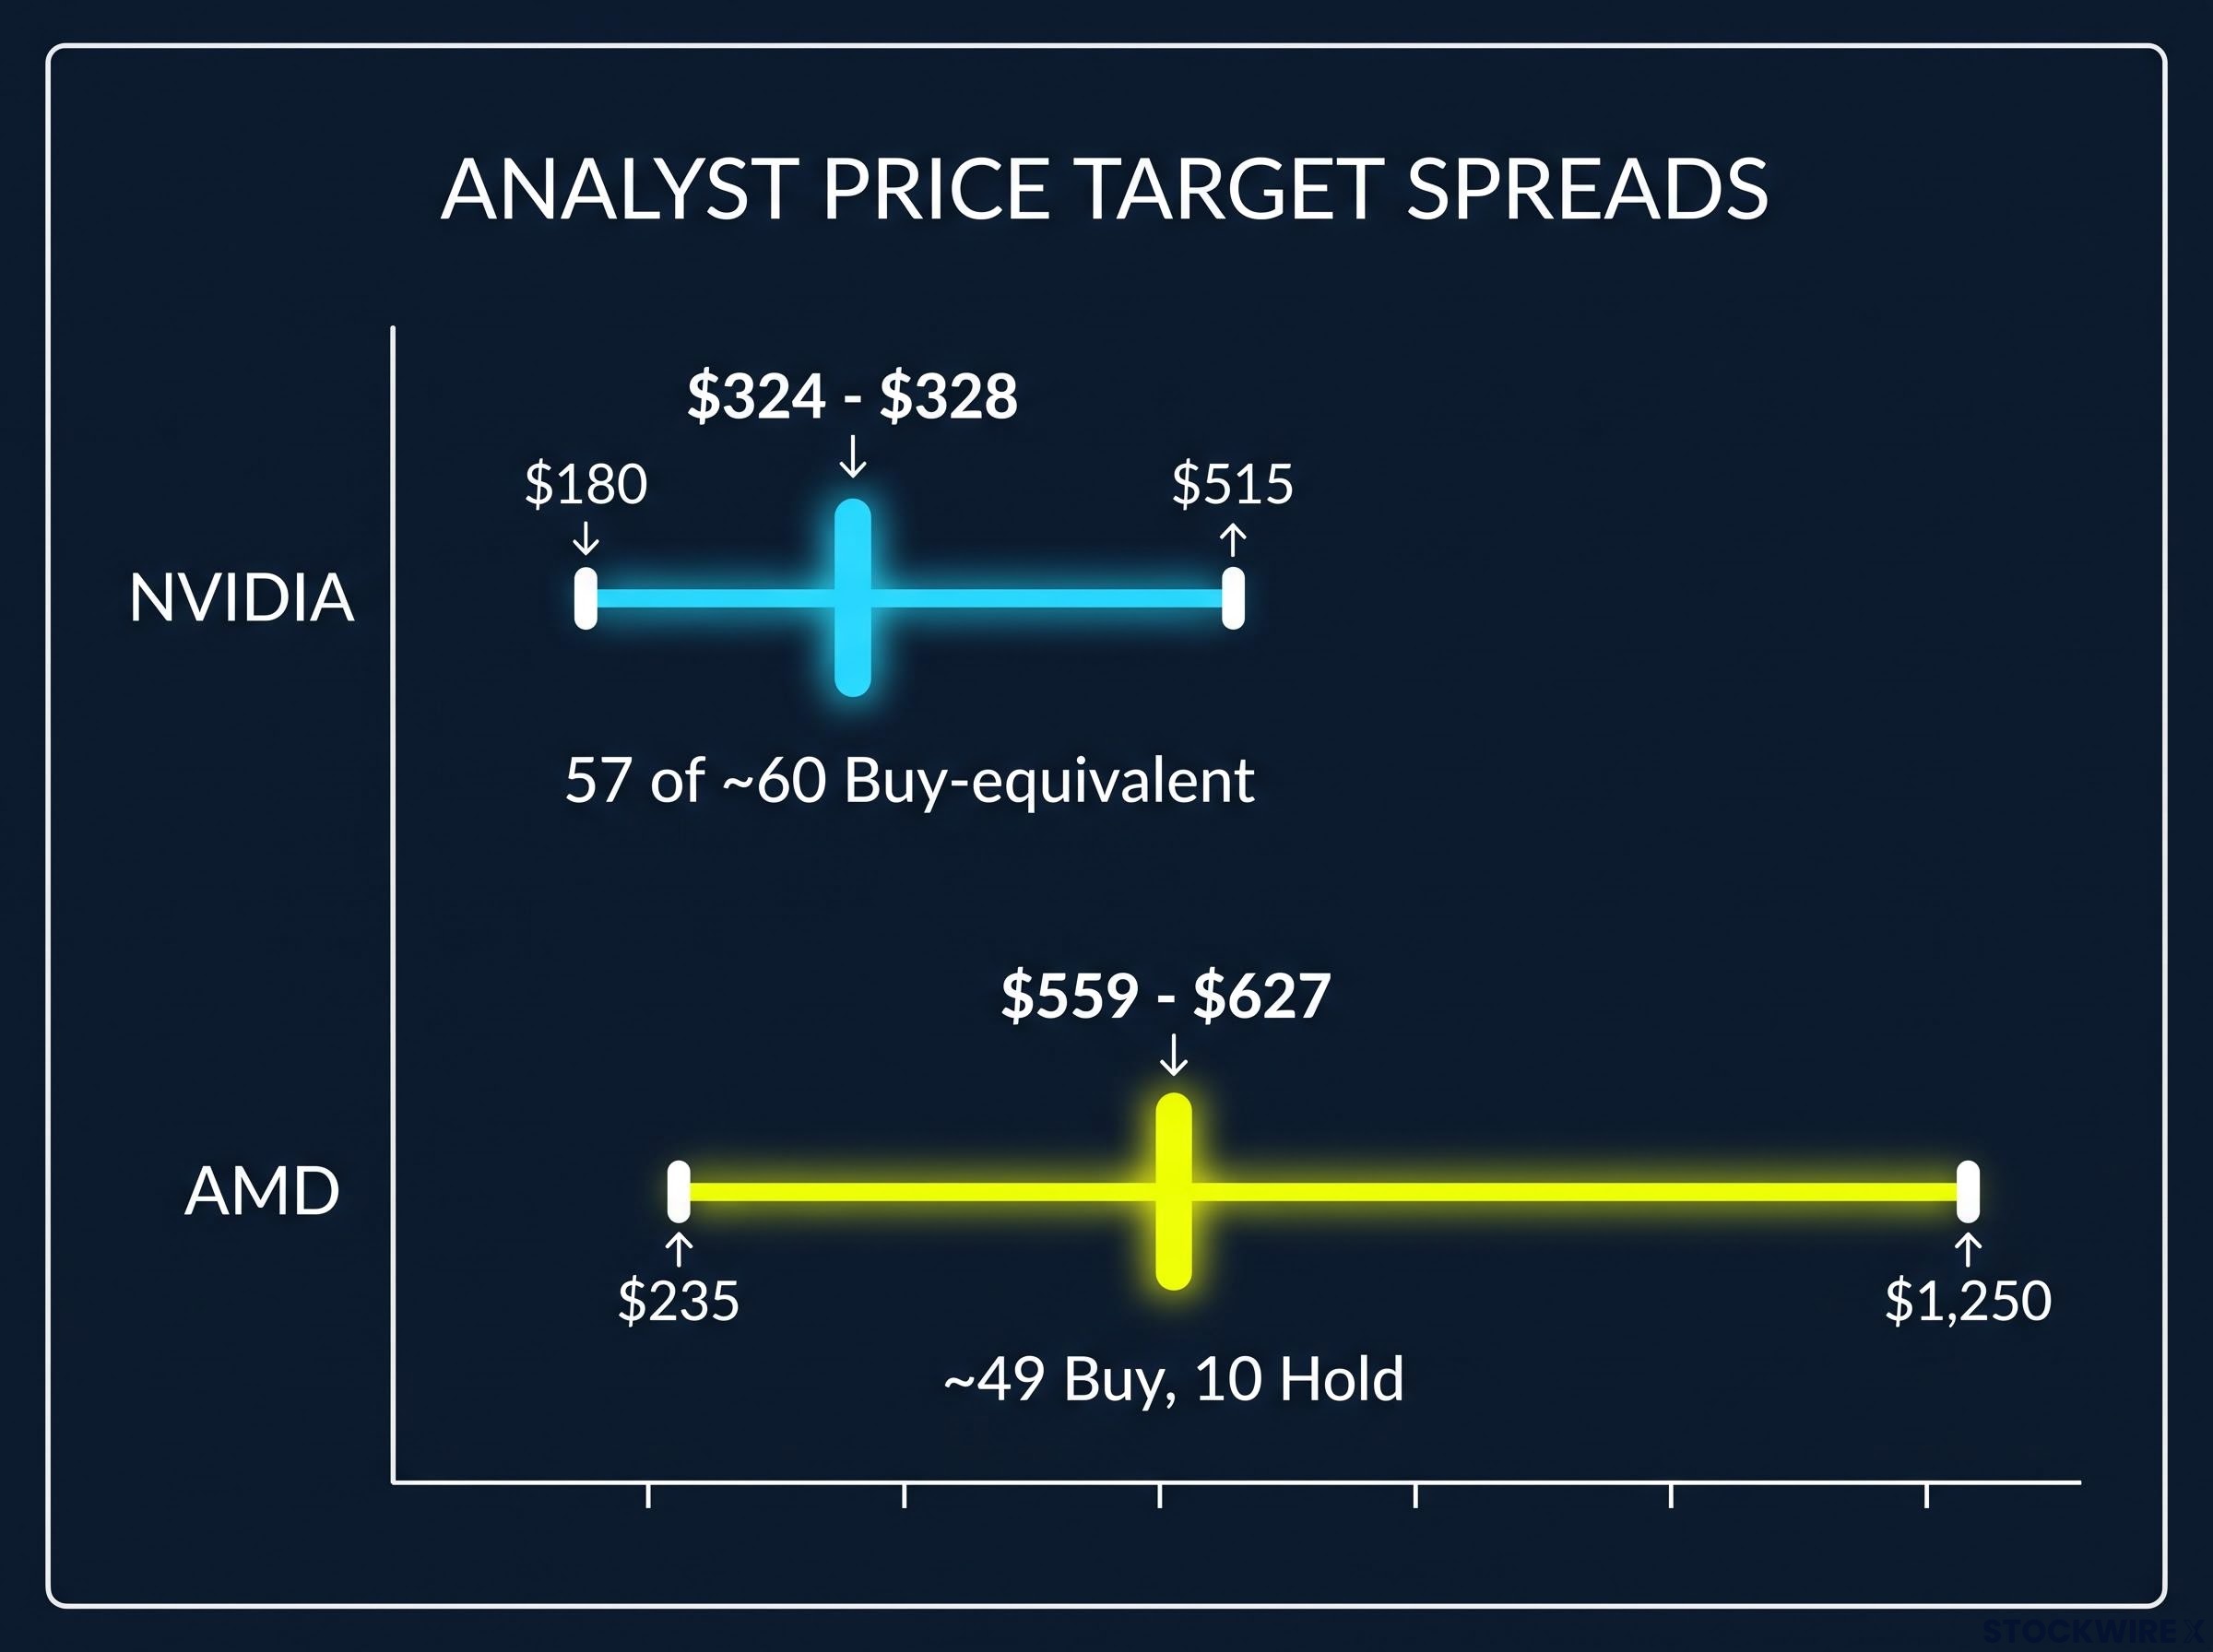
Analyst positioning reinforces the divergence without resolving it. For Nvidia, 57 of roughly 60 analysts hold a buy-equivalent rating or higher, with an average 12-month target of $324 to $328 (range $180 to $515) and EPS estimates revised upward by more than 22% over 90 days. For AMD, around 49 Buy and 10 Hold ratings sit behind an average target of $559 to $627, a target range of $235 to $1,250, and 28 upward EPS revisions against 9 downward in a recent month.
The fundamentals framework: thinking about each stock as an investment decision
Strip away the noise, and the commercial question is simple: given these valuations, which stock offers a more defensible entry, and for whom does each make sense? The answer is not about technology roadmaps. It is about how much execution risk you are willing to price in today.
The Nvidia case
Nvidia is the lower-assumption position. Its 75% gross margin architecture generates cash at a scale AMD cannot yet match, its 47.44x sector P/E sits below the AI peer average, and analyst conviction is near-unanimous. The current price does not require flawless execution to be justified, because the margin and cash-flow base is already there.
A separate dimension of Nvidia’s valuation story sits in its capital return policy: with a dividend yield of approximately 0.02%, the stock is structurally excluded from income fund mandates, and Bank of America analysts have argued that lifting that yield to 0.5%-1.0% could catalyse a multiple re-rating independent of the AI demand case.
The valuation crosscheck agrees. Nvidia trades at roughly 9.1x next-twelve-month revenue on an enterprise-value basis (an estimate, not independently confirmed), which is demanding but not extreme for the growth on offer.
The main operational caveat is inventory. That climb to $31.58 billion from $7.65 billion two years earlier is the one number that could signal a supply-demand imbalance if revenue growth cools.
The AMD case
AMD is the higher-upside, higher-assumption position. The transformation is real, with management targeting a slice of an AI data-centre total addressable market it projects could reach $1 trillion, and overall revenue projected to grow 35% over five years from a roughly $34 billion base.
But the price embeds near-flawless execution across multiple years of data-centre expansion. That makes AMD far more sensitive to any guidance revision or competitive disruption, because a 0.8% FCF yield leaves no cushion.
- Nvidia suits you if you have a lower tolerance for assumption-heavy pricing and value margin strength and cash-flow certainty over maximum upside.
- AMD suits you if you carry higher risk tolerance, hold genuine conviction in AMD’s market-share capture story, and have a longer time horizon for margin expansion to materialise.
The shared risks both positions carry
Neither stock is insulated from the same forces. Both face high semiconductor manufacturing costs, a persistent industry-wide pressure, and both depend on the AI data-centre capital expenditure cycle holding up.
Both also carry the sector-wide premium. With AI-exposed peers averaging 55.80x P/E against 43.54x for non-AI names, a broader cooling in technology spending would expose both stocks to elevated drawdown risk. A shift in macro sentiment does not distinguish between them.
What the valuation gap actually tells you, and where the data points from here
The durable principle to carry away is this: the valuation gap between Nvidia and AMD is not a market error waiting to be corrected. It is a rational, if debatable, pricing of the different stages each company occupies in the AI infrastructure buildout. Nvidia is priced as an entrenched infrastructure supplier; AMD is priced as a challenger still proving its margin story.
What the data cannot tell you matters just as much. It cannot tell you which technology roadmap proves more durable over three to five years, or where the AI data-centre capex cycle finally settles. Those are the variables that will ultimately resolve the debate, and they remain genuinely open.
How far the professionals disagree Nvidia’s analyst price targets span $180 to $515. AMD’s span $235 to $1,250. When the professionals disagree this widely, conviction in AI semiconductor pricing is high in direction but deeply uncertain in magnitude, and humility about your own price target is the more defensible posture.
To keep this analysis current, watch three signals:
- AMD’s gross margin trajectory toward or away from the 60% non-GAAP threshold, as a read on how mature the data-centre mix shift really is.
- Nvidia’s inventory position relative to revenue growth, as a leading indicator of whether supply and demand stay in balance.
- Hyperscaler data-centre capex guidance, since the largest cloud buyers are the ultimate customers for both companies and the macro input that moves both stocks.
The hyperscaler backlog data, more than $2.3 trillion in legally contracted, undelivered commitments across Amazon, Alphabet, Microsoft, and Oracle, is the structural anchor that separates the current AI buildout from prior speculative cycles and underpins the demand visibility both Nvidia and AMD are pricing off.
Nvidia’s upward EPS revisions of more than 22% over 90 days and AMD’s 28-versus-9 upward revision balance both point to positive near-term momentum. The difference in valuation tells you how much of that momentum each price has already claimed.
This article is for informational purposes only and should not be considered financial advice. Investors should conduct their own research and consult with financial professionals before making investment decisions. Past performance does not guarantee future results. Financial projections are subject to market conditions and various risk factors.