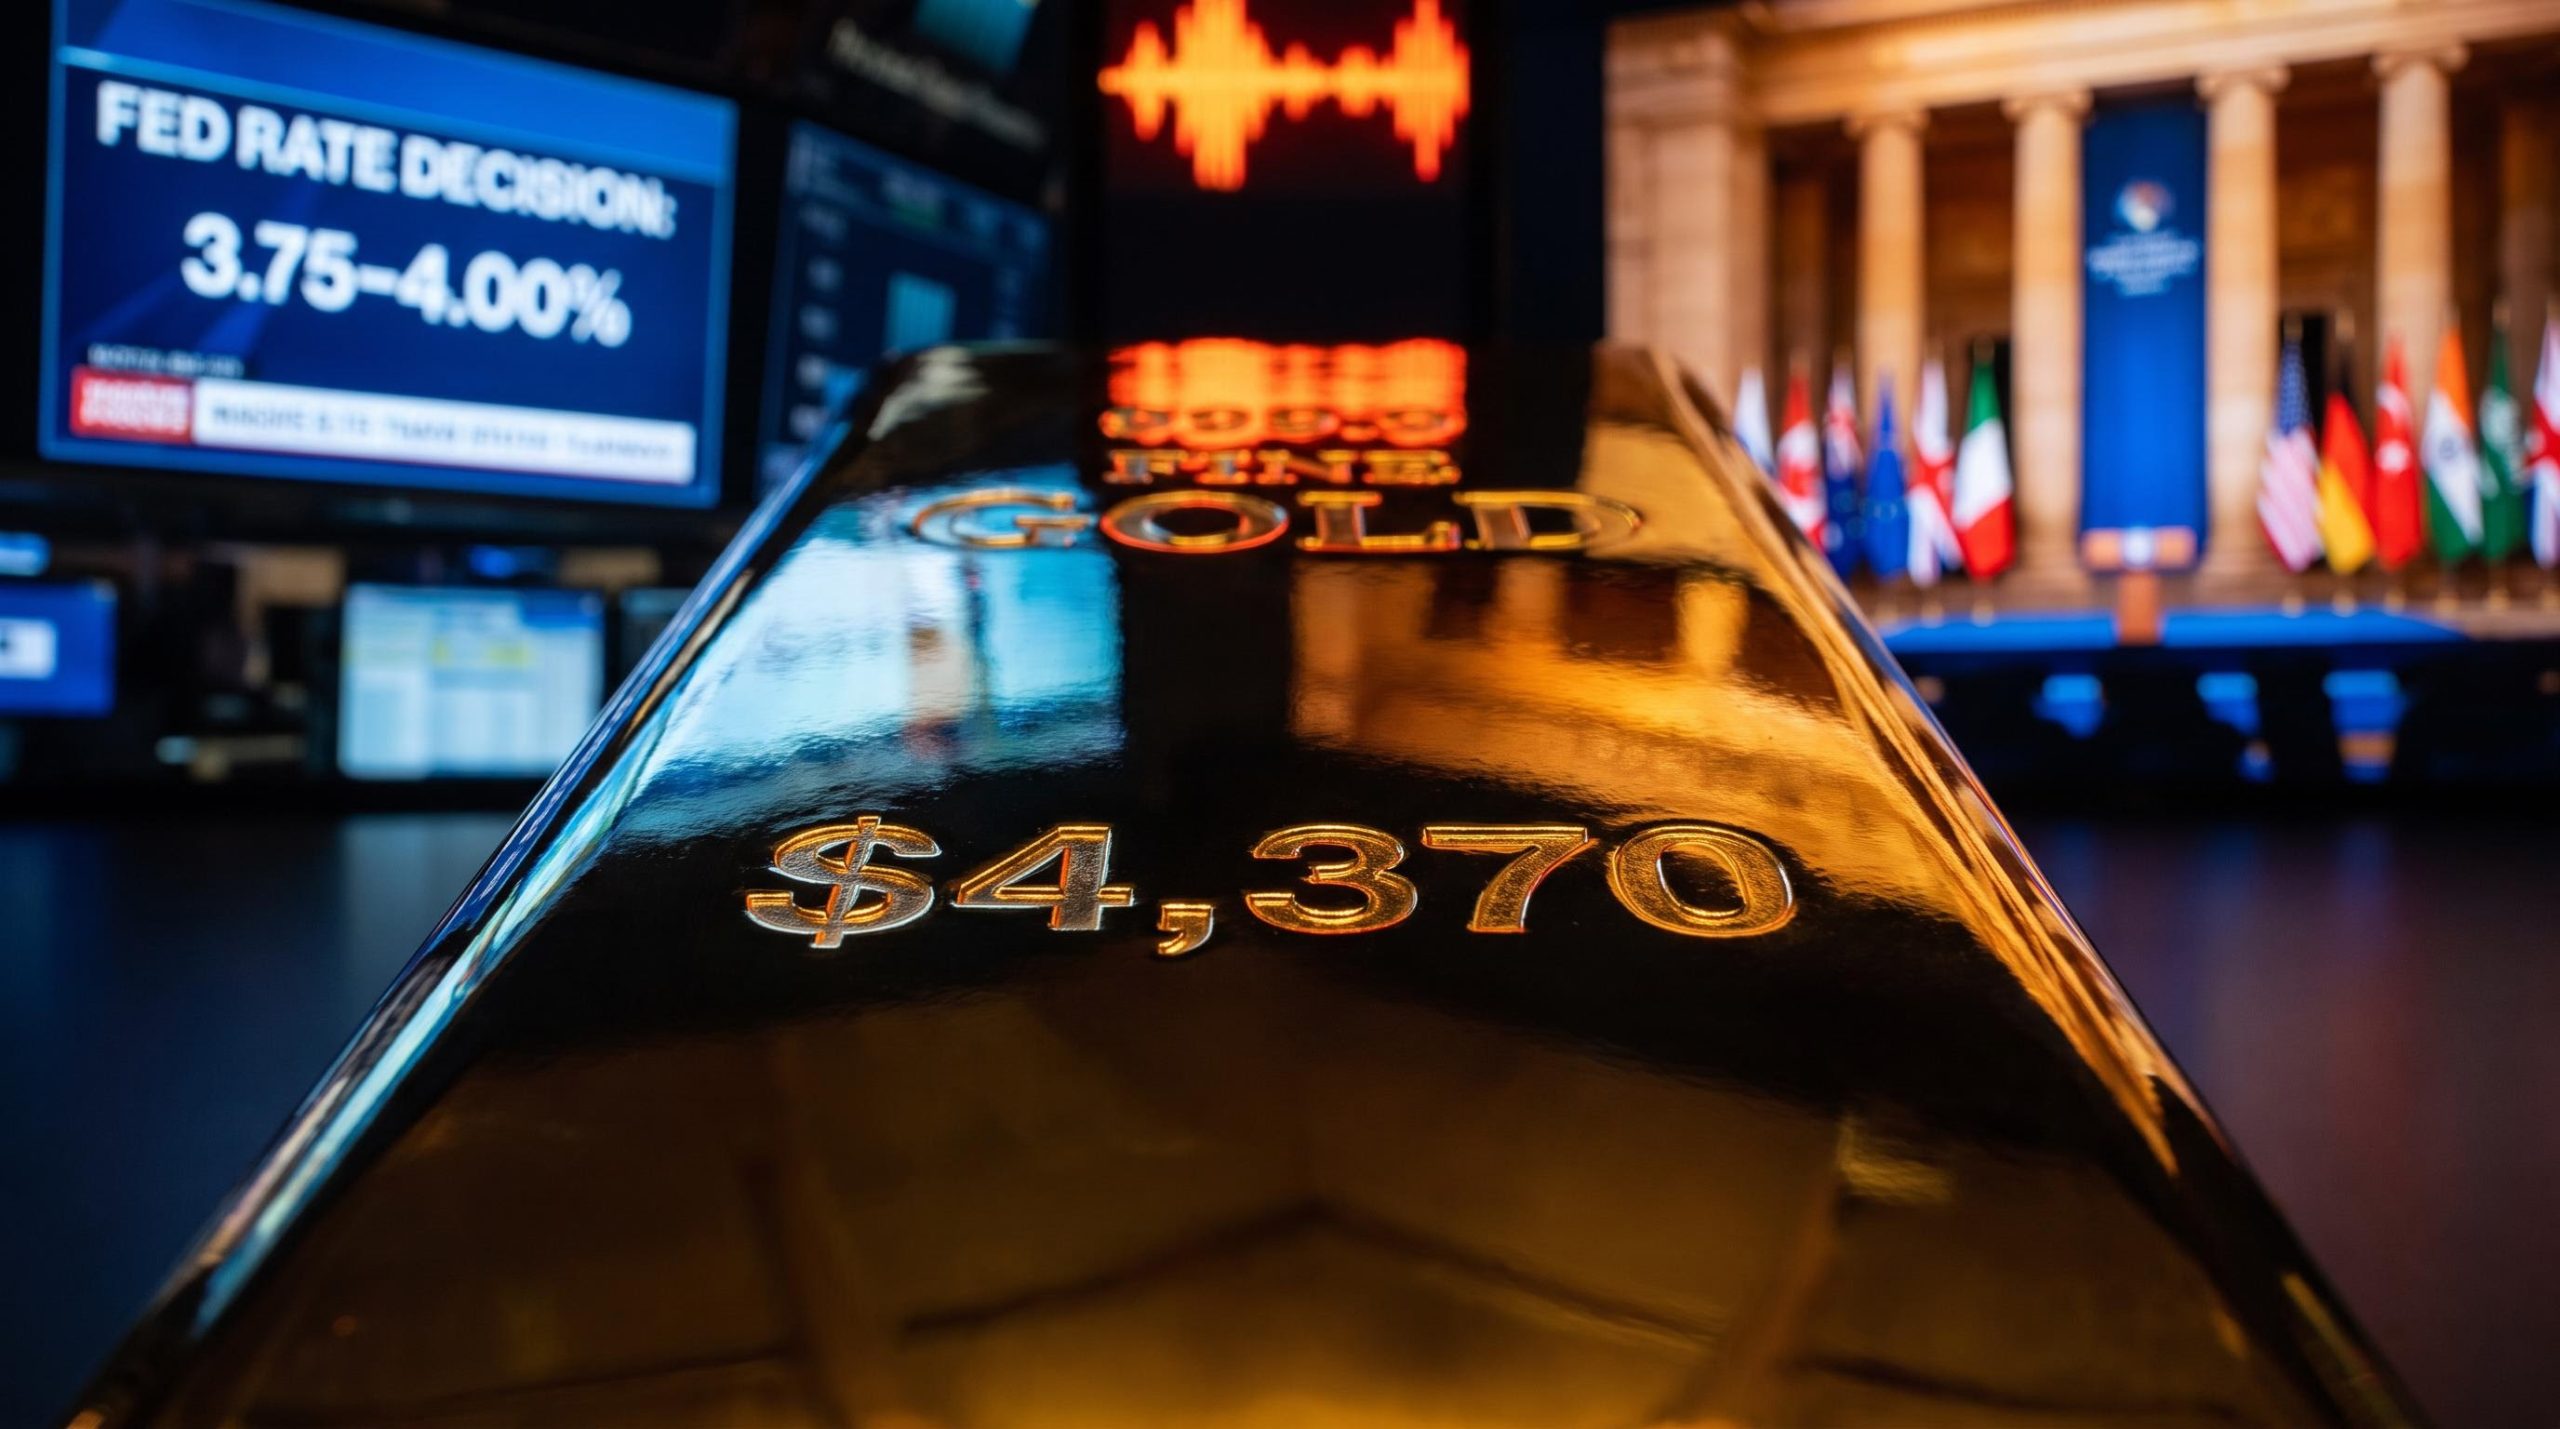
Gold is sitting just above $4,370 per ounce on the eve of one of the most event-dense weeks in recent memory. A Federal Reserve that just raised rates for the first time in three years, a Trump-Xi summit in Washington with tariffs and AI on the table, and a Middle East situation swinging between strike threats and diplomatic signals are all live at once. This is not a routine market update.
Each of these three catalysts moves gold on its own. What makes the current positioning environment genuinely hard to read is that all three are unresolved simultaneously, pulling in partially offsetting directions.
The puzzle worth solving first is why gold has stayed near record highs despite a rate hike that, by conventional logic, should have pressured it lower.
Here is what each of this week’s key outcomes could mean for where gold goes from here, and which signals matter most for the gold market outlook over the next seven days.
Why gold is holding above $4,370 despite the Fed’s first rate hike in three years
The conventional logic is straightforward: higher rates raise the opportunity cost of holding an asset that pays no yield, so a rate hike should pressure gold. On 16 September 2026, the Federal Open Market Committee voted unanimously, 12-0, to raise the target range for the federal funds rate to 3.75-4.00%, its first increase in three years.
The FOMC September 2026 policy statement confirmed the unanimous 12-0 vote to raise the target range to 3.75-4.00%, with forward guidance indicating 16 of 18 policymakers project at least one further 25-basis-point increase before year-end.
And yet gold has not sold off. It has held near all-time highs.
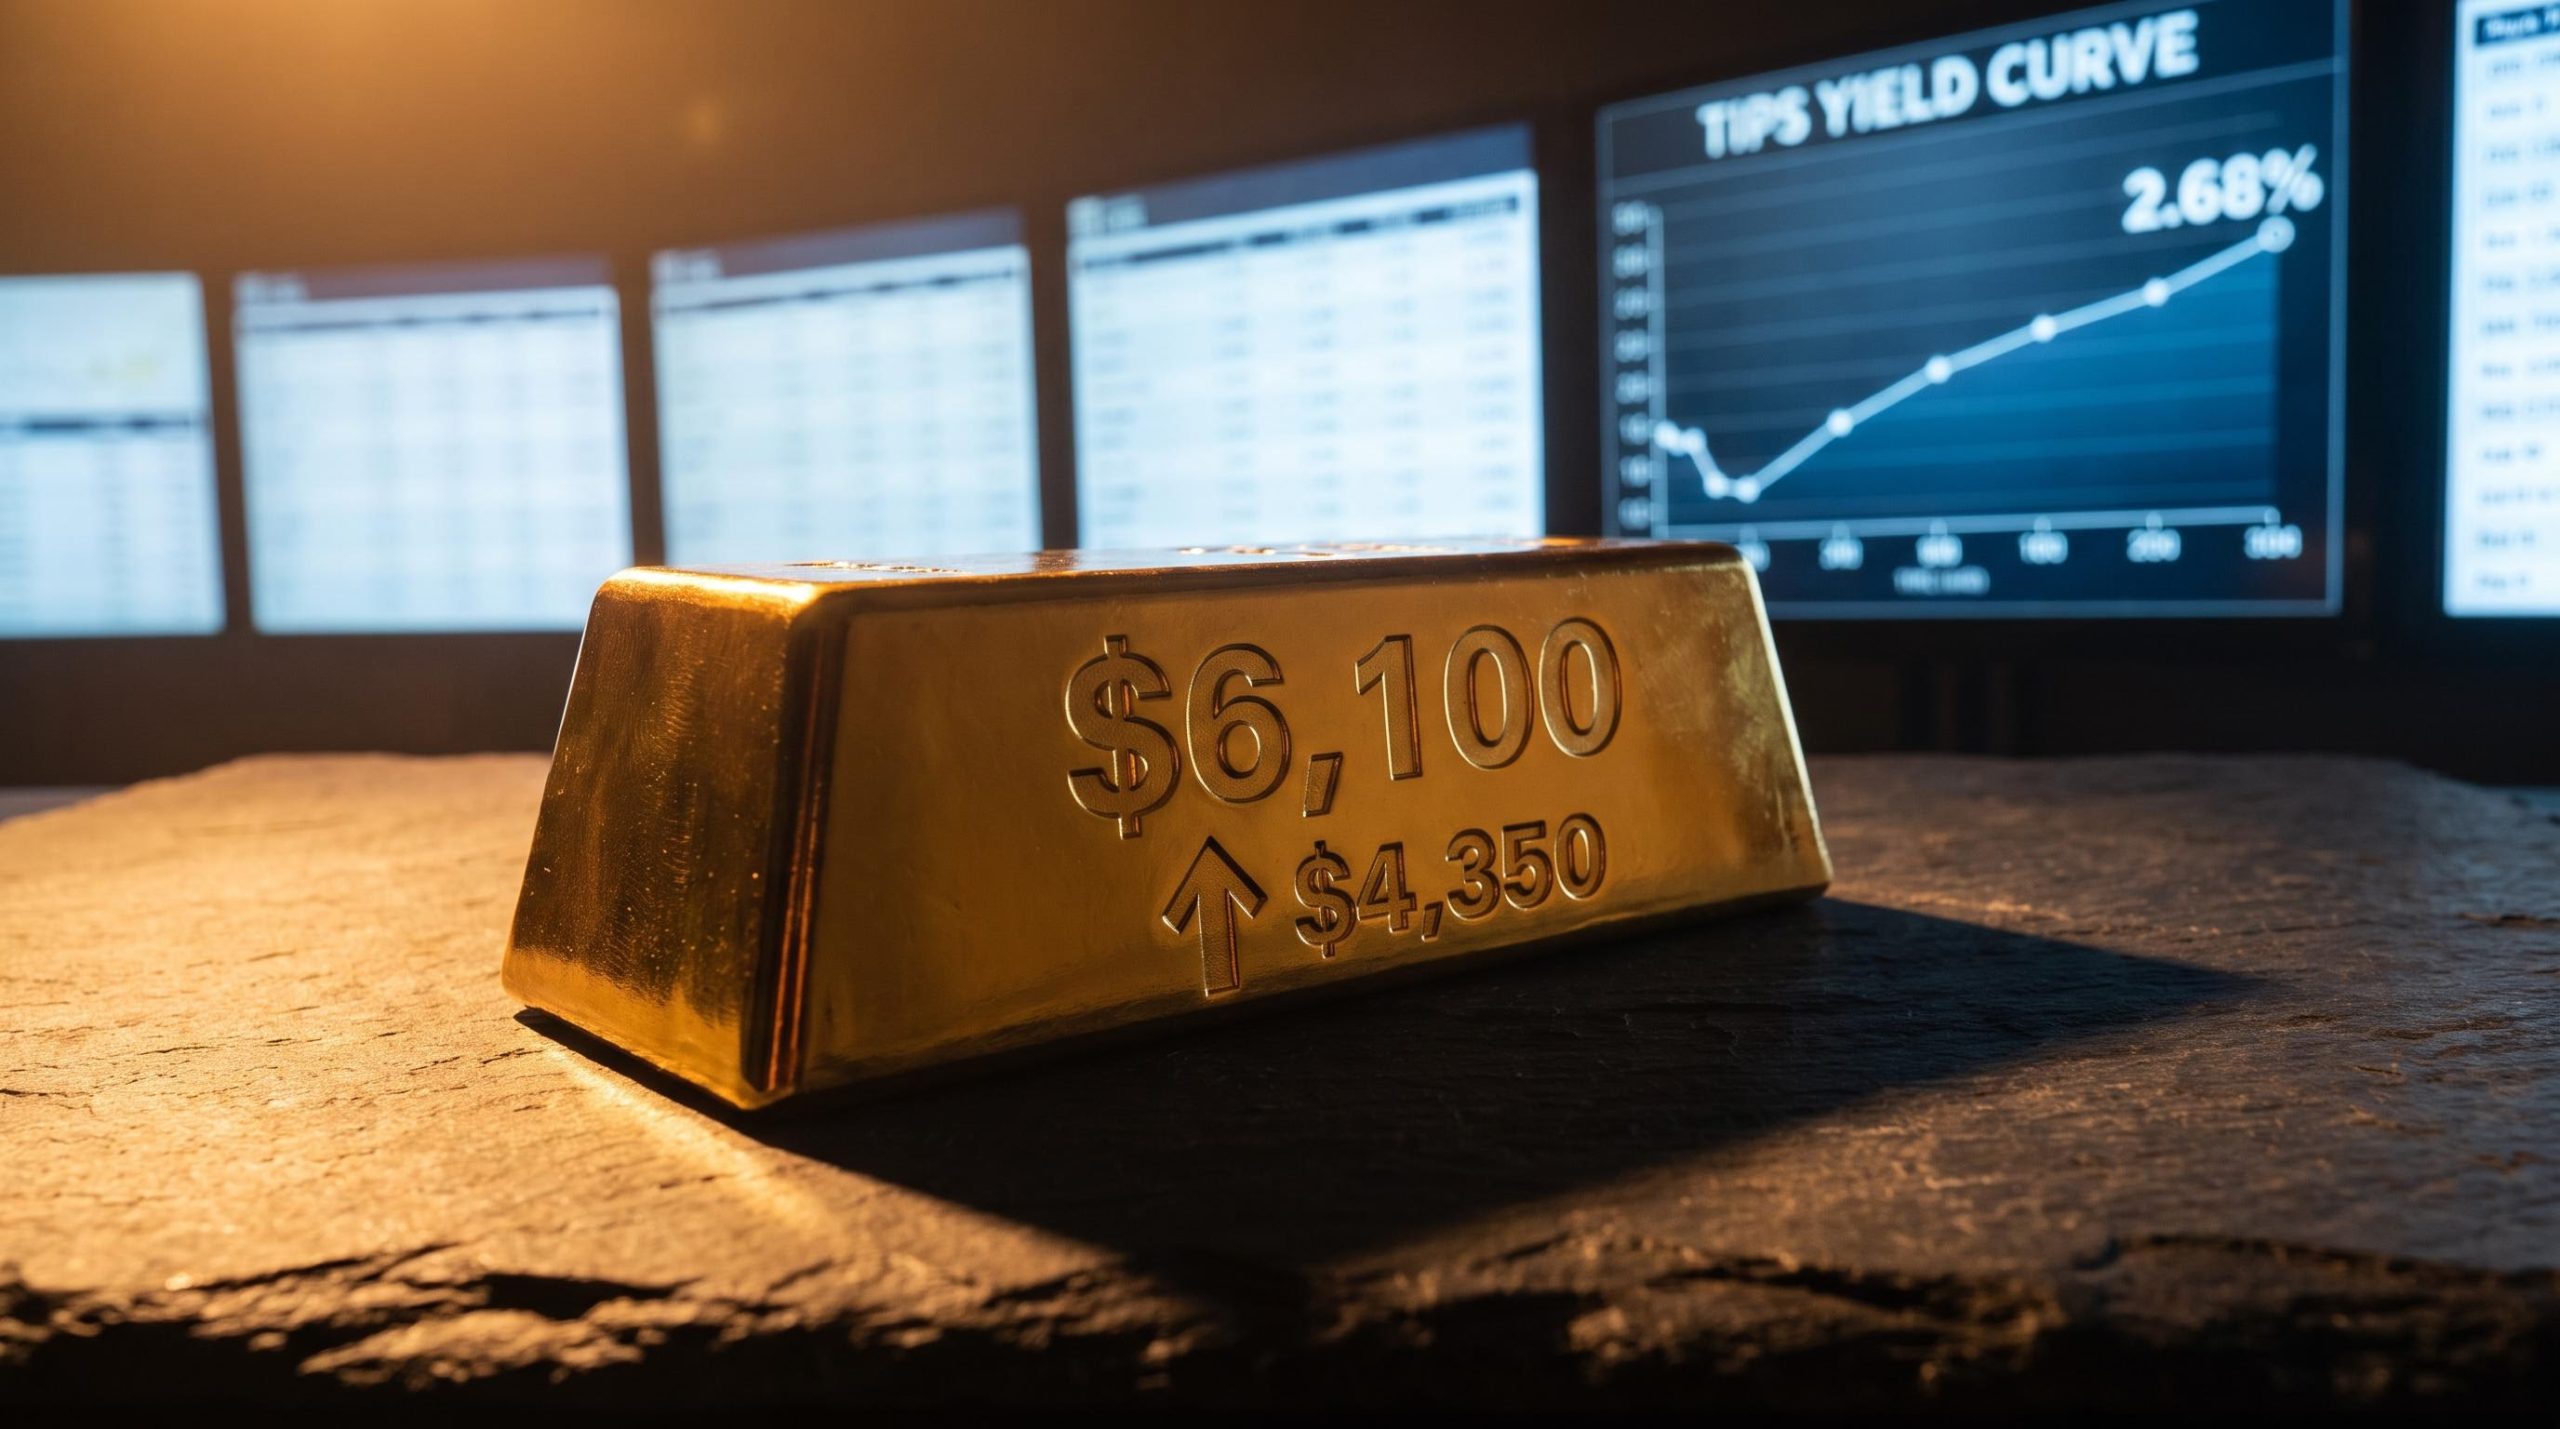
The gap between the headline rate and what gold actually responds to is explained by real yield dynamics: the 10-year TIPS yield, not the Fed funds rate, is the variable that most reliably moves the opportunity cost calculation for gold holders.
The resolution to that apparent contradiction is that most of the tightening was already reflected in market positioning and exchange-traded fund demand well before the decision landed. The hike delivered clarity rather than shock. That is why US Treasury yields actually declined after the announcement, removing one of the pressures that would ordinarily weigh on gold.
Three structural forces are currently overriding the rate-drag that textbooks would predict:
- Central bank reserve diversification. Goldman Sachs attributes elevated prices in part to sustained buying by central banks rebalancing reserves away from dollar exposure.
- Private-sector macro hedging. Investors are using gold to hedge against policy risk, including concerns over Fed independence, rather than trading it purely on rate moves.
- A relatively weak dollar and fiscal sustainability concerns. J.P. Morgan Private Bank cites the softer dollar and worries over US fiscal trajectory as a benign backdrop for gold, with UBS viewing structural deficits as a long-term tailwind.
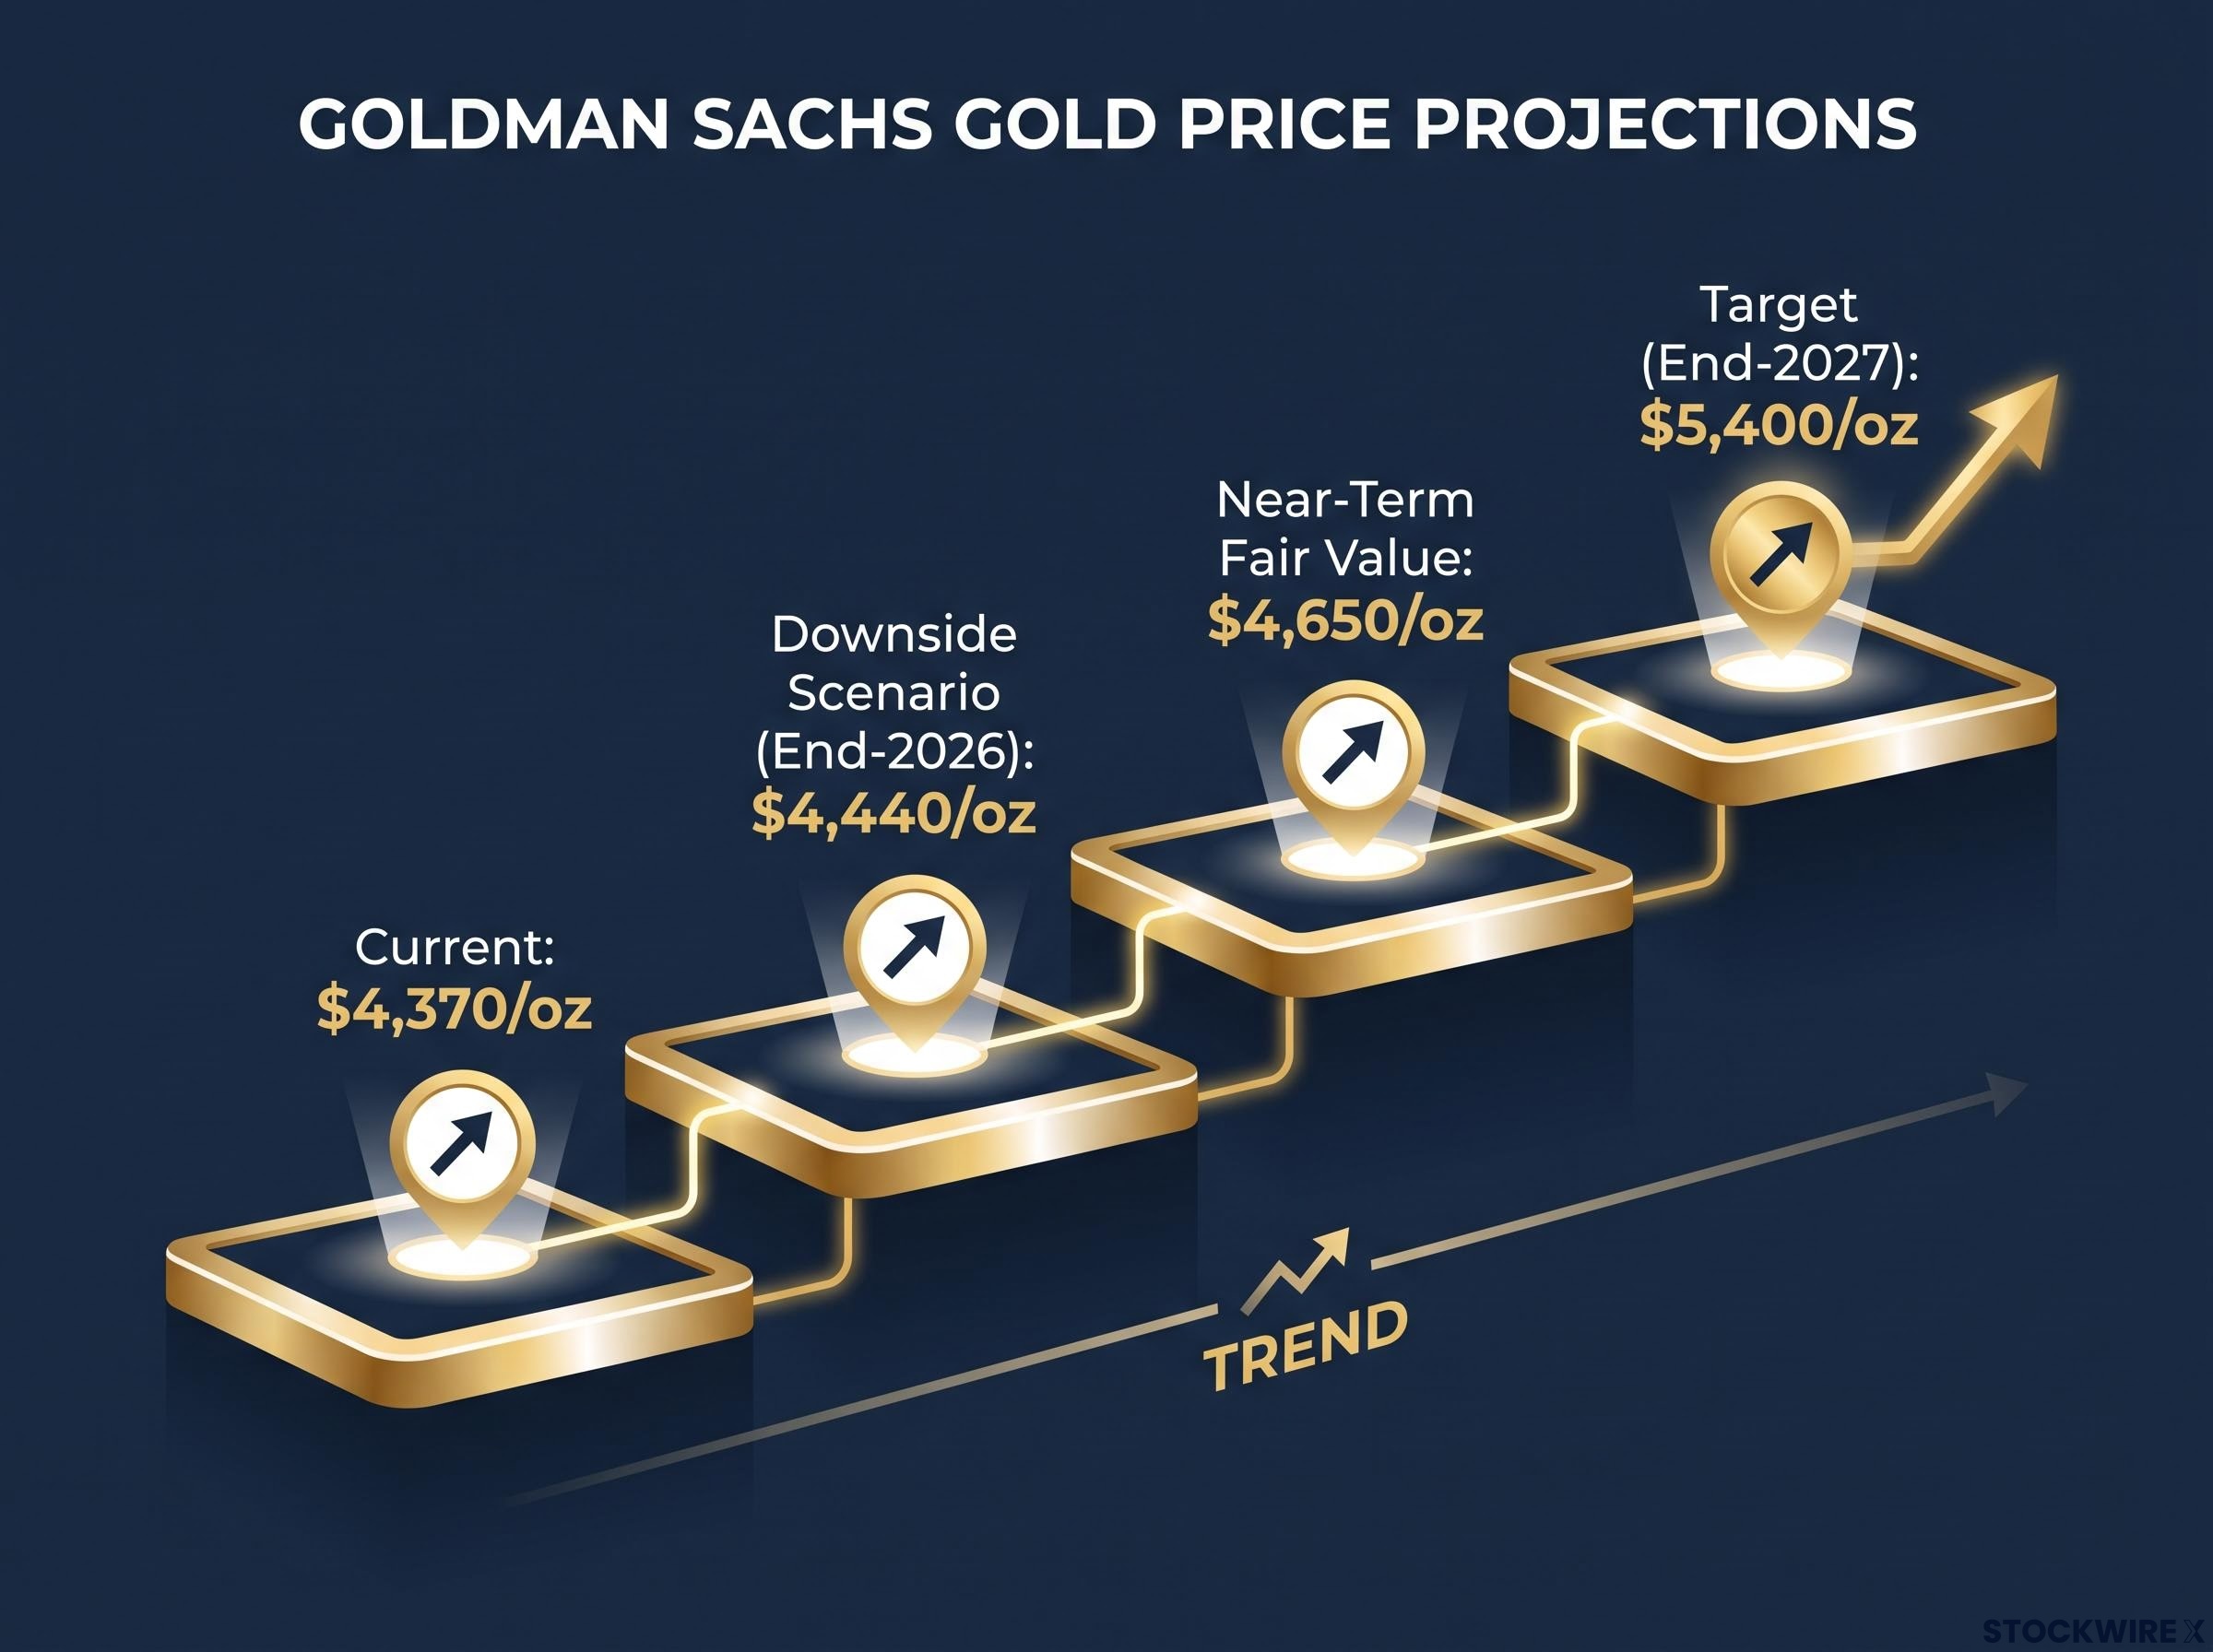
Goldman has trimmed its near-term fair value to $4,650/oz while holding a longer forecast intact.
Goldman Sachs end-2027 target Goldman Sachs maintains an end-2027 gold price target of $5,400/oz, framing the current level as a floor built on structural demand rather than a speculative peak.
Forward guidance points to more tightening ahead, with 16 of 18 policymakers projecting a year-end policy rate around 4.1%, implying at least one further 25-basis-point increase in 2026. That matters for how the historical pattern applies from here.
What history says about gold after the first hike
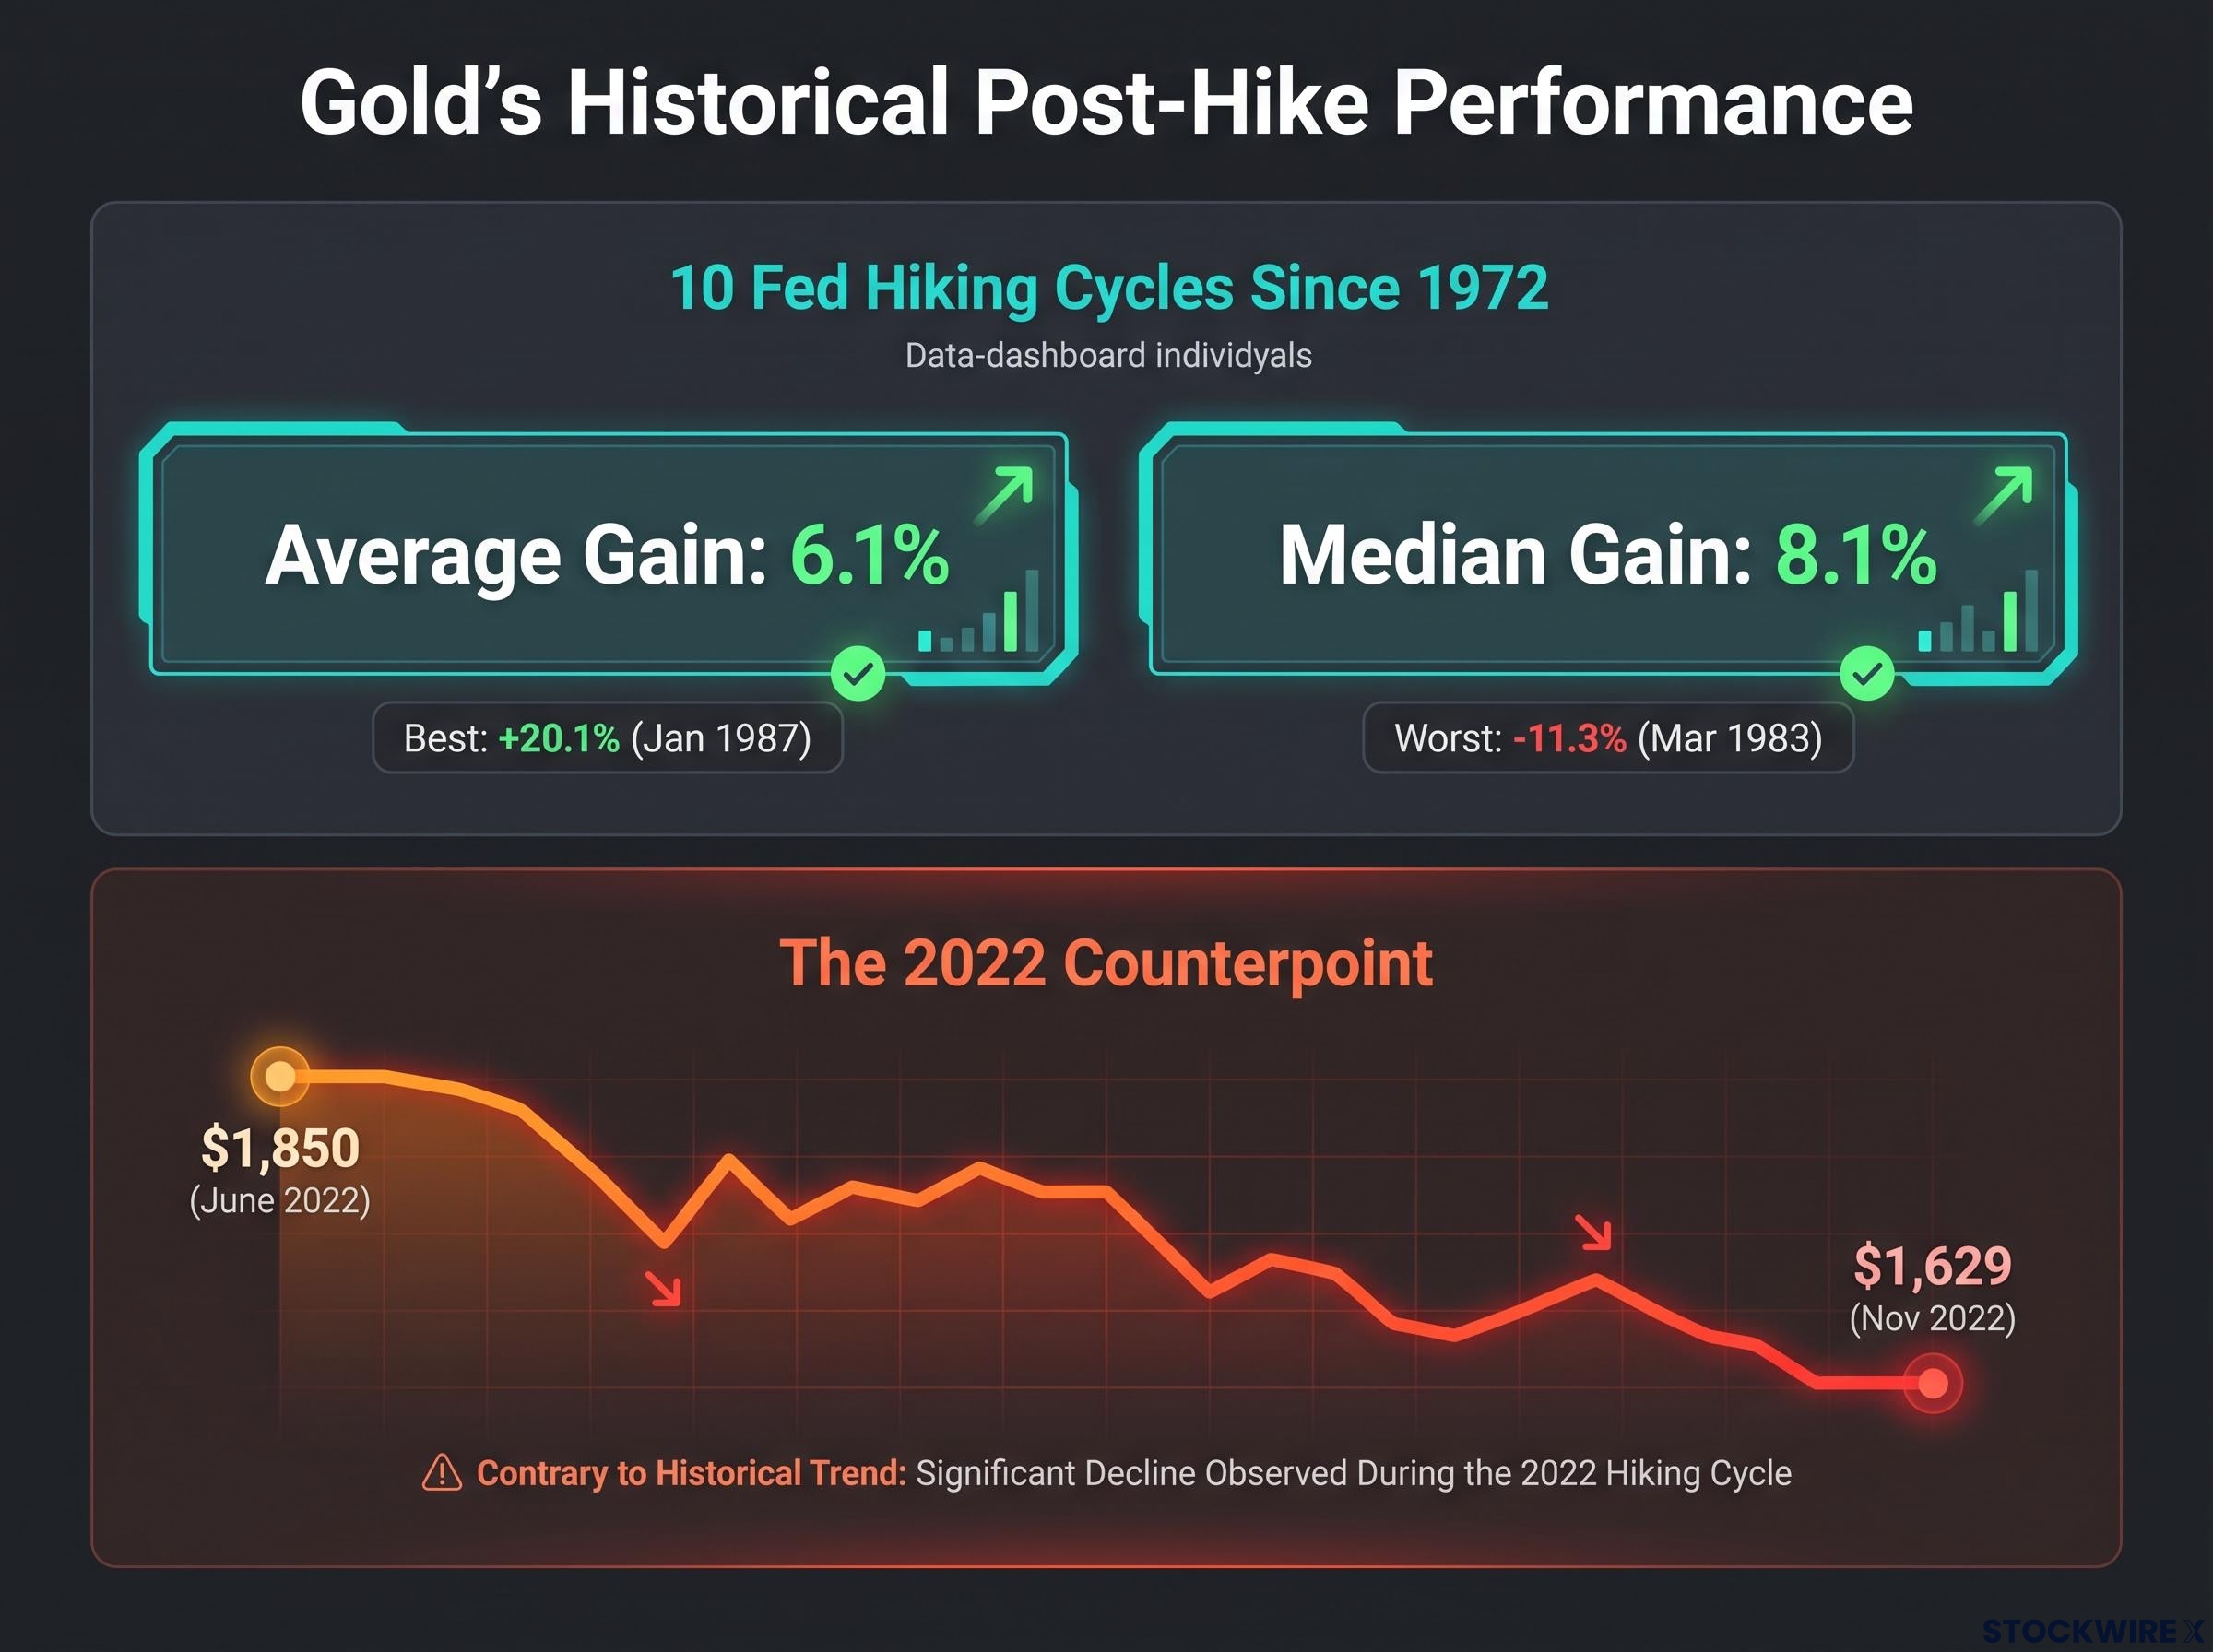
The record complicates the “higher rates hurt gold” framing considerably. According to Benzinga analysis of 10 Fed hiking cycles since 1972, gold gained an average of 6.1% (median 8.1%) in the 12 months following the first rate hike.
The dispersion is wide, ranging from -11.3% after the March 1983 hike to +20.1% after January 1987, so this is a tendency, not a guarantee.
The 2022 cycle is the cautionary counterpoint. Early geopolitical support from the Ukraine war gave way to a sharp drawdown when the Fed switched to rapid 75-basis-point hikes, driving spot gold from roughly $1,850 in June 2022 to $1,629 by November. The lesson for the reader is that the first hike has historically marked a turning point for gold rather than a ceiling, but the pace and magnitude of what follows can still overwhelm that pattern.
When big ASX news breaks, our subscribers know first
What the Trump-Xi summit could mean for gold in either direction
The Washington summit on 24 September 2026 carries unusual weight. It marks Xi Jinping’s first state-level visit to the US during Trump’s second term, with trade, tariffs, Taiwan, rare earths, AI, and technology controls all on the agenda, and a fragile reciprocal tariff truce scheduled to expire on 10 November 2026.
The May 2026 Beijing summit produced a preliminary consensus on tariffs and agricultural purchases, but no formal agreement or implementation timeline was published by either government, and the gap between Trump’s public claims and Beijing’s confirmed commitments proved consequential for investors who priced in outcomes before they were verified.
There are two credible paths, and each moves gold differently.
In the risk-on scenario, targeted deals emerge. Saxo Bank and Reuters analysts expect narrow sectoral agreements on agriculture, energy, and non-tariff barriers rather than a grand bargain. SpotGamma scenario analysis suggests tariff relief and continued dialogue would ease inflation risks and support equities. HSBC frames a stabilised “managed rivalry” as the base case, which limits downside sentiment. In that world, gold’s geopolitical risk premium compresses and the metal likely stays range-bound.
Event-driven beneficiaries flagged in this scenario include:
- Boeing
- Soybeans
- Rare-earth stocks
- Semiconductors
- China and Hong Kong equities
In the risk-off scenario, talks break down or a new tariff or tech-export escalation lands. Morgan Stanley notes that renewed friction would increase volatility and risk-off positioning, strengthening the dollar and redirecting capital toward gold as the uncertainty hedge of choice.
| Scenario | Dollar direction | Equity reaction | Gold implication |
|---|---|---|---|
| Risk-on (targeted deals) | Softer to stable | Supported, rally on relief | Range-bound, premium compresses |
| Risk-off (breakdown or escalation) | Stronger | Sell-off, elevated volatility | Safe-haven bid reactivates |
Here is the variable that matters most for your positioning: not whether a deal is announced on Wednesday, but whether the 10 November tariff truce expiry is extended, shortened, or left ambiguous. That language is the signal that determines whether any risk-on compression of gold’s premium is durable or merely a headline-driven blip.
How Middle East signals are pulling gold in two directions at once
Two contradictory signals are coming out of the same region at the same time, and gold is caught between them.
The three concurrent developments to anchor on:
- Fresh Houthi strikes on Saudi Arabia over the weekend preceding 20 September 2026, pushing geopolitical risk upward.
- Trump declining to join Saudi-led retaliatory operations, keeping the US-Houthi ceasefire intact.
- Trump signalling openness, via a Fox interview, to meeting Iranian President Masoud Pezeshkian on the margins of the United Nations General Assembly.
The mechanism matters. By staying out of the retaliation, Trump removed one tail risk from the table, and his openness to an Iran meeting contributed to a decline in oil prices that lifted risk appetite in Asian markets. Precious metals moved alongside a steady gold market that session, with spot silver up 0.7% to $66.7430/oz and spot platinum up 0.3% to $1,809.65/oz.
Professional markets are pricing the net of these signals rather than betting on either one resolving.
Gold’s safe-haven properties are conditional rather than universal: forced liquidation episodes, rising real yields, and a strengthening dollar have each independently caused gold to fall alongside equities, which is why the ECB characterises it as a time-varying hedge rather than a permanent one.
ECB Financial Stability Review The European Central Bank notes gold operates as a safe haven during elevated geopolitical risk and policy uncertainty, tending to rise while stocks and bonds fall in extreme stress episodes. Critically, it characterises gold as a time-varying hedge rather than a universal constant.
The oil-gold-inflation connection in the current environment
Lower oil prices feed directly into lower near-term inflation expectations. Because inflation hedging is one of gold’s fundamental demand pillars, softer inflation expectations quietly erode one source of support even as geopolitical uncertainty sustains the safe-haven bid from a different source.
That internal tension within gold’s own demand structure is part of why prices are stuck near $4,370 rather than breaking sharply either way. For the reader, the practical read is this: the current Middle East premium is discounting an unresolved situation, and a clear resolution in either direction, a full ceasefire or a genuine escalation, will move gold more than today’s ambiguity is doing.
The bearish case and what would have to happen for gold to pull back from here
The bull case is not the only credible one, and treating it as such would be a positioning error. Institutional analysts point to three conditions that would need to arrive for a meaningful gold pullback:
- A stronger-than-expected dollar that reverses the current weakness.
- An acceleration in real yield increases beyond what markets have already priced.
- Sustained geopolitical de-escalation across both the Middle East and the US-China fronts at the same time.
None of these is far-fetched. Even Goldman Sachs, among the most structurally bullish major banks on gold, acknowledges a downside path.
Goldman Sachs downside scenario Goldman Sachs identifies a scenario in which gold ends 2026 closer to $4,440/oz, essentially flat from current levels despite every structural tailwind in place.
The dollar dynamic is the live risk to watch. J.P. Morgan Private Bank frames the relatively weak dollar and fiscal sustainability concerns as the current benign backdrop, which means a reversal of that backdrop is precisely what the bear case hinges on. UBS and StoneX both note that elevated Treasury yields and a resilient dollar are currently capable of overriding safe-haven demand, with UBS referencing a prior $3,850-$4,000/oz trading range under similar yield conditions.
History supplies the cautionary tail. In 2022, aggressive 75-basis-point hikes drove spot gold from roughly $1,850 in June to $1,629 by November, showing that the pace of tightening can temporarily overwhelm structural support. Invesco, in a July 2026 outlook flagged as unverified in source research, similarly warns that higher rates and a stronger dollar raise the opportunity cost of holding gold.
The read you should take from this is specific. The bearish case is not an argument that structural demand is fake. It is an argument that dollar strength, real yield acceleration, and geopolitical calm could arrive together and compress the premium sitting on top of that structural floor.
Which signals to watch before making a move on gold this week
The analysis converts into a practical watchlist built around the three live catalysts. Each connects to a specific gold-relevant signal you can track in real time rather than after the move.
| Catalyst | Signal to watch | Gold implication |
|---|---|---|
| Fed forward guidance | Real yield direction versus the 16-of-18 projection for a 4.1% year-end rate | Rising real yields pressure gold; falling yields support it |
| Trump-Xi summit | Whether the 10 November tariff truce is extended or left unaddressed | Extension eases the premium; ambiguity or breakdown reactivates the bid |
| UNGA diplomacy | Whether a Trump-Pezeshkian meeting materialises and signals Iran’s posture | A meeting compresses the premium; escalation lifts it |
On the Fed, Chair Kevin Warsh has reaffirmed the 2% inflation target and forward guidance implying at least one further 25-basis-point hike in 2026, so real yield direction is the cleaner read than the headline rate itself.
The precious metals complex offers a secondary confirming signal:
- Spot silver at $66.7430/oz, up 0.7% on 20 September 2026.
- Spot platinum at $1,809.65/oz, up 0.3% on the same session.
Industrial demand holding alongside gold’s safe-haven bid is a moderately bullish composite read for the sector. The catch is that these signals are not independent. A risk-on summit outcome combined with a constructive UNGA meeting would create compounding downward pressure on gold’s near-term premium, while a breakdown on either front could quickly reactivate the safe-haven bid even if the Fed stays on its current path.
This article is for informational purposes only and should not be considered financial advice. Investors should conduct their own research and consult with financial professionals before making investment decisions. Past performance does not guarantee future results. Financial projections are subject to market conditions and various risk factors, and forward-looking scenarios are speculative and subject to change.
Gold at $4,370 is not the question: the question is what breaks the range
The three-force framework explains the standstill. The Fed’s tightening trajectory, the summit’s binary outcome potential, and the Middle East’s contradictory signals are all pointing in partially offsetting directions, which is precisely why gold is range-bound rather than trending.
The structural bull case remains intact. Central bank diversification, fiscal sustainability concerns, and the World Gold Council finding that gold tends to outperform after the first hike all support the medium-term picture, with Goldman’s $5,400/oz end-2027 target as the anchor.
The near-term range Goldman’s trimmed fair value of $4,650/oz and its downside scenario of $4,440/oz define the band this week’s events could determine, roughly $210/oz of ground.
The single most consequential near-term date beyond the summit itself is the 10 November tariff truce expiry. What the reader should take from all of this is not that gold is bullish or bearish, but that the current convergence of forces has opened an unusually wide set of near-term scenarios. Being prepared for volatility in either direction matters more right now than being confident about which way it breaks.
For investors wanting to place the current $4,370 level in the broader recovery context, our full explainer on gold’s H2 2026 outlook examines the one-hike versus multi-hike scenario split and the institutional demand floor that distinguishes this correction from prior cyclical downturns.