A strategy that wins more than seven times out of ten still managed to wreck portfolios in April 2025. That is not a contradiction. It is the entire problem with judging a short premium strategy by how often it wins.
For a finance-educated retail trader who ran naked short puts through last year’s tariff-driven selloff, the numbers were not abstract. The VIX closed at 45.31 on 4 April 2025, then climbed to a 52.33 close on 8 April 2025, its highest since 2020. The S&P 500’s average intraday range that month hit 165.13 points, roughly 6.6 times its long-term average. This was the environment where the gap between naked short puts and put spreads stopped being an academic debate.
What follows is not a timing call. It is a data-grounded breakdown of why high win rates in short premium strategies can be a structural trap, the three forces that turn a manageable position into a portfolio-level event, and where spreads actually earn back the premium they cost you. The evidence here supports a structural choice, made in advance, not a reactive one made mid-crash.
What five years of backtested data actually show about these two strategies
Start with the finding that makes naked short puts look like the obvious answer. Over roughly five years of post-COVID markets, research presented by Galitics and Shak Mahosa under the tastylive research framework found that naked short puts generated approximately 3 times the cumulative returns of comparable put spread strategies during bull market conditions.
That is a large margin, and it explains why the strategy dominates retail short premium trading. When markets grind higher, the uncapped premium collection of a naked position compounds faster than a hedged one.
The study design was straightforward: 30-delta short puts, entered at 45 days to expiration and managed at 21 days to expiration, tested across roughly 13-14 underlying instruments. A 30-delta put sits meaningfully out of the money at entry, which is what produces those comfortable win rates in the first place.
Then the same dataset undercuts the headline number. On a per-dollar-of-capital basis, spread strategies outperformed naked short puts over the full five-year period, and that period includes the bull market where naked puts nominally tripled the spread’s returns.
tastylive’s single options vs spreads comparison reaches the same conclusion on a per-dollar-of-capital basis, finding that spreads can return more than naked options as a percentage of capital deployed, which reinforces why the cumulative return headline for naked puts can mislead traders who do not adjust for capital efficiency.
On a per-dollar-of-capital basis, put spreads outperformed naked short puts across the entire five-year study period, despite naked puts delivering roughly three times the cumulative return during the bull-market phase.
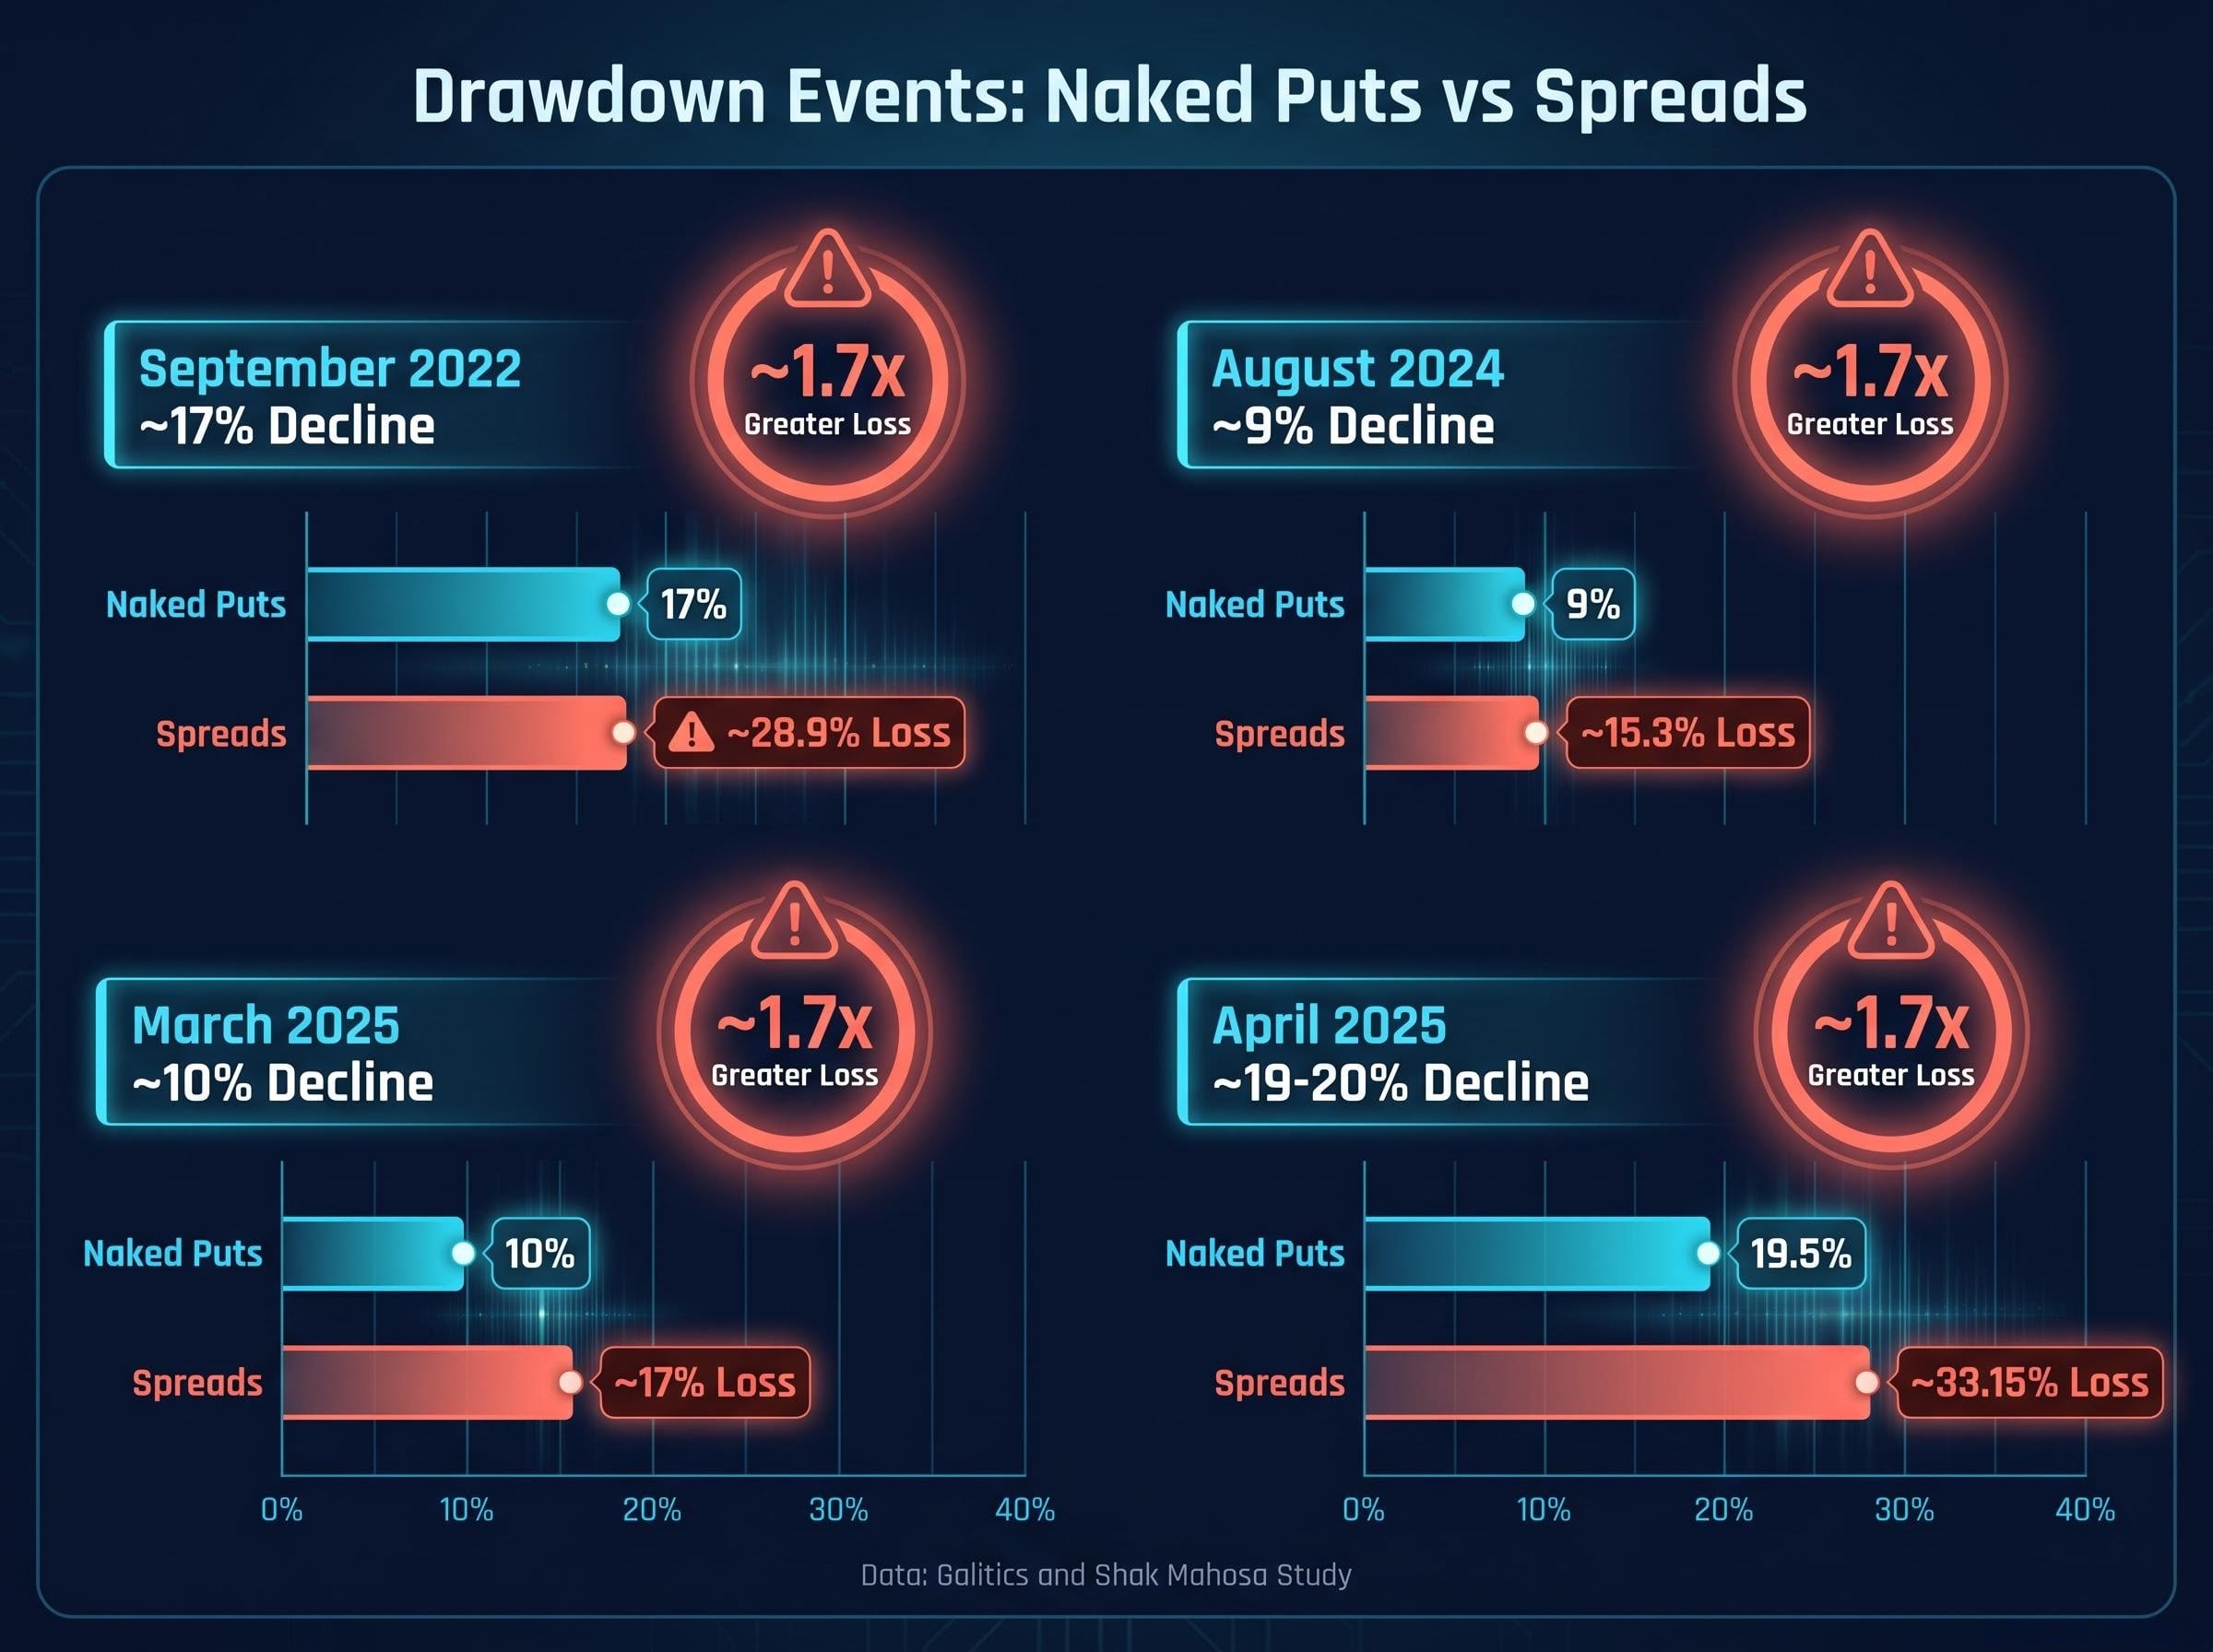
The reason sits in the drawdown data. The study captured four decline events: September 2022 at approximately 17%, August 2024 at approximately 9%, March 2025 at approximately 10%, and April 2025 at approximately 19-20%, the largest event in the study period. During individual selloffs, naked short puts produced roughly 1.7 times the losses of comparable spread positions.
| Drawdown event | Approx. market decline | Naked short put loss vs spread |
|---|---|---|
| September 2022 | ~17% | ~1.7x greater |
| August 2024 | ~9% | ~1.7x greater |
| March 2025 | ~10% | ~1.7x greater |
| April 2025 | ~19-20% | ~1.7x greater |
Here is what the per-capital reversal tells you. The bull-market return advantage of naked short puts is not free money. It is borrowed against a future drawdown, and the loan comes due at the worst possible moment. The metric most traders optimise for, cumulative returns in a rising market, is not the metric that decides whether the portfolio survives a full cycle.
When big ASX news breaks, our subscribers know first
The win rate trap: why 70% feels like safety and is not
A probability of profit in the 70-80% range, the figure commonly cited for naked short puts, sounds like a structural edge. It is not describing safety. It is describing a distribution.
That distinction is the whole game. A 70% win rate tells you how often the strategy wins, but says nothing about the character of the 30% of cycles when it loses. And in short premium selling, the losing cycles are where the strategy’s viability is actually decided.
The Galitics and Shak Mahosa research put a number on how thin that edge really is.
A win-rate differential of just 2% between naked short puts and put spreads was sufficient to eliminate the entire five-year performance advantage of naked puts.
Sit with that. The whole case for naked puts rests on a margin narrow enough that a two-percentage-point shift, from execution slippage, from management error, from one unusually persistent drawdown, erases it entirely. What this tells you is that win rate on its own is an unreliable way to choose between these strategies, because the edge it implies can vanish under conditions you do not control.
Now consider the other side of the comparison. The tastylive credit spread backtest, published on 6 June 2017, found that short credit put spreads at 15, 45, and 75 days to expiration all achieved win rates of 88% or higher. Defined-risk spreads do not trade away win rate for capped losses. They frequently deliver both.
Why the losing 30% is not like the winning 70%
Short premium strategies have a fundamentally asymmetric payoff. The most you can win is the premium you collected, a capped figure fixed at entry. The most you can lose is the full extent of the underlying’s move against you, which is not capped at all.
That asymmetry is exactly what makes the rare losing cycle so decisive. Many small capped wins can be wiped out by a single uncapped loss.
The asymmetric payoff structure that makes short premium selling appear attractive, capped wins from premium collected against theoretically unlimited losses, is the same structure that drives outsized losses during adverse cycles, with implied volatility crush, time decay, and position sizing all amplifying the structural disadvantage at exactly the wrong moment.
A put spread rewires this. The long leg absorbs everything beyond the spread width, mechanically converting an open-ended loss distribution into a bounded one. The winning trades still cap out at the (smaller) net credit, but the losing trades can no longer run to portfolio-threatening size.
Three forces that turn a bad day into a portfolio event
A naked short put loss in a crash is not just a larger version of a normal losing trade. It is a qualitatively different event, driven by three mechanical forces activating at once. Watch them compound.
- Delta expansion. A 30-delta short put behaves like a modest directional bet at entry. As the underlying falls toward and through the strike, delta accelerates toward -1, and the position can carry near-100-delta exposure. This acceleration is nonlinear. A static risk model built at entry simply does not see it coming.
- Vega exposure. Naked short puts are short volatility, meaning they lose money when implied volatility rises. In April 2025, the VIX averaged 31.97 for the month, 64% above its long-term average of 19.49, according to Gateway Investment Advisers. A short put could keep bleeding on volatility expansion even during hours when the underlying temporarily stabilised. Waiting for a bounce does not help when the volatility premium alone is moving against you.
Vega exposure is the second force compounding losses in a crash: a naked short put is structurally short volatility, and the nonlinear relationship between implied volatility and premium means each successive point of IV expansion adds more dollar damage than the one before it, a dynamic that kept positions bleeding through April 2025 even during hours when the underlying temporarily stabilised.
- Liquidity deterioration. When you most need to exit, the exit gets most expensive. VIX options bid-ask spreads averaged approximately 69.72% in April 2025, with a maximum above 150%, according to OptionsAnalysisSuite. S&P 500 bid-ask spreads sat near their highest levels since 2017 during the selloff, per Nasdaq. Crossing a spread that wide turns a theoretical loss into a materially larger realised one.
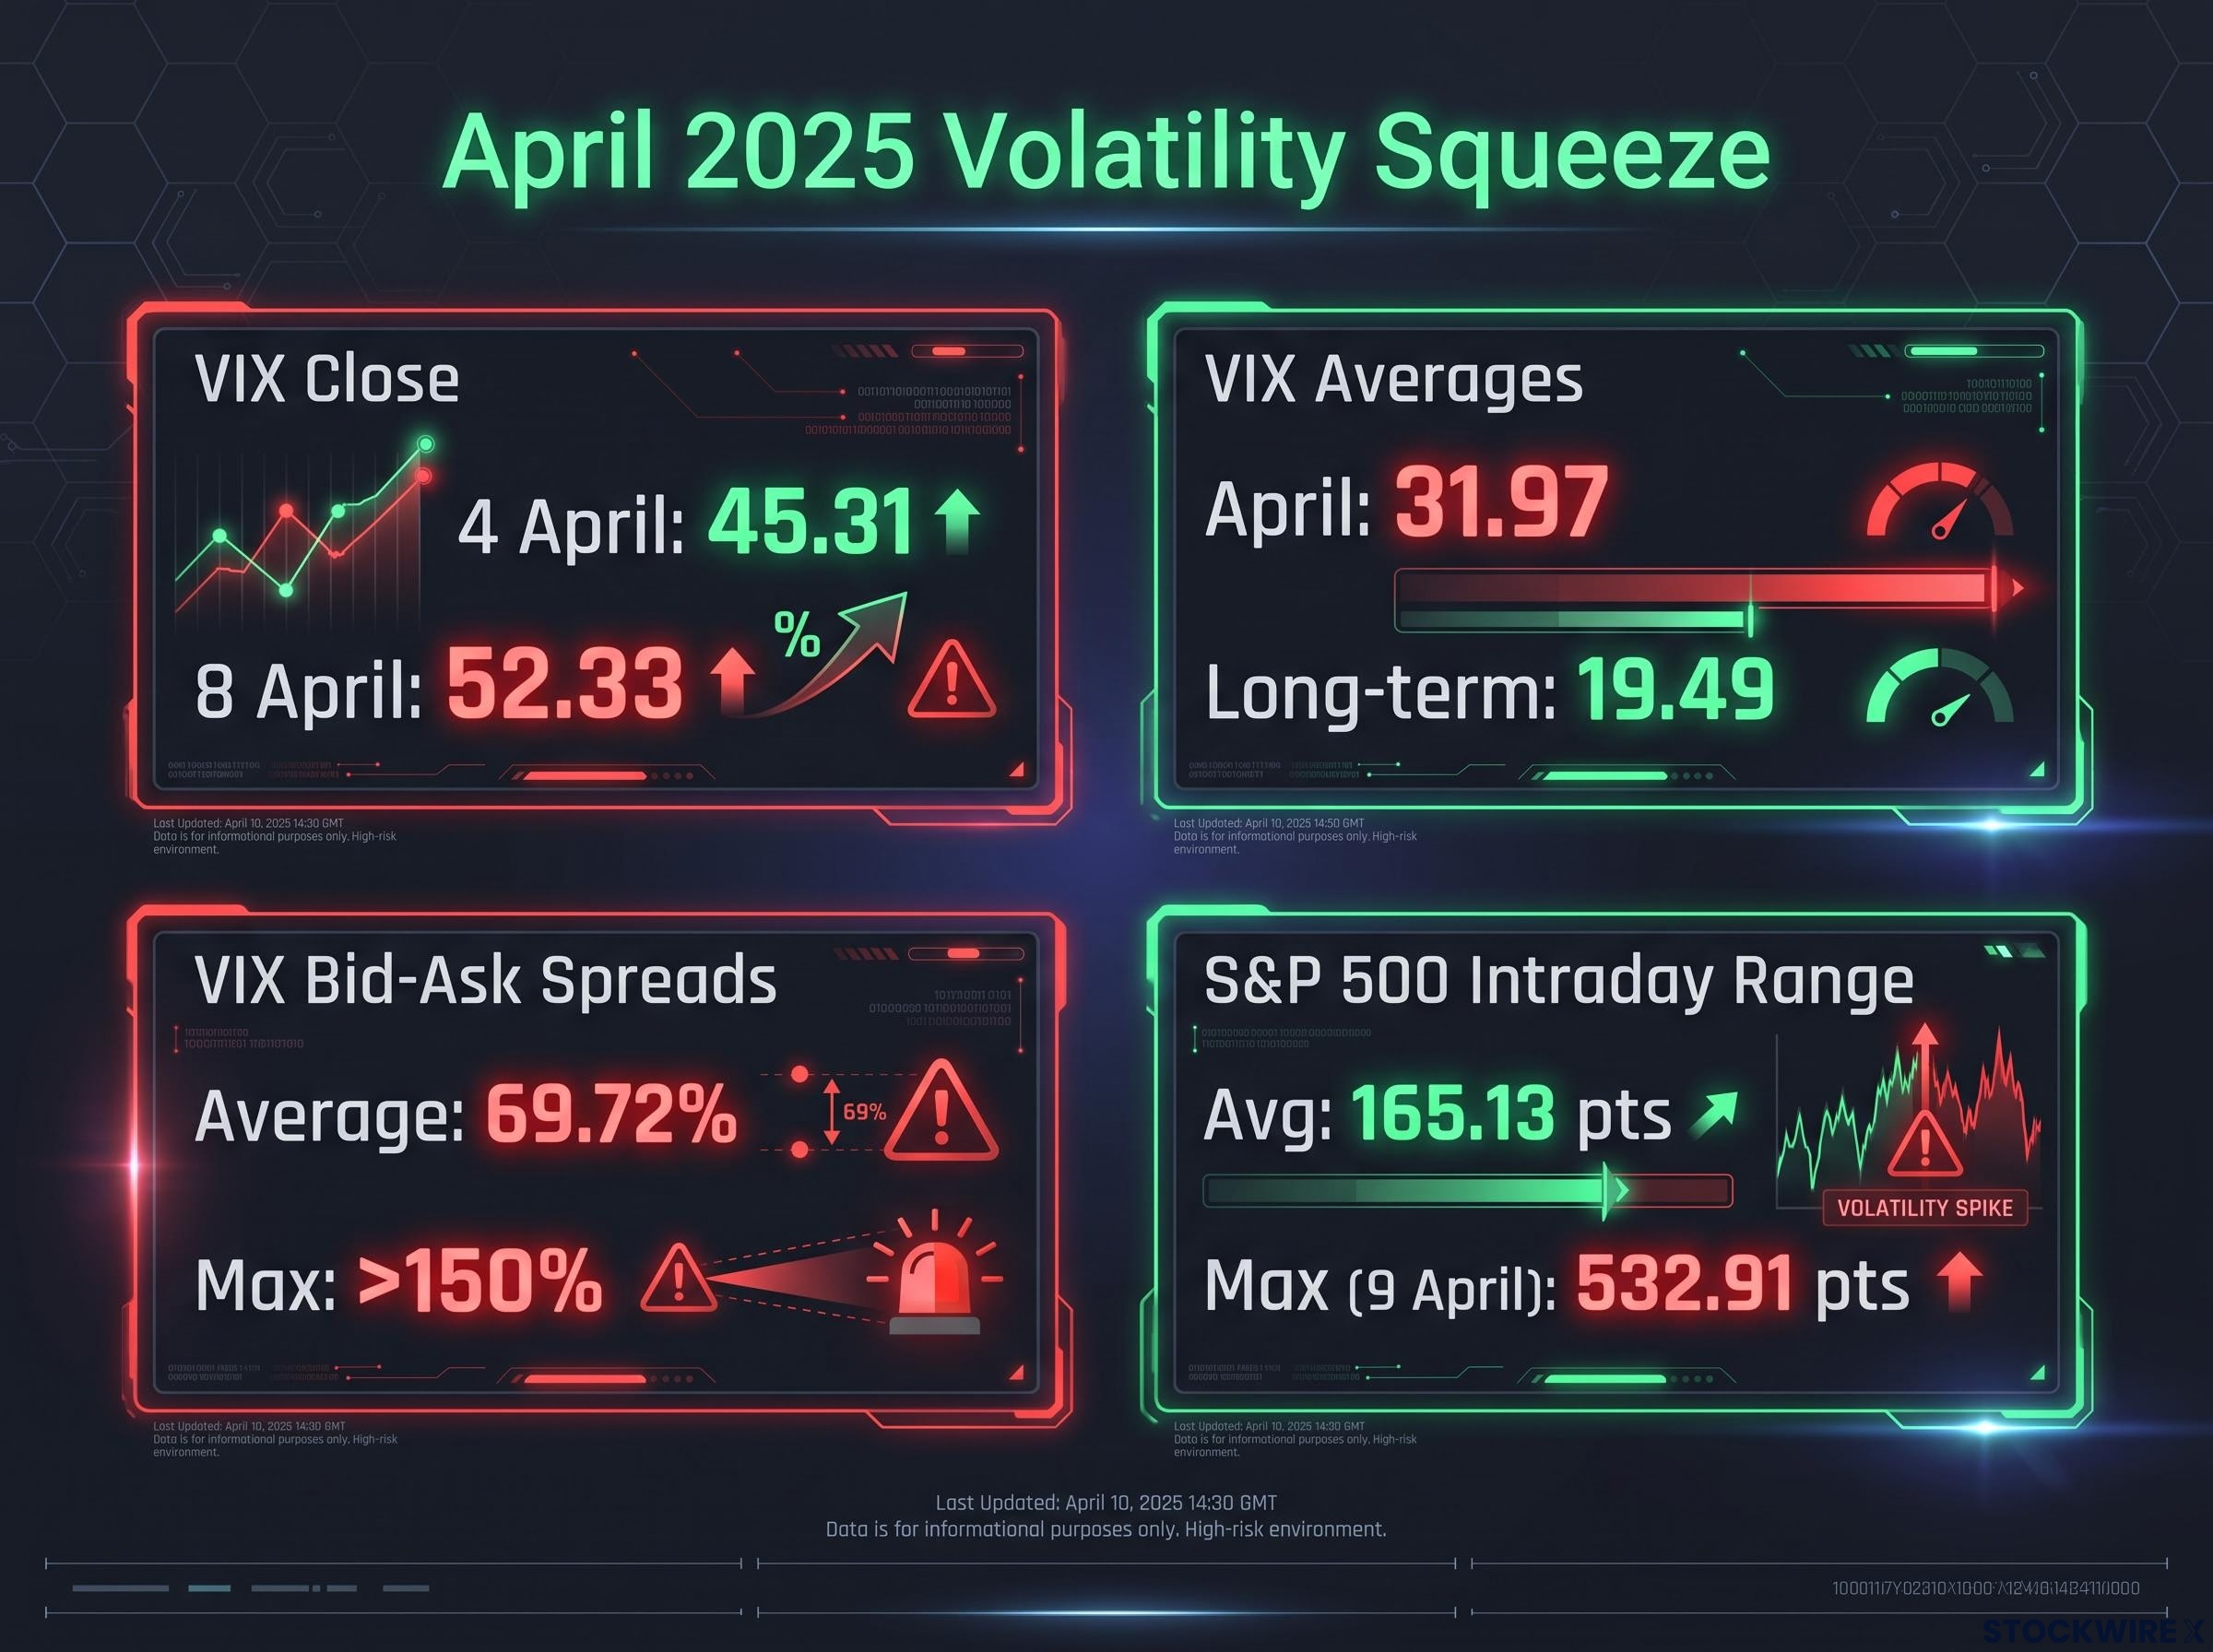
The VIX closed at 52.33 on 8 April 2025, its highest since 2020, roughly pricing in daily S&P 500 moves above 2%. The S&P 500’s maximum intraday range hit 532.91 points on 9 April 2025.
Here is why the convergence matters to you. The environment where naked short puts suffer the deepest theoretical losses is the same environment where closing them is most expensive. The realised loss and the theoretical loss diverge sharply, and they diverge against the trader every time.
Duration amplifies what magnitude starts
The research points to a detail that gets overlooked: portfolio damage tracks how long a selloff lasts more closely than how large the initial drop is. Hold through an extended decline while waiting for recovery, and losses accumulate continuously.
This is where a spread functions as a structural stop. The long leg caps how far losses can extend, no matter how many weeks the selloff drags on. It also means even a modest 9-10% decline, like August 2024 or March 2025, can inflict real damage on a naked short put book if the trader sits through the full duration of the drop.
What spreads give up and what they actually protect
The case for staying naked deserves a fair hearing, because the concessions spreads demand are real.
- Spreads collect less premium per trade, since part of the credit funds the protective long put.
- They tie up capital equal to the spread width, limiting leverage relative to a naked position.
- They add operational complexity, and rolling or adjusting them in a market with widening bid-ask spreads introduces slippage and execution risk.
- Some practitioners argue that a robust capital buffer plus a strict stop-loss, commonly set near 2 times the credit received, can substitute for a structural hedge.
Those points are legitimate, and the return data backs the strongest of them. Naked short puts genuinely delivered roughly 3 times the cumulative bull-market returns of spreads. That drag is not imaginary.
Now the data-based response. Spreads still outperformed naked puts on a per-dollar-of-capital basis over the full five-year period, and that window already contains the bull market where naked puts looked superior. The premium drag was more than repaid by drawdown protection at the cycle level.
Credit spread mechanics restructure the trader’s probability profile in ways the win-rate headline obscures: a well-constructed bull put spread carries multiple paths to maximum profit, and the long leg’s role is not just loss absorption but the conversion of an open-ended distribution into a bounded one that survives an extended drawdown.
| Attribute | Naked short puts | Put spreads |
|---|---|---|
| Premium income per trade | Higher | Lower (net of long-leg cost) |
| Maximum loss | Open-ended | Capped at spread width less credit |
| Management intensity | High, continuous | Lower, max loss accepted at entry |
| Drawdown protection | None structural | Built in via long leg |
| Full-cycle per-capital performance | Lower over 5 years | Higher over 5 years |
There is also a complexity point that cuts the other way. Defined-risk spread traders accept their maximum loss at entry and can largely leave the position alone. Naked put traders must monitor open-ended exposure continuously, which is its own operational burden, and a heavier one under stress.
What you actually need to resolve is not which strategy wins more often. It is which strategy’s loss events your portfolio can structurally absorb. The premium drag on a spread is the price of answering that question in advance, before the market forces the answer on you.
Making a structural choice before the next selloff arrives
You cannot reliably time your way out of a crash. The four drawdowns in the study, September 2022, August 2024, March 2025 and April 2025, arrived across different market regimes and at irregular intervals. That pattern means the structural decision between naked short puts and put spreads has to be made during calm conditions, not improvised inside the selloff.
Run high-win-rate naked short puts through a bull market and you are quietly accumulating tail risk. It does not release gradually. It materialises in the next VIX spike, compressed into days, driven by delta, vega and liquidity firing simultaneously, exactly as they did last April.
The most practical structural fix is also the simplest.
- Purchase a lower-strike put against the position, converting the naked short put into a spread.
- Accept the reduced premium as the cost of a defined maximum loss.
- Gain a lower ongoing management burden, because the worst case is now fixed at entry.
- This article is for informational purposes only and should not be considered financial advice. Investors should conduct their own research and consult with financial professionals before making investment decisions.
When the active management argument breaks down
The stop-loss near 2 times credit received is a reasonable rule on paper. The April 2025 liquidity data shows why paper and practice diverge.
Equity bid-ask spreads near record highs since 2017, VIX options spreads averaging 69.72%: the precise moment you most need to execute a stop is the moment execution costs the most. A defined-risk spread sidesteps the problem entirely, because it never asks you to fire a stop-loss under stress. The maximum loss was bounded the day you opened the trade.
Past performance does not guarantee future results. Financial projections are subject to market conditions and various risk factors.
The data does not argue for perfection, it argues for survivability
Both facts are true at once. Naked short puts really did triple spreads’ returns in the bull market, and spreads really did outperform on a per-dollar-of-capital basis across the full five years. The 2% win-rate threshold separating them is narrow enough to be crossed by a single extended drawdown.
Nineteen years of Cboe index data quantify the long-run cost of premium selling with unusual precision: the Put Write Index returned 7.1% annualised against 10.9% for the S&P 500, a 3.8 percentage point annual gap that compounded materially over the full period, while still delivering lower drawdowns, extending the survivability argument well beyond the five-year study window this article examines.
Put spreads outperformed naked short puts on a per-dollar-of-capital basis over five years that included a prolonged bull market.
So the forward-looking question is not whether naked short puts will win more often over the next twelve months. They probably will. The question is whether your portfolio can absorb the loss event that a 19-20% drawdown with a VIX at 52.33 produces for an uncapped short put book, the kind of event that delivered a 1.7 times loss differential in April 2025.
That reframes the whole decision. Choosing a defined-risk structure is not a concession to fear. It converts a question about forecasting the market, which you cannot control, into a question about constructing the position, which you can. Survivability across a full cycle is a more defensible thing to compete on than win rate during the benign part of one.