
A split-share corporation can offer you a headline yield of 10.7% on its Class A shares while paying just 6.75% on the preferred shares sitting above them, and both figures come from the same underlying portfolio. That gap is not a bonus. It is the price of leverage, and someone is carrying the risk that produces it.
Products like these have multiplied across global markets, and retail investors now bump into them constantly: Canadian split-share corporations, 1.25x and 1.5x covered-call exchange-traded funds (ETFs), and leveraged closed-end funds (CEFs) all sold on the strength of a distribution number. The core tension is simple. In a trending, calm market, the leverage that inflates the yield can also lift the capital base underneath it. In a choppy or falling one, that same leverage quietly eats the capital that funds the distribution.
Here is what the mechanics actually tell you about when to reach for the yield and when to walk away.
What leveraged income structures actually are, and how they generate yield
You already understand the basic appeal: you want income, and these products promise more of it than a plain dividend fund. The question is where the extra yield comes from, because it does not appear from nothing.
Three structures dominate this space, and each applies leverage differently.
- Split-share corporations: A portfolio of dividend equities is split into two share classes. Preferred shares get a fixed distribution and first claim on assets; capital units (often called Class A) get everything left over, which means amplified upside and amplified downside.
- Leveraged covered-call ETFs: These apply a leverage multiplier (typically 1.25x or 1.5x) to an equity portfolio, then sell call options on it to generate premium income on top of dividends.
- Leveraged CEFs: These borrow money at institutional rates, invest the proceeds, and distribute the amplified income to shareholders.
The split-share mechanism is worth slowing down on, because the leverage is created by the capital structure itself, not by borrowed money at the fund level. Preferred shareholders lend their capital priority in exchange for a fixed, lower yield. Capital-unit holders take the residual, so they absorb losses first and collect gains last, which is exactly why their yield is higher.
The structural hierarchy in one number Brompton Global Dividend Growth Split Corp paid 6.75% on its preferred shares and 10.7% on its Class A shares as of 11 August 2025, with an asset coverage ratio of 54%.
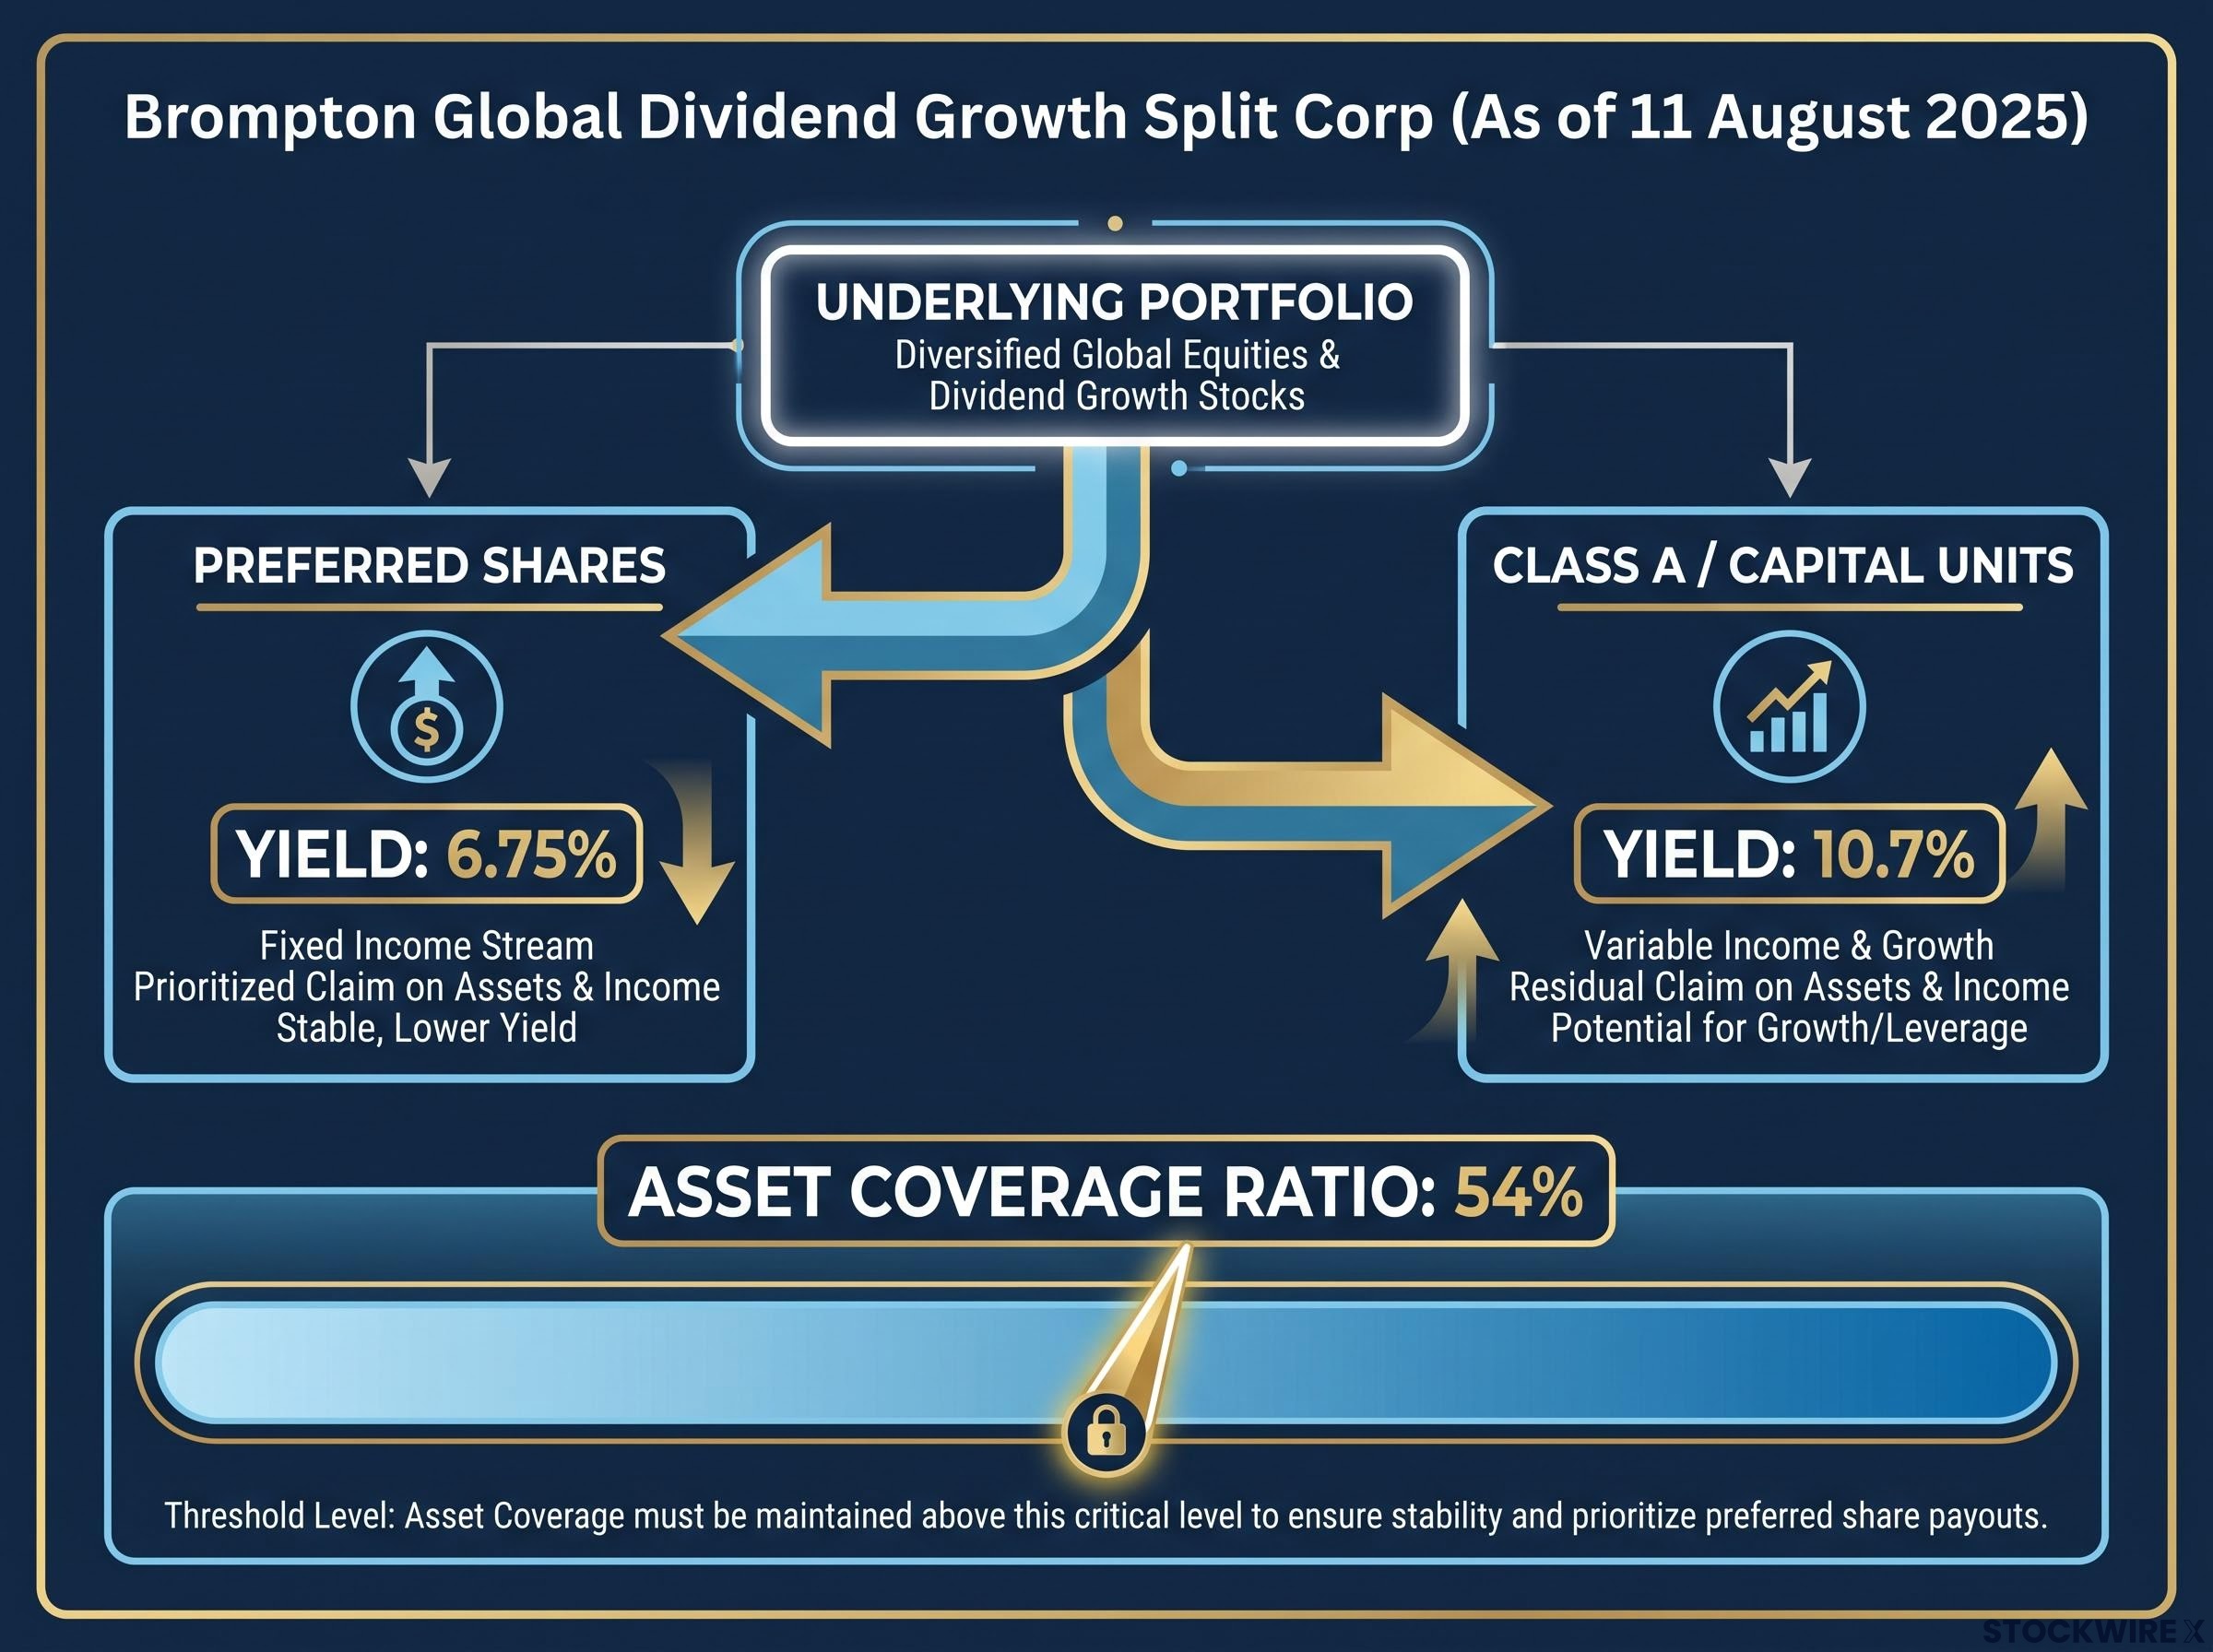
That 54% coverage ratio tells you something specific: more than half the portfolio’s value must be preserved simply to protect the preferred floor. Erode below that threshold and the distributions are directly at risk. Ninepoint Canadian Large Cap Leaders Split Corp follows the same logic, with its Class A units targeting a 10% yield and its preferred shares paying 7.5% toward a 2029 maturity target.
Covered-call overlays and leveraged CEFs: the other two mechanisms
A 1.25x or 1.5x covered-call ETF scales up the underlying equity portfolio before writing calls against it. That multiplier boosts both the dividend income and the option premium relative to an unenhanced covered-call fund, which is how the monthly distribution gets larger. The trade is that selling calls caps your capital upside; you are converting future price appreciation into cash today.
Leveraged CEFs work through borrowing. They amplify the portfolio with institutional debt, then pass the enhanced income through to you, which makes their distributions sensitive to two things at once: how the underlying assets perform, and what the borrowing costs. CEFD (the ETRACS 1.5x Leveraged CEF ETN) distributed US$2.72 in 2024 and US$2.86 in 2025, a cash stream that only holds up while both variables stay favourable.
When big ASX news breaks, our subscribers know first
When leverage outperforms: the market conditions that make these strategies work
The outperformance case is real, but it is conditional, and the conditions are specific. Leveraged equity ETFs deliver a fixed multiple of an index’s daily return, and because that exposure resets every day, returns compound on a shifting base.
In a strongly trending, low-volatility bull market, that daily reset works for you. Positive return autocorrelation, meaning gains tend to follow gains, aligns the rebalancing trades with the trend. The fund buys more exposure into strength, and over time the compounding can push total returns above the nominal leverage multiple.
The cost of sitting this dynamic out shows up plainly in the data.
The price of going unlevered Technology income portfolios without borrowed capital trailed their primary underlying benchmark by roughly 20% across a 36-month span ending September 2024.
A 20-percentage-point gap over three years means the conservative, unenhanced choice did not simply pay less income. It left a substantial slice of the portfolio’s compounding potential on the table during a stretch that rewarded leverage directly. The same pattern appeared in financials: a domestic financial fund running a 1:1 equity-to-borrowed-capital ratio vastly outperformed alternatives capped at a 1.25x debt ratio across a 42-month period ending in mid-September 2024.
Modest leverage does its work quietly in covered-call strategies too. Applying around 1.25x scales both the dividend income and the option premium, lifting monthly cash distributions without pushing anywhere near extreme leverage.
| Sector | Structure Type | Leverage Level | Multi-Year Return | Notes |
|---|---|---|---|---|
| Technology | Option-writing income fund | Unlevered | Trailed benchmark by ~20% over 36 months (to Sept 2024) | Cost of going unlevered in a trending sector |
| Financials | Domestic equity fund | 1:1 equity-to-debt | Outperformed 1.25x alternatives over 42 months (to mid-Sept 2024) | Higher leverage rewarded in a favourable window |
| Infrastructure | Split-share (Class A) | Structural | 21.72% YTD, 26.12% 1-year (to 31 Aug 2026) | Middlefield Infrastructure Dividend Split Corp, 10% yield on issue |
Commodity-equity structures show the same effect on a smaller scale. Global X Enhanced Gold Producer Equity Covered Call ETF (GLCL) posted a 3-year compound annual growth rate of 3-5% as of August 2026, ahead of unlevered comparators like the VanEck Gold Miners ETF (GDX) and iShares S&P/TSX Global Gold Index ETF (XGD), both in the 1-3% range. The lesson for you is not that leverage always wins. It is that these returns depend on a trending, low-volatility regime, so the useful question is whether that regime currently exists, not whether it existed in the historical data.
Where leverage backfires: volatility decay, structural costs, and the downside scenarios
Now run the same mechanism in reverse. The daily reset that compounds your gains in a trending market systematically amplifies your losses in a choppy one, and the maths is unforgiving.
Three mechanisms do the damage, roughly in order of how quietly they work:
- Volatility decay (beta slippage): When an index oscillates rather than trends, the fund repeatedly buys exposure after gains and cuts it after losses. That is buying high and selling low on a schedule, and it erodes capital even if the underlying index finishes flat. The decay is proportional to the square of the leverage and the variance of returns, so it accelerates fast as volatility rises.
- Structural cost drag: High management expense ratios (MERs) can consume the yield before any market loss even occurs.
- Physical commodity options limitations: Writing calls on physical commodity ETFs monetises volatility without any underlying growth engine to offset the capped upside.
The cost drag is easiest to see in a real figure.
When costs eat the yield S Split Corp (Mulvihill) carried an MER of 10.35% annualised, including preferred distributions, and delivered a total return per unit of negative 2.58% for the six months to 30 June 2024.
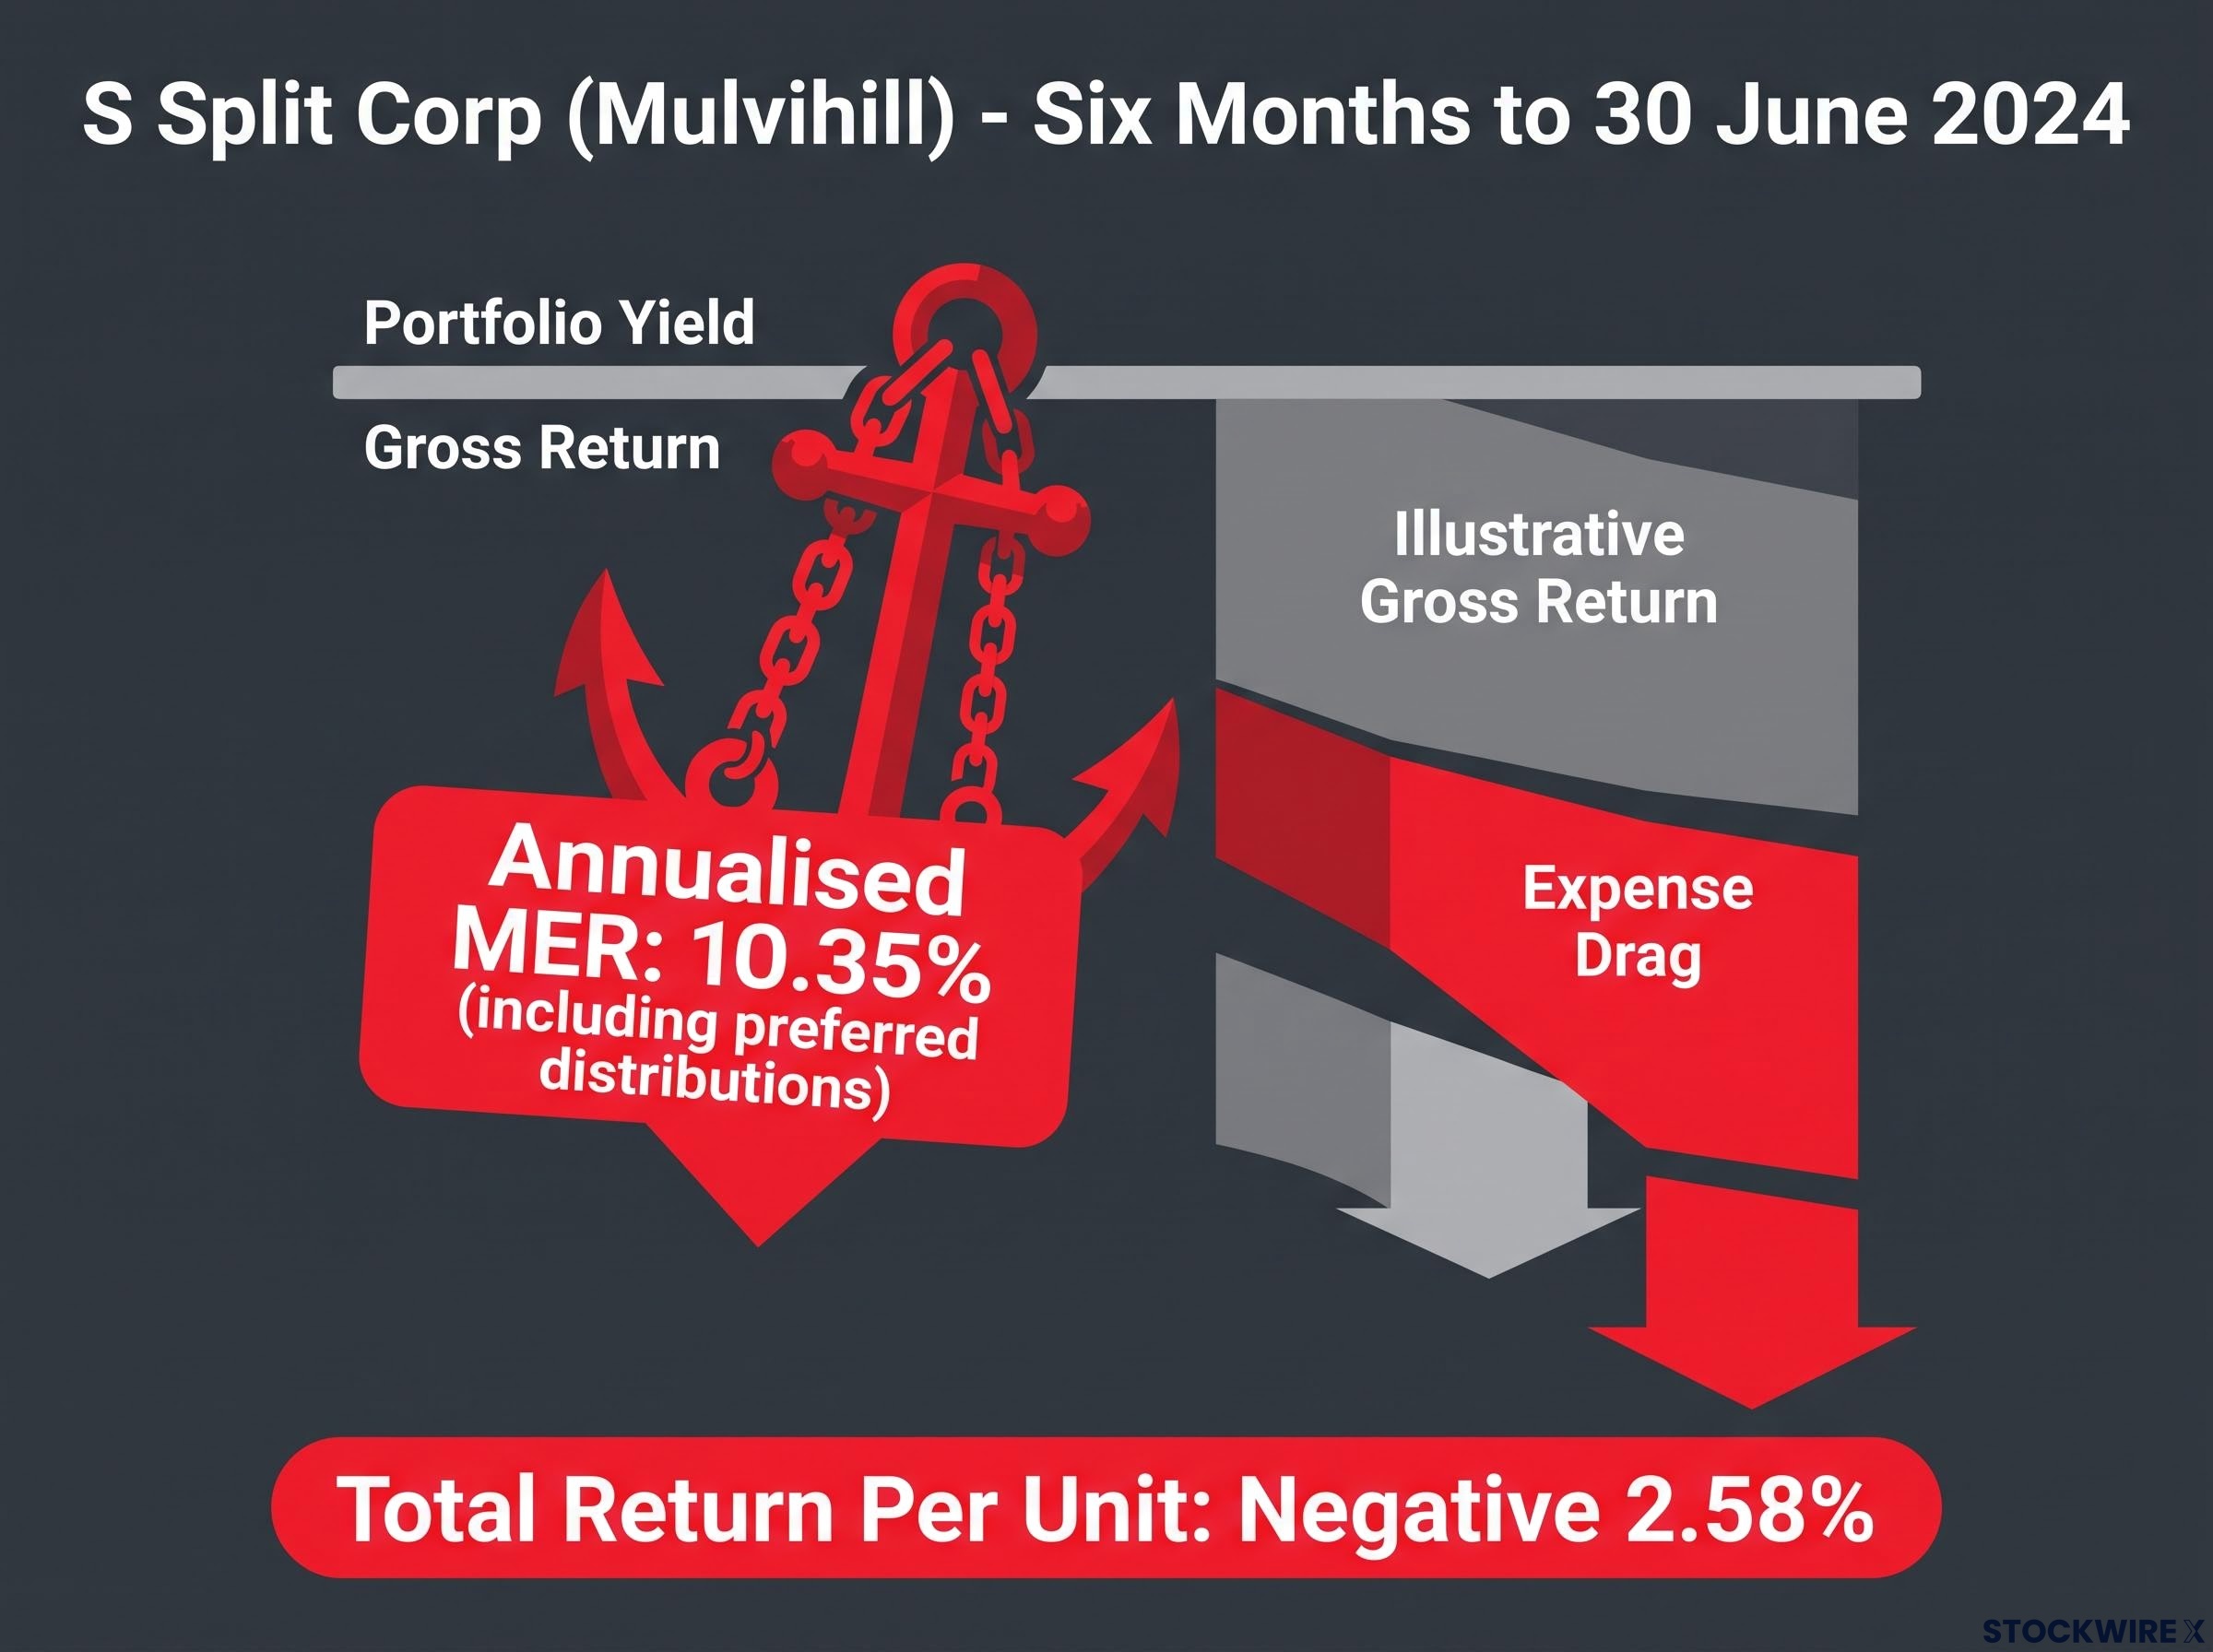
A 10.35% MER means the portfolio must generate more than 10 cents of return per dollar of assets just to stand still. That tells you the headline yield is not profit until the structural burden is cleared first, and in a soft market it may never be. Recall too that Brompton’s 54% asset coverage ratio leaves little room: a sharp drawdown can impair the preferred floor quickly, and distribution suspensions can arrive faster than holders expect.
Why writing options on physical gold is a different risk category
A physical commodity ETF generates no dividends and no internal corporate earnings; it simply tracks spot prices net of storage and roll costs. Writing covered calls on it therefore purely monetises volatility, with no offsetting business growth, reinvestment, or dividends of the kind an equity-based strategy provides.
The margins confirm how thin the edge is. ZWGD, an options-enhanced precious metals fund, returned 14.2% year-to-date with a 2.1% dividend yield versus SPDR Gold Shares (GLD) at 13.67% over the same period ending 23 September 2025. That is a narrow win, and it stands in contrast to the far wider spreads equity-based leveraged strategies can produce, which is why the risk-reward calculus differs between commodity and equity options overlays.
The tail risk is not hypothetical. Critics point to the 2020 pandemic volatility and the 2022 UK liability-driven investment (LDI) crisis as episodes where leveraged structures destabilised rapidly under macroeconomic shock. Regulators noticed. On 3 December 2025, the SEC halted its review of proposals for new ETFs seeking 3x-5x exposure and sent warning letters to issuers including Direxion and ProShares, citing Rule 18f-4’s value-at-risk limits.
What the regulatory environment tells you about where the risk ceiling is
The regulatory record is not compliance trivia. It is a signal you can read, and the signal is that regulators have effectively drawn a line at roughly 2x leverage for new products.
That line did not appear overnight. The interventions trace a coherent arc from retail suitability concern to systemic risk.
- 2023 SEC Investor Bulletin: Warned that the multi-day performance of leveraged ETFs can differ significantly from their stated daily objectives, exposing investors to “significant and sudden losses”.
- Earlier SEC and FINRA alerts: Classified these products as generally unsuitable for retail investors intending to hold longer than a single day.
- December 2025 halt and warning letters: The SEC paused review of 3x-5x proposals and cited Rule 18f-4, tying extreme leverage to systemic concern.
The regulator’s own words The SEC’s 2023 bulletin warned that leveraged ETFs expose investors to the potential for “significant and sudden losses”.
Rule 18f-4 sets a value-at-risk framework, meaning it caps how much a fund can plausibly lose over a defined period, and that framework now defines the upper leverage boundary for new ETF products. What that implies for you is direct: a product sitting close to that ceiling is operating at the edge of what regulators consider acceptable, and one pushing past it carries structural uncertainty on top of market risk.
The case is not one-sided, and it is worth representing fairly. Proponents, including the academic paper “In Defense of Leveraged and Inverse Funds”, argue these products behave exactly as designed and are legitimate tools for investors who understand them. Critics counter that retail investors systematically misjudge path-dependent risk, particularly in split-share preferred models where a drop in the underlying sector can suspend capital-unit distributions faster than holders anticipate.
The SEC’s December intervention tells you that anything above 2x now sits in a regulatory grey zone where the product’s own viability carries risk. Practically, that hands you a shortcut: products at or below roughly 1.5x leverage operate within the established framework, while those reaching toward 3x-5x carry a layer of structural uncertainty the yield figure alone will never show you.
Making an informed call on leveraged income in your portfolio
You now have both sides of the ledger, so the task is turning that into a repeatable test you can apply to the next product a broker or advertisement puts in front of you.
Run every leveraged income product through the same five questions:
- Market environment: Is the regime currently trending and low-volatility, or choppy? The former favours leverage; the latter feeds volatility decay.
- Leverage level: Is it at or below 1.5x? That keeps you inside the regulatory framework.
- Underlying asset type: Is it equity-based, with dividends and growth, or physical commodity, which only monetises volatility?
- Structural cost: What is the MER, and how much return must the portfolio generate before you see a cent of profit?
- Asset coverage ratio: In a split-share structure, how much cushion protects the preferred floor before distributions are threatened?
Notice how those questions are forward-looking, while the headline yield that dominates product marketing is backward-looking. The yield tells you what happened last year. The coverage ratio, cost structure, and current volatility regime tell you whether it can happen again.
Preferred shares versus capital units versus leveraged CEFs: matching structure to risk appetite
These three sit inside the same category but occupy very different risk profiles. Preferred shares are the income-stability choice: priority claim, lower yield, less variability. Class A capital units are the growth-amplification choice, with higher potential returns and genuine distribution variability. Leveraged CEFs are the hybrid, heavily dependent on borrowing costs and on whether the fund trades at a premium or discount to its net asset value.
| Structure Type | Yield Range | Primary Risk Factor |
|---|---|---|
| Split-share preferred shares | 4.80% – 7.03% (Brompton suite, June 2025) | Asset coverage erosion below preferred floor |
| Split-share Class A units | ~10% (e.g. Ninepoint, Middlefield on issue) | Amplified downside and distribution suspension |
| Leveraged CEFs | Varies with NAV and borrowing costs | Borrowing cost sensitivity and NAV discount |
The Brompton preferred range, from 4.80% on GDV.PR.A to 7.03% on ESP.PR.A as of 10 June 2025, tells you that even the lower-risk tier offers a meaningful premium over investment-grade fixed income, but only while the underlying equity portfolio holds its value well enough to maintain coverage. Higher up the risk curve, the Nuveen Global High Income Fund (JGH) posted NAV total returns of 13.45% in 2024 and 8.99% in 2025, and Brompton SPLT returned 13.9% in 2024, showing what these structures deliver in a constructive year. Choosing between them on yield alone skips the single most important variable in the evaluation.
This article is for informational purposes only and should not be considered financial advice. Investors should conduct their own research and consult with financial professionals before making investment decisions. Past performance does not guarantee future results, and financial projections are subject to market conditions and various risk factors.