For the first time, the United States is paying more than $1 trillion a year just to service the interest on its national debt. It is the kind of number that stops you cold, and it is meant to.
But the dollar figure is the wrong lens. Economists who study whether a country’s borrowing is sustainable barely glance at the headline total. They look at a ratio, and at a relationship between two rates that most headlines never mention.
That relationship is projected to flip around fiscal year 2031, when the average interest rate the government pays on its debt is expected to overtake the pace at which the economy grows. This is the moment that changes the arithmetic of US debt sustainability, and it has a specific name in economics: the point where r exceeds g.
What follows here gives you the analytical framework economists actually use to judge whether debt is manageable, the numbers that define where the country stands today, and a clear-eyed look at what the 2031 crossover really changes.
Why the trillion-dollar figure is the wrong thing to worry about
Start with the number you already know: net interest payments have crossed $1 trillion for the first time. It sounds catastrophic. In isolation, it means almost nothing.
A debt is only as heavy as your ability to carry it. A household earning $500,000 can service a mortgage that would crush a household earning $50,000. The same logic governs a country, which is why economists measure debt against the size of the economy rather than in raw dollars.
By that measure, US debt held by the public sits at roughly 99-100% of GDP at the end of fiscal year 2025, according to the Congressional Budget Office (CBO). That is close to, but not yet above, the post-World War II record of 106% of GDP. So the level is high by historical standards, but it is the direction of travel that determines sustainability.
Direction is decided by a comparison between two rates.
When nominal economic growth exceeds the average interest rate on debt, the debt-to-GDP ratio can stabilise or decline even without repaying principal.
That single relationship is the whole framework. If your income grows faster than the interest piling up on what you owe, the debt shrinks relative to your means even if you never pay down the balance. If the interest outruns your income, the reverse happens, and you can drift underwater while making every payment on time.
Three variables tell you which way the arithmetic is pointing:
- Debt-to-GDP ratio: the size of the debt measured against the economy’s annual output, and the true gauge of how burdensome borrowing is.
- Average interest rate on debt (r): the blended rate the government pays across all its outstanding bonds.
- Nominal growth rate (g): how fast the economy is expanding in dollar terms, including inflation.
Right now the numbers favour the government. The US economy grew at an annualised nominal rate of roughly 6.5% in the first half of the current fiscal year, while the average interest rate on outstanding debt is around 3.5%. That leaves a gap of about 3 percentage points in favour of growth over borrowing cost.
That 3-point gap is the number to track through the rest of this piece, not the trillion-dollar headline. It is the buffer that keeps the debt ratio from accelerating, and everything that matters depends on whether it holds.
When big ASX news breaks, our subscribers know first
How close to the edge the US actually is right now
A favourable growth gap does not give the government unlimited room to borrow. It gives a specific, calculable amount of room, and the US has almost used all of it.
The concept that makes this measurable is the primary deficit: government spending minus revenue, excluding interest costs. It is the borrowing the country does to run its day-to-day operations, separated out from the cost of servicing debt it already carries. It is the part policymakers actually control in the near term.
Here is the arithmetic. The total federal deficit is running at roughly 6% of GDP. Net interest accounts for about 3.2 percentage points of that. Strip out the interest and you are left with a primary deficit of roughly 3% of GDP.
Now connect that to the growth buffer. When nominal growth exceeds the interest rate by about 3 percentage points, the government can sustain a primary deficit of up to roughly 3% of GDP without pushing the debt ratio higher.
Look at those two numbers again. The sustainable ceiling is around 3% of GDP. The actual primary deficit is around 3% of GDP. They match almost exactly.
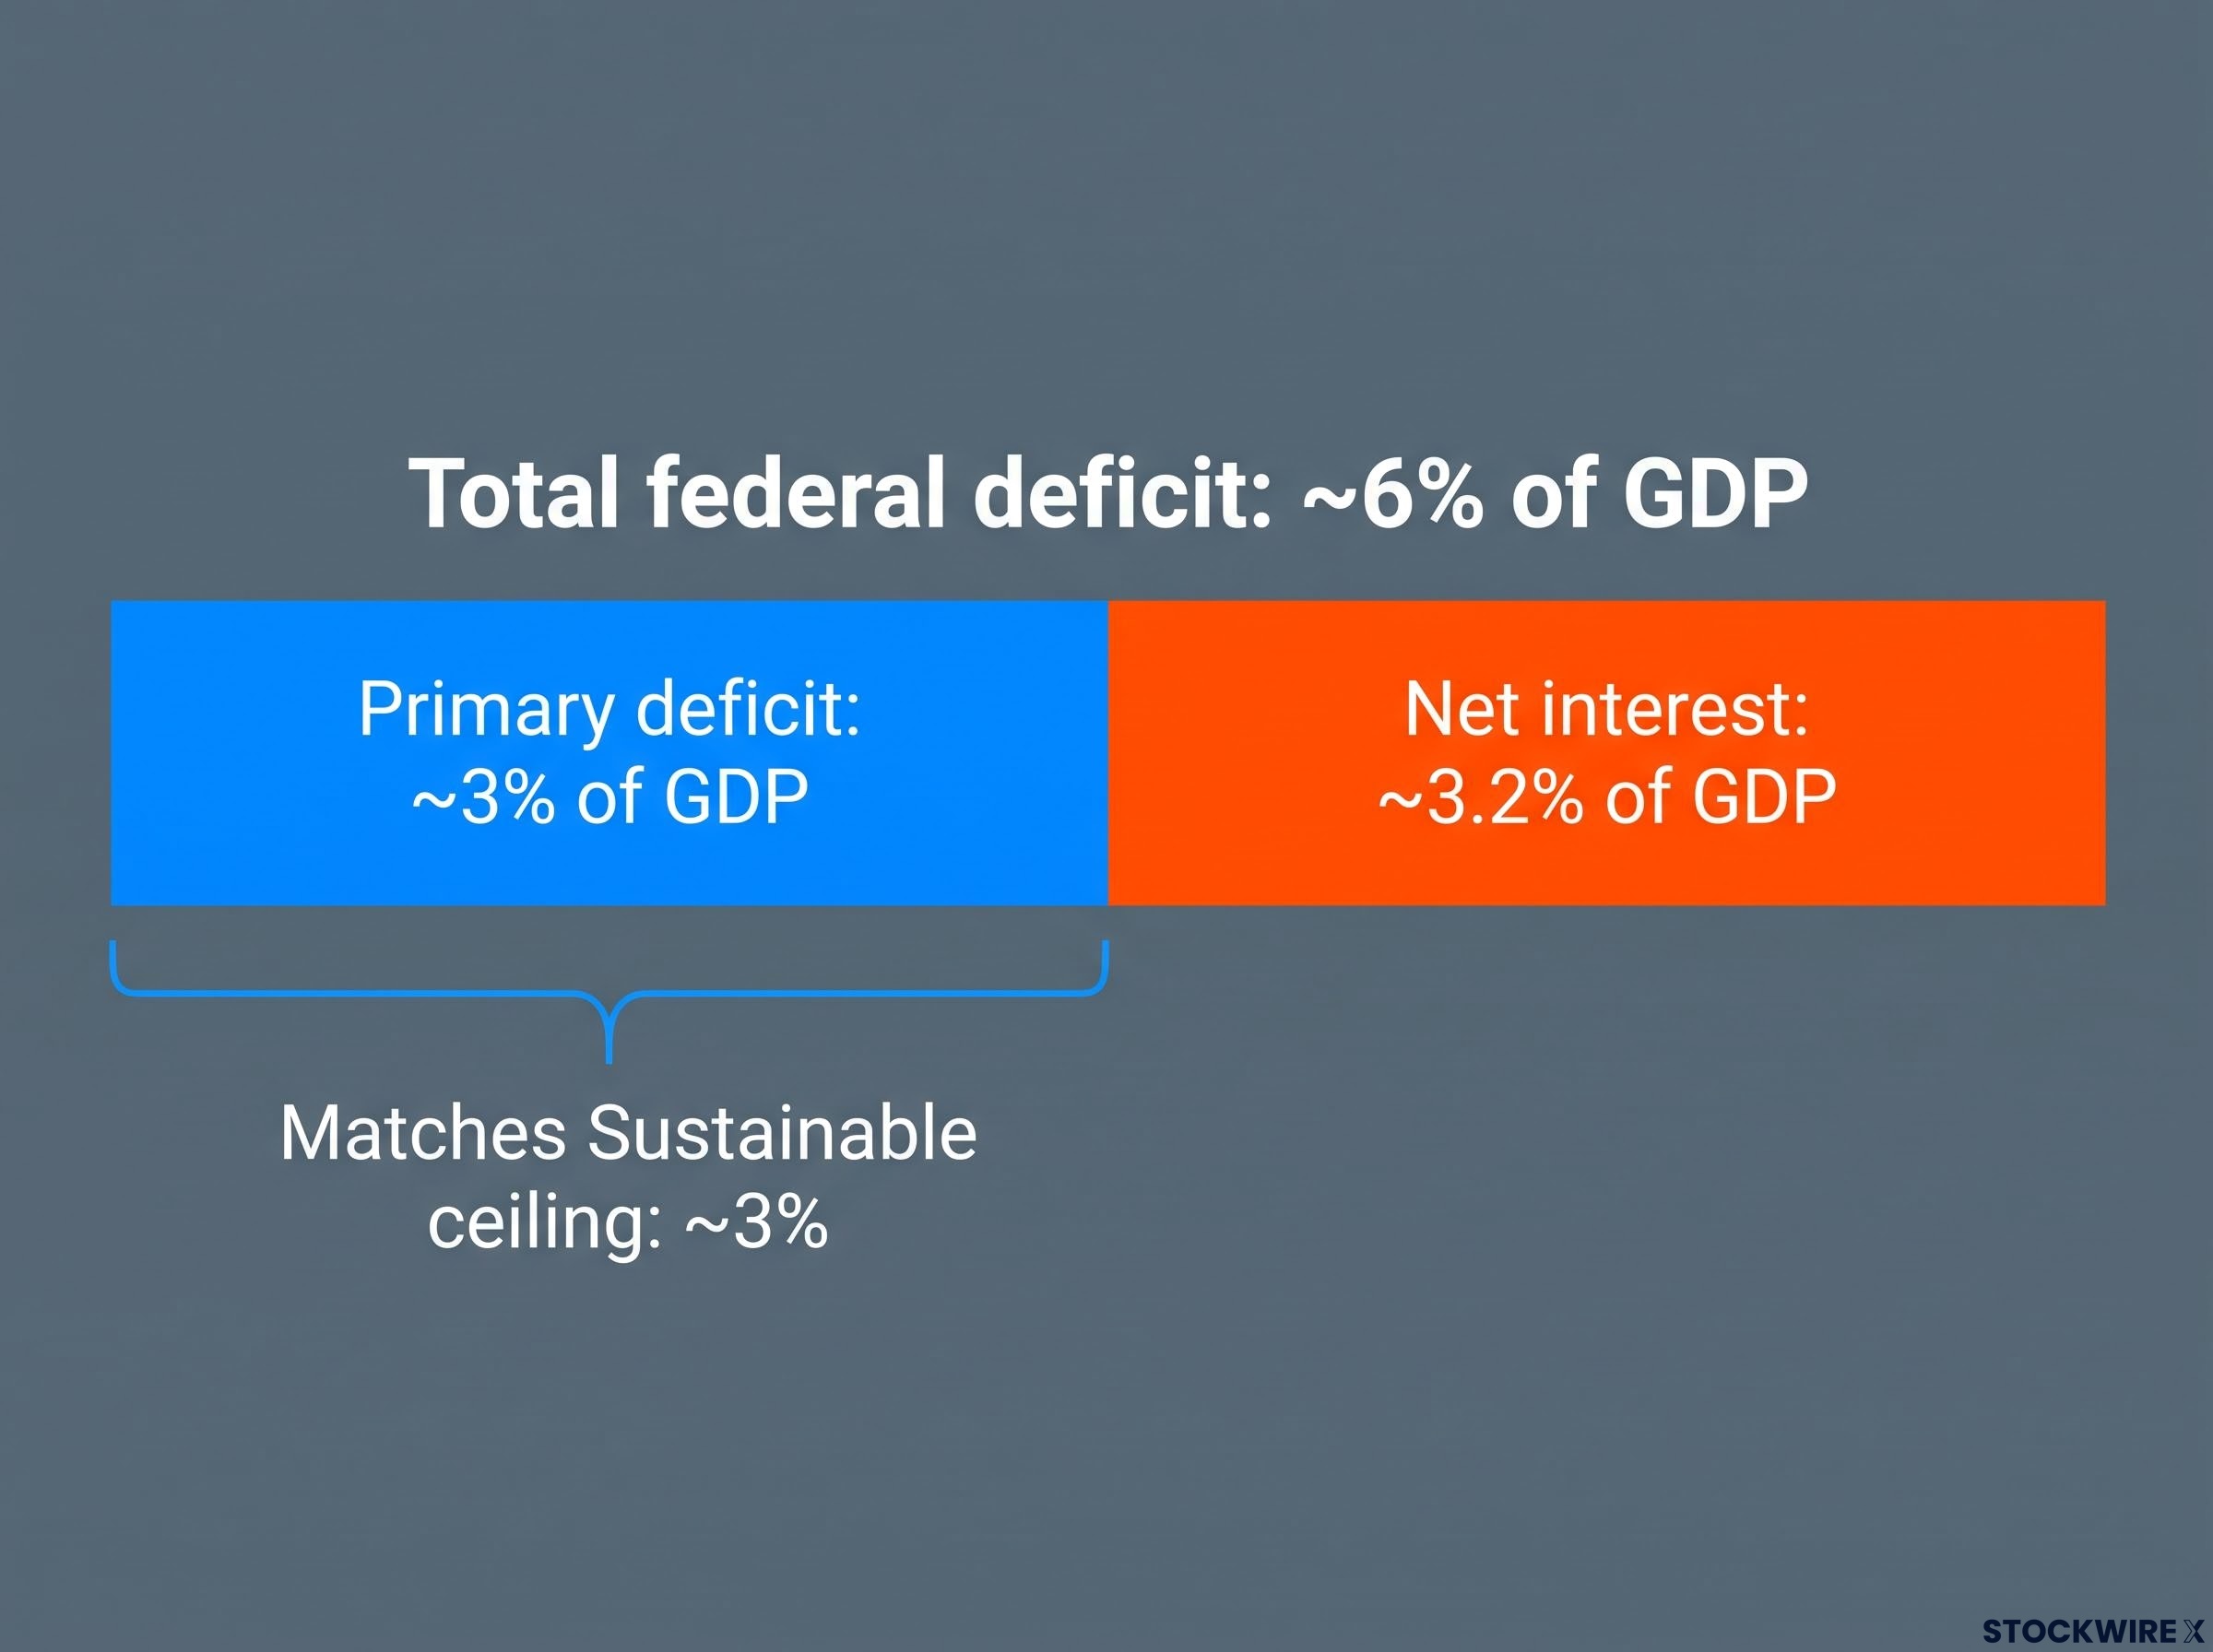
That is what “no buffer remaining” means in practice. The US is not comfortably inside its fiscal limits; it is running at precisely the maximum its growth gap can absorb. Any slowdown in growth, any rise in borrowing costs, or any widening of the primary deficit tips the arithmetic straight into a rising debt ratio.
Mandatory spending growth, running at roughly 7.5% annually against federal revenue growth of around 4%, compounds the primary deficit pressure independently of interest costs, meaning the structural gap between what the government spends and what it collects widens even before the r>g crossover reshapes the arithmetic.
| Metric | Current figure | Threshold / projection |
|---|---|---|
| Total deficit (% GDP) | ~6% | Averages above 6% through 2036 (CBO) |
| Net interest (% GDP) | ~3.2% | Rises to 4.6% by 2036 (CBO) |
| Primary deficit (% GDP) | ~3% | Sustainable ceiling ~3% |
| Nominal growth rate (g) | ~6.5% | Projected to slow toward ~3.8% |
| Average interest rate (r) | ~3.5% | Projected to rise toward ~3.8% |
| Sustainable primary deficit | ~3% | Falls as the growth gap closes |
The scale of the interest bill underlines how little slack there is. Net interest outlays reached approximately $970 billion in fiscal year 2025, equal to 3.2% of GDP, according to the CBO. Among all categories of federal spending, only Social Security costs more.
What the interest bill looks like over the next decade
The forward trajectory is where the pressure compounds. The CBO projects net interest rising from roughly $1.0 trillion in fiscal year 2026 to approximately $2.1 trillion by fiscal year 2036, an average increase of about 7.5% per year. As a share of the economy, net interest climbs from 3.3% of GDP in 2026 to 4.6% by 2036, approaching nearly one-fifth of all federal spending.
Across the whole window, the CBO puts cumulative net interest at roughly $16.2 trillion for 2026 to 2036.
What guarantees this upward march is the gap between old rates and new ones. The 30-year Treasury auction in August 2026 cleared at a yield of approximately 5.216%, the highest since 2001. Every time the government refinances a maturing low-rate bond at a level like that, it locks in a cost far above the current 3.5% average, dragging that average steadily higher. For you as an observer, that means the rising interest bill is not a forecast that might be wrong; it is largely baked in by bonds already being issued.
With each rollover cycle, cheaper legacy bonds issued during the near-zero rate era are replaced by new issuance clearing above 5%, and the weighted average interest rate on marketable Treasuries, near 3.45% today, rises mechanically toward whatever the market demands at each successive auction.
What the 2031 crossover actually means, and why it changes everything
The single most important date in this whole picture is fiscal year 2031. That is when the CBO baseline projects the average interest rate on debt and the nominal growth rate to converge, both landing at approximately 3.8%. At that point the buffer you have been tracking disappears.
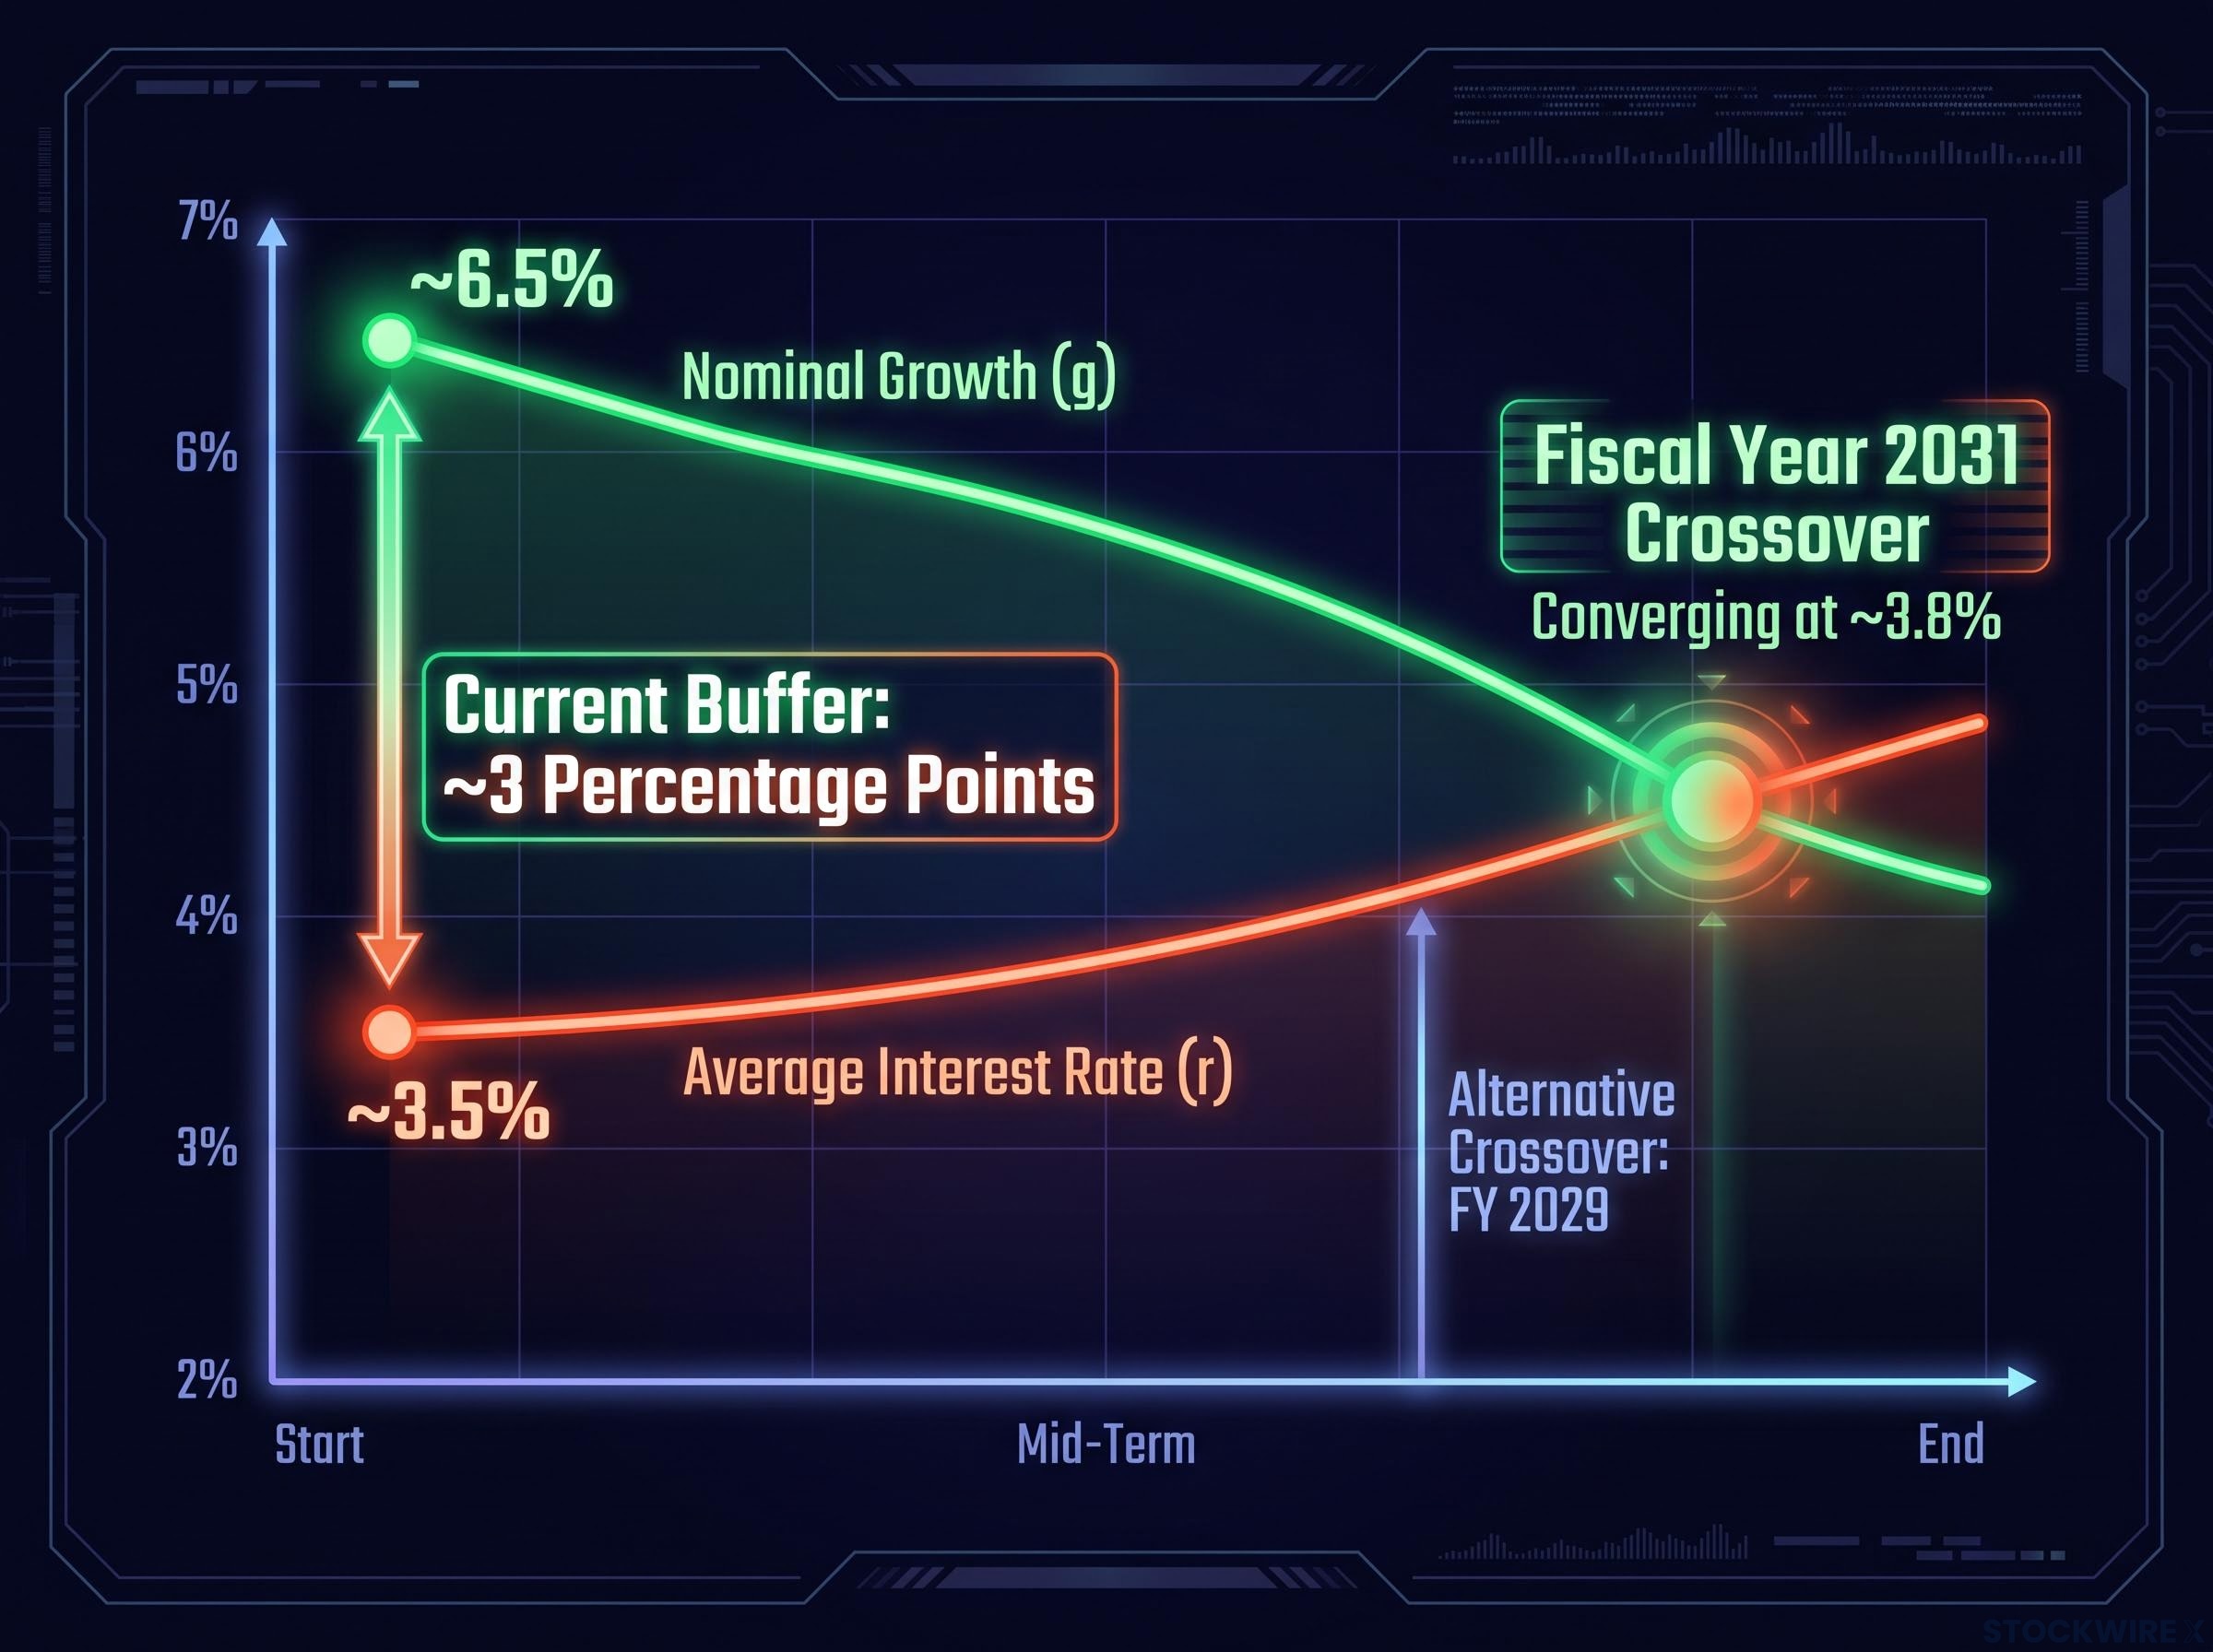 show participants pencilling in real GDP growth below 2% over the medium term, which, combined with moderating inflation, puts nominal growth on a path converging toward the rising average cost of outstanding debt.
Here is why the date matters to you personally. Any fiscal decision made before the crossover operates under forgiving arithmetic; the same decision made after it operates under punishing arithmetic. Timing becomes as important as size.
Two bets on the remedy, and what each one requires to be right
Two prominent figures have staked out opposing responses to the same set of numbers. Strip away the politics and each is a coherent economic bet with its own conditions for success.
Investor Stanley Druckenmiller reads rising long-term yields as a warning from the bond market that borrowing must come down. His camp argues for closing the primary deficit directly through spending restraint, revenue increases, or entitlement reform, generating the surpluses that offset r>g pressure. The gamble is on the demand side: reduce what the government borrows.
Treasury Secretary Scott Bessent takes the other side. His position is that markets should not dictate policy and that stronger growth is the structural fix. Lift potential growth high enough and you widen the gap between g and r, improving the debt dynamics even while borrowing costs stay elevated. The gamble is on the supply side: make the economy grow faster than its debt.
Both are genuine answers to the arithmetic already laid out, and each carries a distinct failure mode.
| Position | Mechanism | What must be true | Primary risk |
|---|---|---|---|
| Druckenmiller: cut borrowing | Reduce the primary deficit toward surplus to offset r>g | Fiscal tightening delivers surpluses without choking growth | Consolidation drags on g while r stays high, worsening the gap |
| Bessent: grow out of it | Lift potential growth so g outpaces a rising r | Supply-side gains raise g fast enough before 2031 | Growth fails to materialise in time and r overtakes g anyway |
The tension is visible in the current rates. The average cost across all outstanding debt sits near 3.49% as of August 2026, while new 30-year borrowing clears above 5.2%. That gap tells you r is only heading in one direction, which sharpens the pressure on whichever bet policymakers choose. The CBO stays neutral on the policy mix, but its arithmetic is unambiguous: after the crossover, stabilising debt requires surpluses, not merely smaller deficits.
Investors weighing whether the Druckenmiller or Bessent thesis is more likely to succeed will find our full explainer on how major institutions are repositioning, which covers BlackRock, JPMorgan, Goldman Sachs, and Bridgewater’s convergent shift away from long-duration Treasuries toward real assets.
What the US has going for it that smaller countries do not
None of this means a crisis is imminent, because the US carries structural advantages that smaller economies lack.
- Reserve currency status: the dollar’s role as the world’s dominant reserve currency, and the depth of Treasury markets, provide a large and stable base of buyers, making a sudden funding freeze far less likely.
- Federal Reserve capacity: the Fed can conduct independent monetary policy and, in extreme conditions, act as a buyer of last resort for Treasuries, though not without inflation and credibility risks.
- Nominal debt erosion: moderate inflation and real growth gradually shrink the real burden of existing fixed-rate debt over time.
The CBO characterises the long-term path as unsustainable without policy changes, while also noting that these institutional strengths allow for measured, gradual responses rather than abrupt shocks. For your own calibration, treat the advantages as lowering the odds of a near-term crisis without altering the underlying arithmetic one bit.
Where 2031 fits in a longer picture
Pull the threads together and the next five years come into focus. The r>g framework says debt is sustainable while growth outruns borrowing costs. The current buffer of roughly 3 percentage points is real but fully consumed by the existing primary deficit. And that buffer is projected to close entirely by fiscal year 2031, or as early as fiscal year 2029 if rates stay high.
The average rate on outstanding debt has already climbed from about 1.5% five years ago to roughly 3.5% today, and it is still rising as cheap legacy bonds roll off. Debt held by the public, near 101% of GDP now, is on track to break the 106% post-war record around fiscal year 2030 and reach roughly 120% by 2036, with deficits averaging above 6% of GDP across the decade.
Three variables will tell you which way this resolves:
- The average interest rate on outstanding debt: rising faster than expected pulls the crossover forward and shortens the runway.
- The nominal growth rate, split into its inflation and real-growth parts: durable real growth widens the buffer; growth built mostly on inflation is fragile.
- The primary deficit as a share of GDP: every point it narrows before 2031 reduces the surplus required afterward.
The CBO characterises the long-term debt path as unsustainable without policy changes, yet notes that US institutional strengths provide scope for measured, gradual responses rather than abrupt shifts.
Read that way, 2031 is not a cliff edge. It is a threshold, and what determines whether crossing it is uncomfortable or genuinely destabilising is the set of fiscal and growth choices made in the years immediately before it, choices that remain unmade.
The framework holds, the trajectory does not have to
The value of the r>g framework is that it survives whatever the politics do to it. Whether the debt path improves or deteriorates, the same three variables (the interest rate, the growth rate, and the primary deficit) will tell you the story before any headline does. That framework is now yours to use, independent of any single forecast.
The crossover is projected, not guaranteed. The choices made between now and 2031 decide whether the arithmetic tightens or eases, which means the outcome is still genuinely open. Track the three variables in real time and you can judge each fiscal package, tax proposal, and Fed decision on what it does to the actual arithmetic, rather than accepting the framing offered by either camp.
For investors wanting to monitor whether the arithmetic is tracking toward the earlier 2029 crossover date, our dedicated guide to Treasury market signals covers the specific auction performance metrics, term premium indicators, and foreign holdings data that would confirm a repricing of US fiscal risk.
This article is for informational purposes only and should not be considered financial advice. Investors should conduct their own research and consult with financial professionals before making investment decisions. Past performance does not guarantee future results, and financial projections are subject to market conditions and various risk factors.