The Federal Reserve delivered a rate hike on 16 September 2026, and the equity market did not take it quietly. Within minutes of the FOMC press conference, S&P 500 E-mini futures were sliding and Treasury yields were pushing toward levels not seen in years.
Underneath the headline selloff, something more revealing was happening in the options market. The prices of downside protection on the S&P 500 detached sharply from the prices of upside bets, and crude oil options bent in the opposite direction entirely. This is where institutional money quietly shows its hand.
Reading this hidden data requires understanding options skew: the pricing gap between puts and calls that maps out where large funds believe the real risk sits. Here is the framework for decoding institutional fear and opportunity through that pricing, using the live numbers from September 2026 to show you exactly what the derivatives market is signalling right now.
The macro catalyst shaking institutional confidence
The pain started with policy. On 16 September 2026, the Federal Reserve lifted its target range by 25 basis points to 3.75%-4.00%, and in doing so effectively erased any remaining hope of a rate cut before year-end. Markets are now pricing in the possibility of one further 25 basis point hike later in 2026.
For equities, that is a hostile setup. Growth is decelerating, borrowing costs are elevated, and the reward for holding risk-free government debt keeps climbing. The immediate reaction to the press conference was broad and negative, with nearly every major instrument trading lower.
Here is how the key assets moved during the session:
- S&P 500 E-mini futures: fell roughly 65-66 points
- NASDAQ: dropped approximately 120-130 points
- 10-year Treasury yield: traded around 5%
That last figure is the one that matters most. When you can earn close to 5% on risk-free Treasuries, the case for holding volatile equities weakens, and institutional capital starts demanding severe downside protection on the exposure it already owns. That is precisely why options pricing turned defensive so quickly.
None of this points toward fresh record highs. Analysts note that a return to all-time highs requires supportive catalysts, and the current mix of slowing growth, restrictive rates, and elevated yields does not provide them. Understanding this backdrop keeps you from reading options pricing in a vacuum: central bank policy is the direct cause of the defensive positioning you are about to examine.
When big ASX news breaks, our subscribers know first
Decoding the volatility surface
Pull up an options chain and you will notice something odd. Two contracts sitting an equal distance above and below the current price rarely cost the same. That price difference is the signal, and it tells you where demand is concentrated.
Options are priced by supply and demand like anything else. A put option, which gives its holder the right to sell at a set price, gains value when buyers fear a fall. A call option, which gives the right to buy at a set price, gains value when buyers expect a rise. When puts consistently cost more than equidistant calls, it means more money is chasing downside insurance than upside exposure.
Options are priced by supply and demand like anything else, and implied volatility is the single number that captures that collective demand at every strike, translating raw market fear into a figure your options platform uses to price every Greek and probability estimate you see on the chain.
For equity indices, this asymmetry is not a temporary quirk. It became structural after a single day.
The day that permanently changed downside pricing On 19 October 1987, the Dow lost 22.6% in one session. Ever since, equity-index volatility surfaces have been persistently negatively skewed, with downside protection carrying a permanent premium.
NBER research on post-1987 options skew documents how the crash created a permanent volatility smirk in S&P 500 futures options, establishing the structural negative skew in equity index pricing that persists as the baseline every trader reads against today.
That baseline of mild negative skew is normal. The signal worth watching is when it steepens into extreme territory ahead of a major event, such as an FOMC meeting or a geopolitical flashpoint. That is when institutions pivot hard into protective puts.
You can see that demand in the raw ratios. ETF options are currently trading with put-to-call ratios around 1.7, meaning roughly 1.7 puts change hands for every call. That reflects structurally skewed hedge demand rather than a balanced two-way market.
So when you see puts costing significantly more than equidistant calls, you are watching large funds willingly overpay for insurance. They are telling you they view a catastrophic drop as more likely than a massive rally. This is the leap that takes you beyond simply glancing at the VIX and into reading a three-dimensional map of what the market actually expects.
The ten-to-one downside disparity in the S&P 500
Abstract fear becomes concrete the moment you look at real contract prices. With S&P 500 futures trading around 7,500, the 18 December 2026 expiration lays the disparity out in dollars.
Consider protection against a 500-point drop versus a 500-point rally. A 7,000 strike put, roughly 500 points out of the money, was priced near $9,300-$10,000. The equivalent upside call, around the 8,050 one-standard-deviation mark, cost approximately $4,300. Downside insurance ran more than double the price of equivalent upside exposure.
Push the distance out further and the gap becomes stark. A 6,500 strike put, roughly 1,000 points below current levels, was priced near $5,000, while a call 1,000 points above the market cost only around $500.
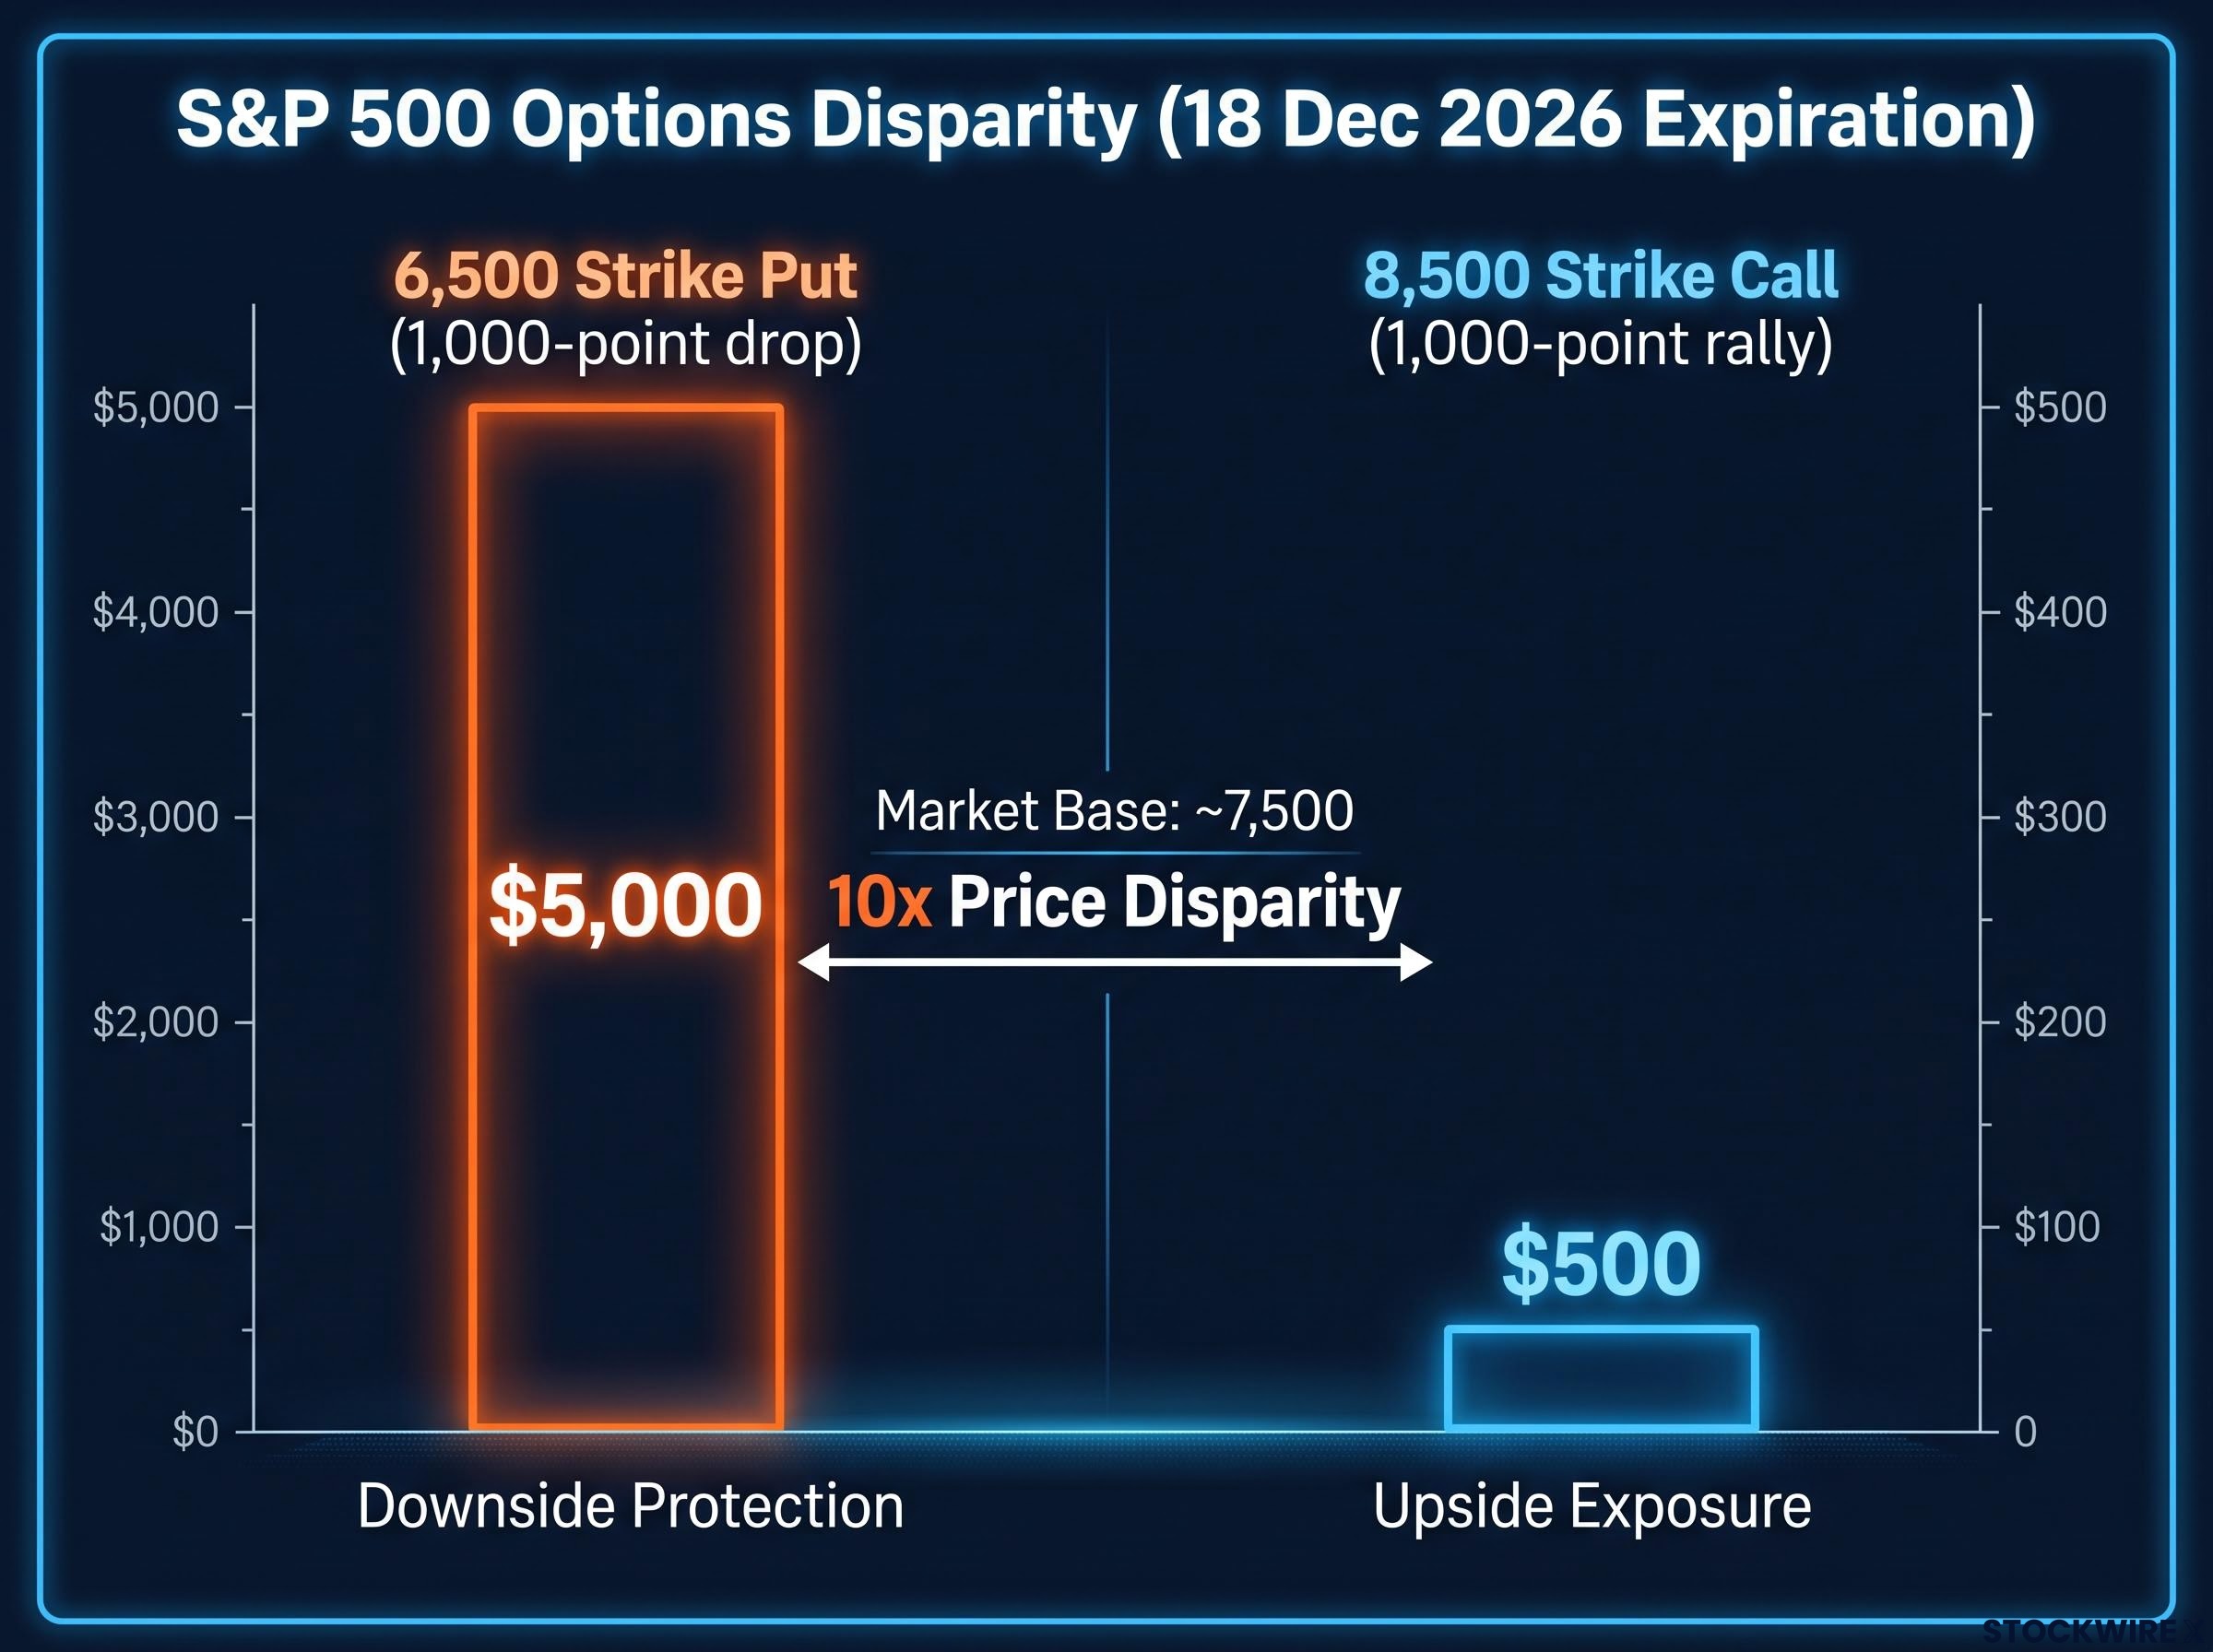
| Distance from current price | Put premium (downside) | Call premium (upside) | Price ratio (put to call) |
|---|---|---|---|
| +/- 500 points | $9,300-$10,000 | ~$4,300 | ~2x |
| +/- 1,000 points | ~$5,000 | ~$500 | ~10x |
The fact that you must pay ten times more for protection against a 1,000-point fall than for exposure to a 1,000-point rally shows you that institutional money sees a hard ceiling on upside. Reinforcing that view, the 8,500 strike call carried just a 3% implied probability of finishing in the money, placing it more than two standard deviations above the current market. The options market is assigning almost no chance to a large rally.
Tracking the macro index
Individual contract prices tell one story, but the CBOE SKEW index rolls that same panic into a single, market-wide number. It measures the cost of far out-of-the-money puts relative to at-the-money options, effectively quantifying how much investors are paying for crash protection.
On 18 September 2026, the index closed at 148.10. Its neutral zone sits between 100 and 120, so a reading approaching 150 is a long way from calm. Related readings during the same period ran from 145.95 to as high as 154.49 on 14 September, and Cboe’s one-month S&P 500 put skew jumped from the 36th to the 73rd percentile of its one-year range in early September.
Cboe’s SKEW Index methodology measures the cost of far out-of-the-money puts relative to at-the-money options, translating a complex volatility surface into a single number that reflects how much investors are collectively paying to hedge against a market crash.
A reading this elevated confirms the fear is widespread rather than isolated to a handful of contracts. When the aggregate index and the individual strikes agree, you are looking at broad institutional demand for downside insurance, not a one-off hedge.
The crude oil upside anomaly
Now flip the script entirely. In equities, the fear is of a collapse. In crude oil, the fear runs the other way, and that inversion is the most telling signal in the market right now.
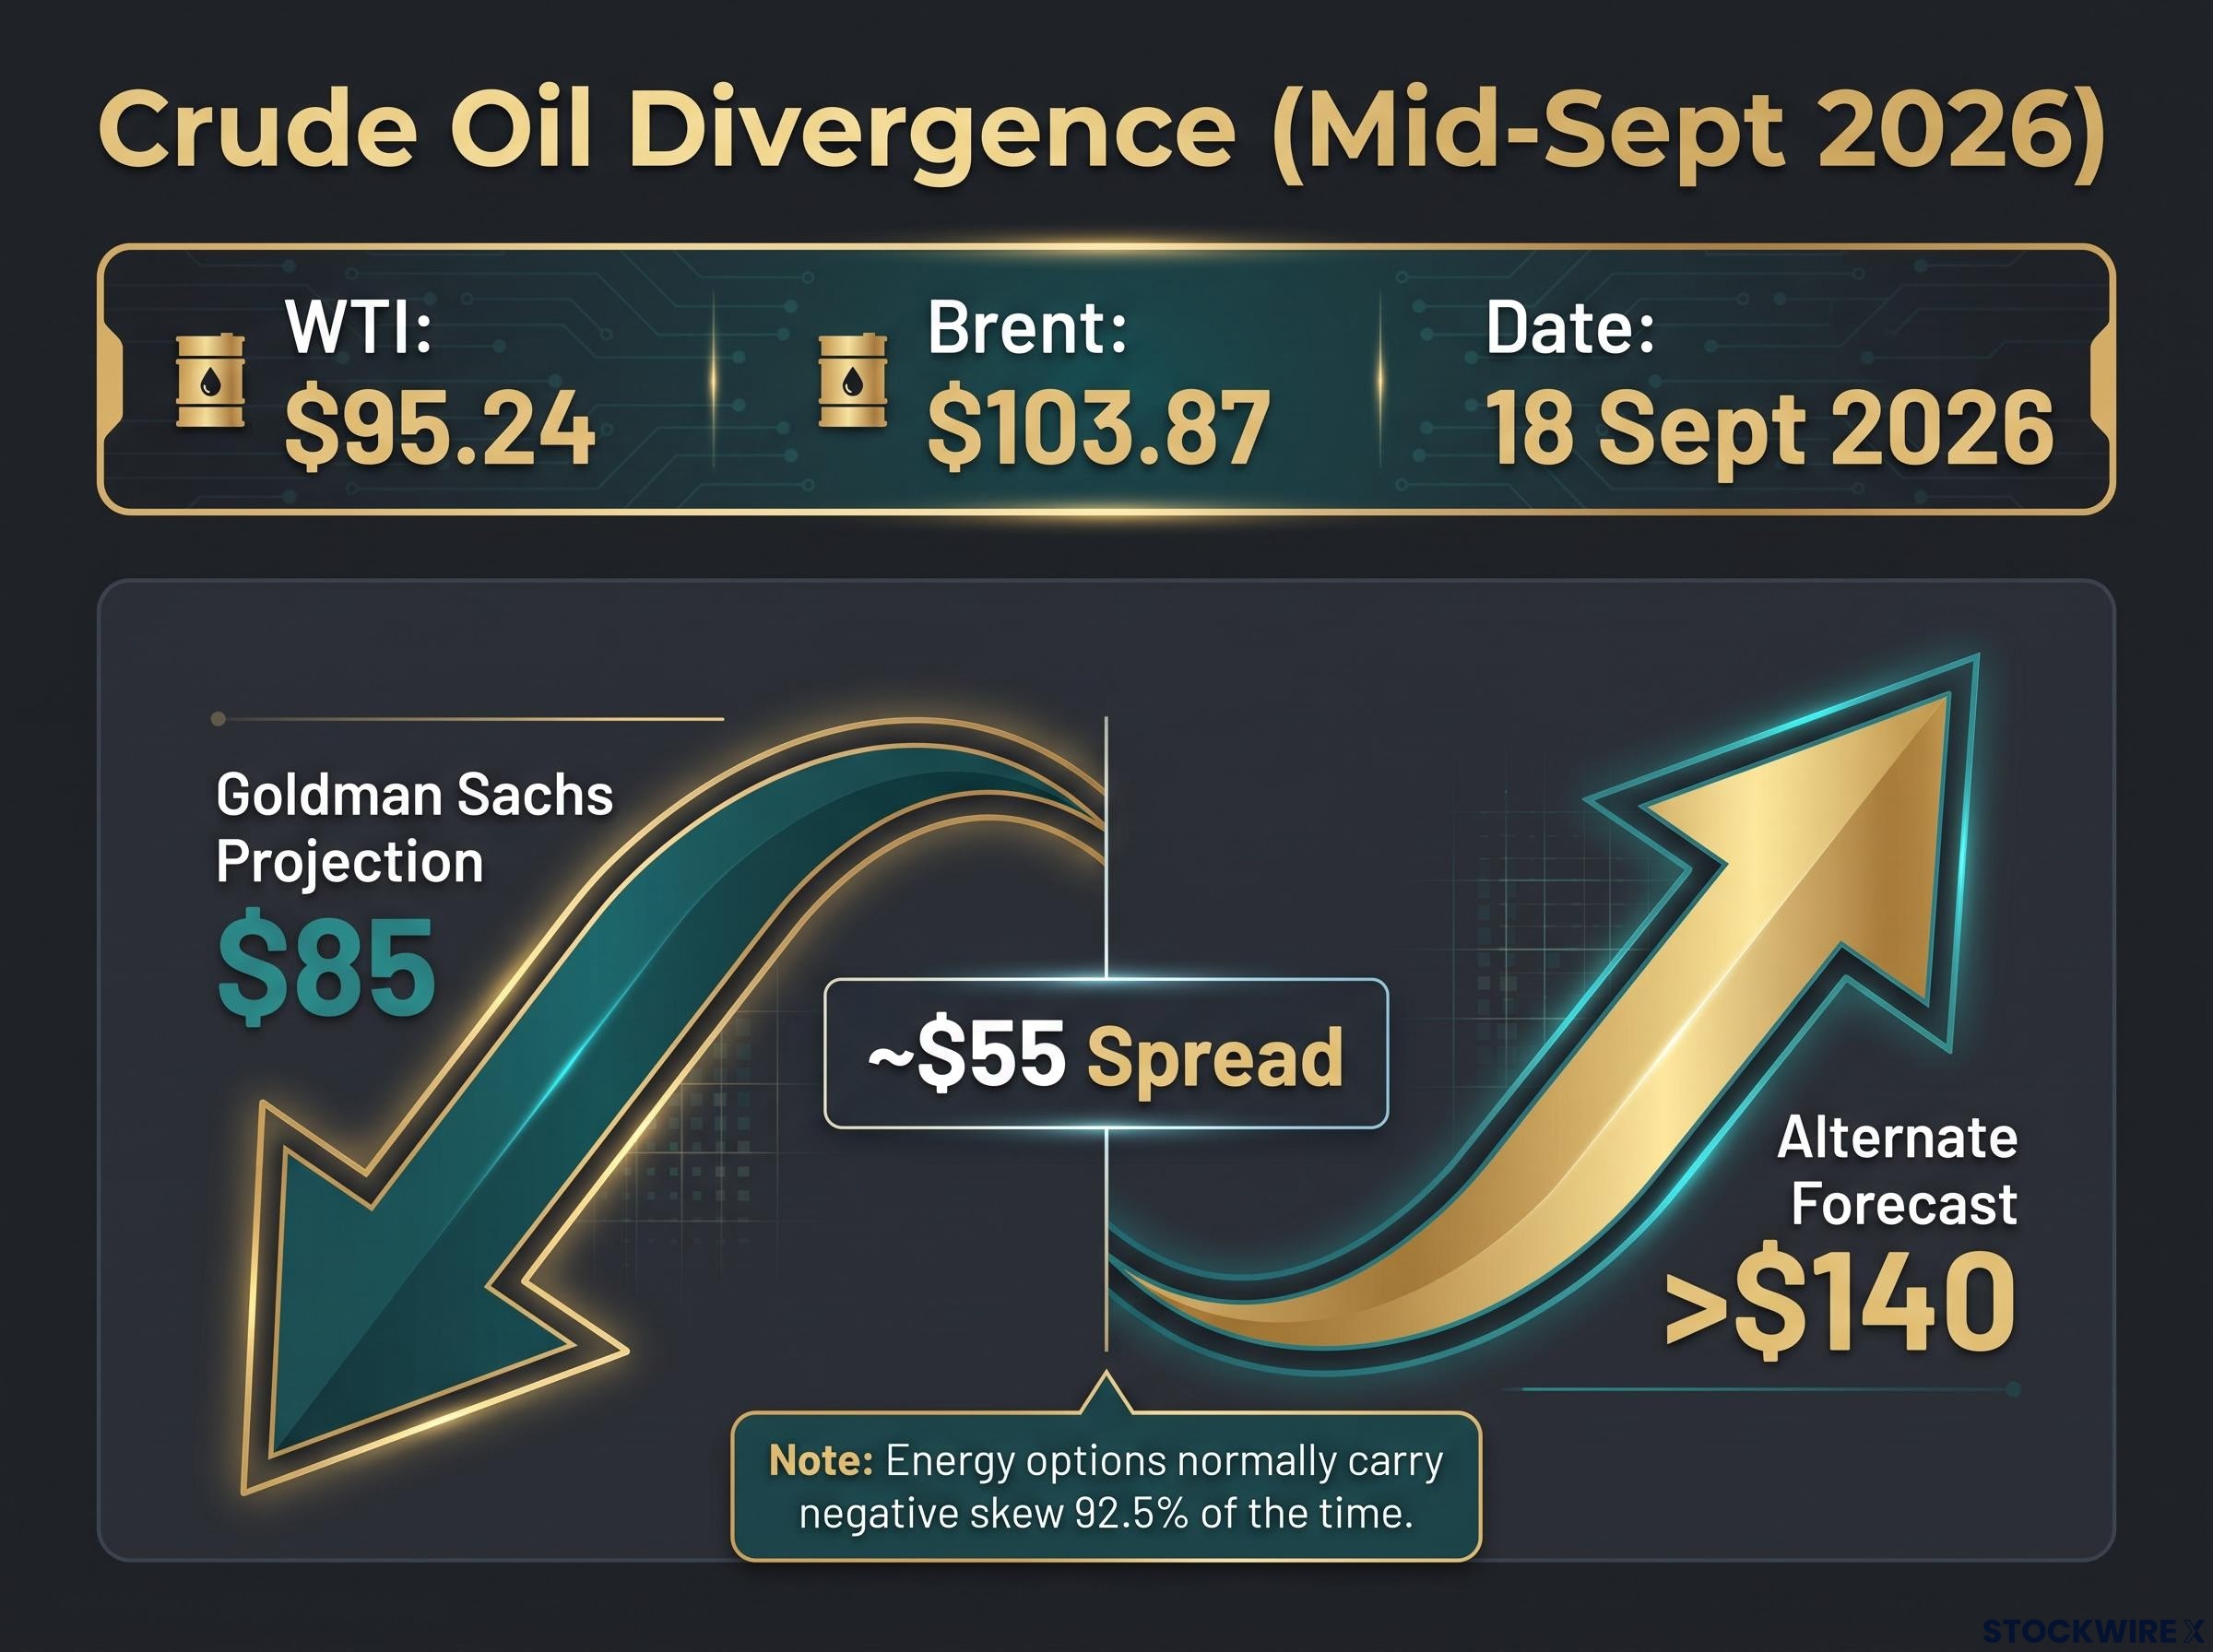
By mid-September 2026, WTI spot prices closed near $95.24 on 18 September, with Brent crude around $103.87. Geopolitical tension in the Middle East, particularly risks around the Strait of Hormuz, has kept prices elevated, and the longer-dated futures curve is pricing sustained higher levels rather than a quick fall back to normal.
What makes this remarkable is the direction of the skew. Crude options are negatively skewed roughly 92.5% of the time, meaning downside protection normally commands the premium, just as it does in equities. Right now, that pattern has inverted.
A rare inversion in energy risk pricing Crude options carry negative skew about 92.5% of the time. Today’s pronounced upside call skew means buyers are paying up for protection against a price spike, not a price collapse.
The buyers are airlines, refiners, and macro funds, all of whom face genuine pain if oil suddenly surges. They are prioritising upside protection against an unbounded supply shock. Options probabilities over a 29-day window estimate roughly a 10% chance of crude falling into the $70s, but assign a higher implied probability to prices spiking toward the $110-$120 range.
The uncertainty premium is expensive because forecasts are all over the map. Goldman Sachs projected Brent falling to $85 per barrel, while another analyst forecast placed it above $140, a spread of roughly $55. When credible analysts disagree that violently, options sellers demand a fat premium to take the other side.
The crude oil price outlook heading into late 2026 is unusually binary: Brent at $109.51 is priced on sustained conflict as the base case rather than a tail risk, meaning a ceasefire headline alone could trigger a reversal with no established technical support beneath the September breakout level.
Because energy shocks flow straight into inflation data, this upside panic in oil tells you why the Federal Reserve was forced to keep policy restrictive despite the equity market pain. The two markets are connected: the same supply fear driving oil calls is helping keep rates high enough to punish stocks.
Navigating false positives and volatility compression
Here is the twist that stops you from acting on all this fear at face value. Extreme protective pricing often marks the moment the worst outcome is already fully priced in, which is exactly when a contrarian bet becomes the smarter play.
Start with the VIX, Wall Street’s headline gauge of expected 30-day volatility. On 18 September 2026 it closed at just 14.81, down from 15.44 the prior day. That is a low-to-mid teens reading, which sits oddly against a SKEW index near 150. Elevated crash-protection demand paired with a calm VIX is itself a warning of a regime in transition.
The low VIX reading alongside extreme skew is not a measurement error; VIX decoupling from individual stock volatility has become a structural feature of 2026 markets, driven by dealer gamma hedging and structured product issuance that mechanically pin the index reading regardless of what is happening beneath it.
The volatility futures curve reinforces that. One reading during a selloff session showed the nearest active contract (V) at 19.05 and the next (X) at 19.39, a spread of just 0.34. A curve that flat is unusual, and a compressing curve typically signals an incoming shift toward either a volatility expansion or a fresh low-volatility calm.
The history here demands caution. When SKEW readings above 145 combine with a low VIX in a so-called “Divergence” regime, the signal fails to predict a drawdown roughly 30% of the time. And extreme put skew has actually behaved as a contrarian bullish signal in a large share of cases.
Three conditions have historically marked that contrarian bullish setup when fear metrics run hot:
- SPX 25-delta skew above roughly 12 volatility points, which has preceded gains about 60% of the time over a 30-day horizon.
- A SKEW index above 145 paired with an unusually calm VIX, signalling hedging demand has outrun realised volatility.
- A flattening or compressed volatility futures curve, indicating the market is bracing rather than already falling.
When you see everyone rushing to buy the same expensive insurance at once, recognise that the panic is already in the price. That crowding often makes the contrarian bullish trade the mathematically smarter bet, not the reckless one. This is the difference between following the herd and exploiting its overreaction.
None of this makes extreme skew a green light to go long. It makes it a reason to slow down before making panic-driven portfolio decisions.
Aligning your portfolio with current market probabilities
The market is telling two stories at once, and holding both is the key to reading late 2026. Equities are braced for a fall while crude oil is braced for a spike, and both fears trace back to the same restrictive Fed policy that lifted rates to 3.75%-4.00% and pushed the 10-year yield toward 5%.
That clash argues for defensive agility rather than aggressive directional bets. Downside protection on stocks is expensive, upside protection on oil is expensive, and both are pricing in a lot of anxiety that may already be spent.
Watch two things from here: the shape of the VIX curve and the tone of Federal Reserve rhetoric. A steepening volatility curve or a softening in the Fed’s language would signal the probabilities are shifting, and the extreme skew you see today would start to unwind.
The same framework applies at the individual stock level: options chain sentiment signals such as put-to-call premium ratios, expected-move brackets, and far-out-of-the-money crowding give you the same informational read on a single ticker that the S&P 500 skew surface provides at the index level.
This article is for informational purposes only and should not be considered financial advice. Investors should conduct their own research and consult with financial professionals before making investment decisions.
Past performance does not guarantee future results, and these observations are probabilistic rather than predictive. The value of options skew is not in telling you what will happen, but in showing you where the crowd has placed its bets, so you can decide whether to join it or fade it.