
Most traders can point to a resistance level on a chart. Far fewer know how to turn one into a precise short-entry trigger, or how the same level can support two entirely different trades depending on the timeframe you choose to hold it.
Short-side technical setups at resistance sit in one of the more disciplined corners of active trading. The method does not lean on a bearish macro view or fundamental analysis. It reads price behaviour at identifiable supply zones, then applies a clear framework for deciding when to take a quick 1% day-trade scalp and when to build a multi-leg swing position aiming for 10% to 20% or more.
Here is the complete working framework. You will learn how to read a resistance zone for a short-side entry, how to size and structure the position differently depending on whether you hold overnight, and where the whole approach breaks down. That last part matters more than the entries themselves.
Why resistance levels are the starting point for short-side entries
A resistance level is a price zone where a stock has repeatedly stalled or reversed. That much most traders already know. What is less obvious is why it behaves that way, and the answer is what makes it useful for shorting.
Why resistance creates supply
Resistance forms because of what happened the last time price arrived there. Some traders sold and locked in gains. Others bought near the top, watched price fall, and are now waiting to break even so they can exit.
When price climbs back to that zone, both groups become sellers. The profit-takers sell again, and the trapped buyers sell to escape at cost. That combined selling pressure is the supply that caps the move, and it is why a resistance zone is really a supply zone in disguise.
The zone gains statistical weight the more times price has touched it. As a general principle, three or more prior touches at a level make it more reliable as an entry reference than a single rejection ever could.
How practitioners confirm rejection before entering
Skilled traders do not short blindly the moment price tags resistance. They wait for the level to prove itself by rejecting price, because an unconfirmed level is just a line on a chart until sellers actually show up.
The confirmation signals to watch for include:
- Shooting star candles, where price pushes into resistance then closes far below the high, showing sellers took control
- Bearish engulfing patterns, where a down candle fully covers the prior up candle
- A failed breakout, where price briefly pierces resistance then snaps back below it, trapping the breakout buyers
- An overbought RSI reading, signalling the move up may be stretched
- A bearish MACD cross, where momentum turns down
When several of these line up at the same level, the setup carries more weight. This alignment is called confluence, and it is what separates a high-quality entry from a hopeful one.
Bearish chart patterns at resistance carry a baseline median win rate of just 52.8% across a large sample of trades, but strict volume and trend filtering pushes completion rates to 83%, which means the confirmation criteria covered above are not procedural caution but the actual source of statistical edge.
Waiting for confirmation lowers your theoretical win rate, because you skip trades that would have worked without it. It sharpens the quality of the entries you do take, which matters far more over time.
The distinction between a resistance level and a confirmed resistance rejection is the difference between a disciplined entry and a blind guess. Skip the confirmation step and you are structurally exposed to breakout risk at the worst possible moment, right when price is about to run against you.
Your stop belongs just above the resistance zone, with a small buffer to absorb intraday noise. That buffer keeps you from being whipsawed out by a wick while still defining your upside risk tightly, which is the whole point of using resistance as your reference.
When big ASX news breaks, our subscribers know first
Day trades versus swing trades at resistance: the target sizing split
The same resistance zone can anchor two completely different trades. What determines which one you take is not the stock. It is whether you are willing to hold overnight.
A day trader closes every position before the market shuts to avoid gap risk, the danger that a stock opens the next morning at a very different price than where it closed. The reward for that safety is a smaller target. A swing trader accepts overnight and multi-day exposure precisely to earn a larger move.
Consider SanDisk as the day-trade case. The stock had rallied roughly 8% in a single session, sat about 74% above its recent lows, and traded around 26% below its all-time high. Because it was climbing back toward those highs rather than breaking down, it was ruled out as a swing short. The plan was to short into resistance near $17.64, then $18.27 to $18.28, then $19.15, taking roughly a 1% profit and exiting the same day.
Now consider Micron Technology as the swing case. The stock had rebounded about 15% into technical resistance after a prior surge of roughly 300%. The setup called for a first entry near $102.70 and a secondary add near $104.20, with a target of around 11% downside back to a prior gap zone. Those two entry levels sat roughly 10.5% to 11% apart.
| Factor | Day trade | Swing trade |
|---|---|---|
| Timeframe | Closed same session | Days to weeks |
| Profit target | Approx 0.5-2% of price | 10-20%, occasionally 20-30% |
| Overnight exposure | None; avoids gap risk | Absorbs overnight and multi-day gaps |
| Entry trigger | Rejection at resistance | Rejection, often two-tiered |
| Case study | SanDisk | Micron |
Across practitioner literature, day-trade targets cluster around 0.5% to 2% of price. Swing targets stretch to 10% to 20%, sometimes 20% to 30%. Many traders anchor these to volatility instead of fixed percentages, using Average True Range (ATR), a measure of how much a stock typically moves in a period.
The ATR target framework A minimum target sits at 1x ATR, a standard target at 2x ATR, and an extended target at 3x ATR. Underneath all of them runs a reward-to-risk floor of at least 2:1, meaning your target should be at least twice the distance of your stop.
Here is why the distinction matters to you. Traders who never make it explicit tend to size day trades too large, treating a scalp like a swing, or bail out of swings too early, treating a multi-week move like a scalp. Deciding the timeframe first prevents that category error, because everything downstream, target and structure alike, follows from it.
Building the position in two tiers: the mechanics and the risk
The two-tiered entry is appealing for a simple reason. By adding a second leg at a higher resistance level, you lower your average entry cost and build the position more precisely than a single all-at-once entry allows. Inside that same feature sits a structural danger, which is why the tactic demands conservative sizing.
How the two-tiered mechanic works
The Micron setup shows the mechanic cleanly. The first entry goes in near $102.70. The second add goes in near $104.20, a key prior pivot high, sitting roughly 10.5% above the first. Above both sits a gap-fill resistance near $111.50, which serves as the upper risk reference.
The Micron setup referenced a gap-fill zone near $111.50 as the upper risk boundary, a reference that makes more sense once you understand gap-filling analysis: price voids created by runaway moves fill at rates as high as 70-80% under the right market conditions, giving traders a probabilistic anchor for both target-setting and stop placement.
The sequence looks like this:
- Identify the first resistance level and confirm rejection before entering
- Size the first leg so it risks no more than 1% to 2% of your account equity
- Set a price alert at the secondary resistance level
- Size the second leg so the combined position still stays within that same 1% to 2% risk envelope
- Place your stop above the secondary level, using the gap-fill zone as the wider risk boundary
Adding at a higher level tightens your average cost. It also increases your total exposure at precisely the point where a breakout would inflict the most damage, because you are now larger the closer price gets to escaping your resistance ceiling.
Why sizing each leg conservatively is non-negotiable
Work through the arithmetic and the danger becomes obvious. If you size each leg as though it were a standalone trade risking 1% to 2% of equity, the combined position risks 2% to 4% at maximum. That already sits at the upper boundary of what most practitioners tolerate on a single idea.
The standard sizing rule is to risk 1% to 2% of account equity per trade, with some traders extending to 2% to 3% for higher-conviction setups. In a two-tiered structure, that envelope has to cover both legs together, not each one separately.
Fast markets make this worse. Analyst Pratyush Raman has noted that two-tiered entries present severe execution risk in fast markets, particularly near critical resistance in high-short-interest names, where the gap between your theoretical stop and your actual fill can widen sharply.
There is a financing reality behind all of this too. Under Federal Reserve Regulation T, short sales require initial margin of 150% of market value, and FINRA Rule 4210 mandates maintenance margin of generally 30% of market value for stocks priced at $5.00 or above.
A two-tiered entry that is not sized conservatively on each leg does not reduce your risk. It concentrates that risk at the exact level where a squeeze or breakout would be most violent. That makes the sizing decision, not the entry level, the single most important variable in the entire tactic.
Where the framework breaks down: squeeze risk, trend context, and the asymmetry problem
Everything above assumes the setup works as intended. It is worth being honest about what happens when it does not, because the failure mode here is not simply a losing trade. It is a structurally violent one.
The squeeze mechanism
Short selling carries a problem that long trades do not. When you buy a stock, the most you can lose is what you put in. When you short, your loss is theoretically unlimited, because a stock can keep rising without ceiling while your position keeps bleeding.
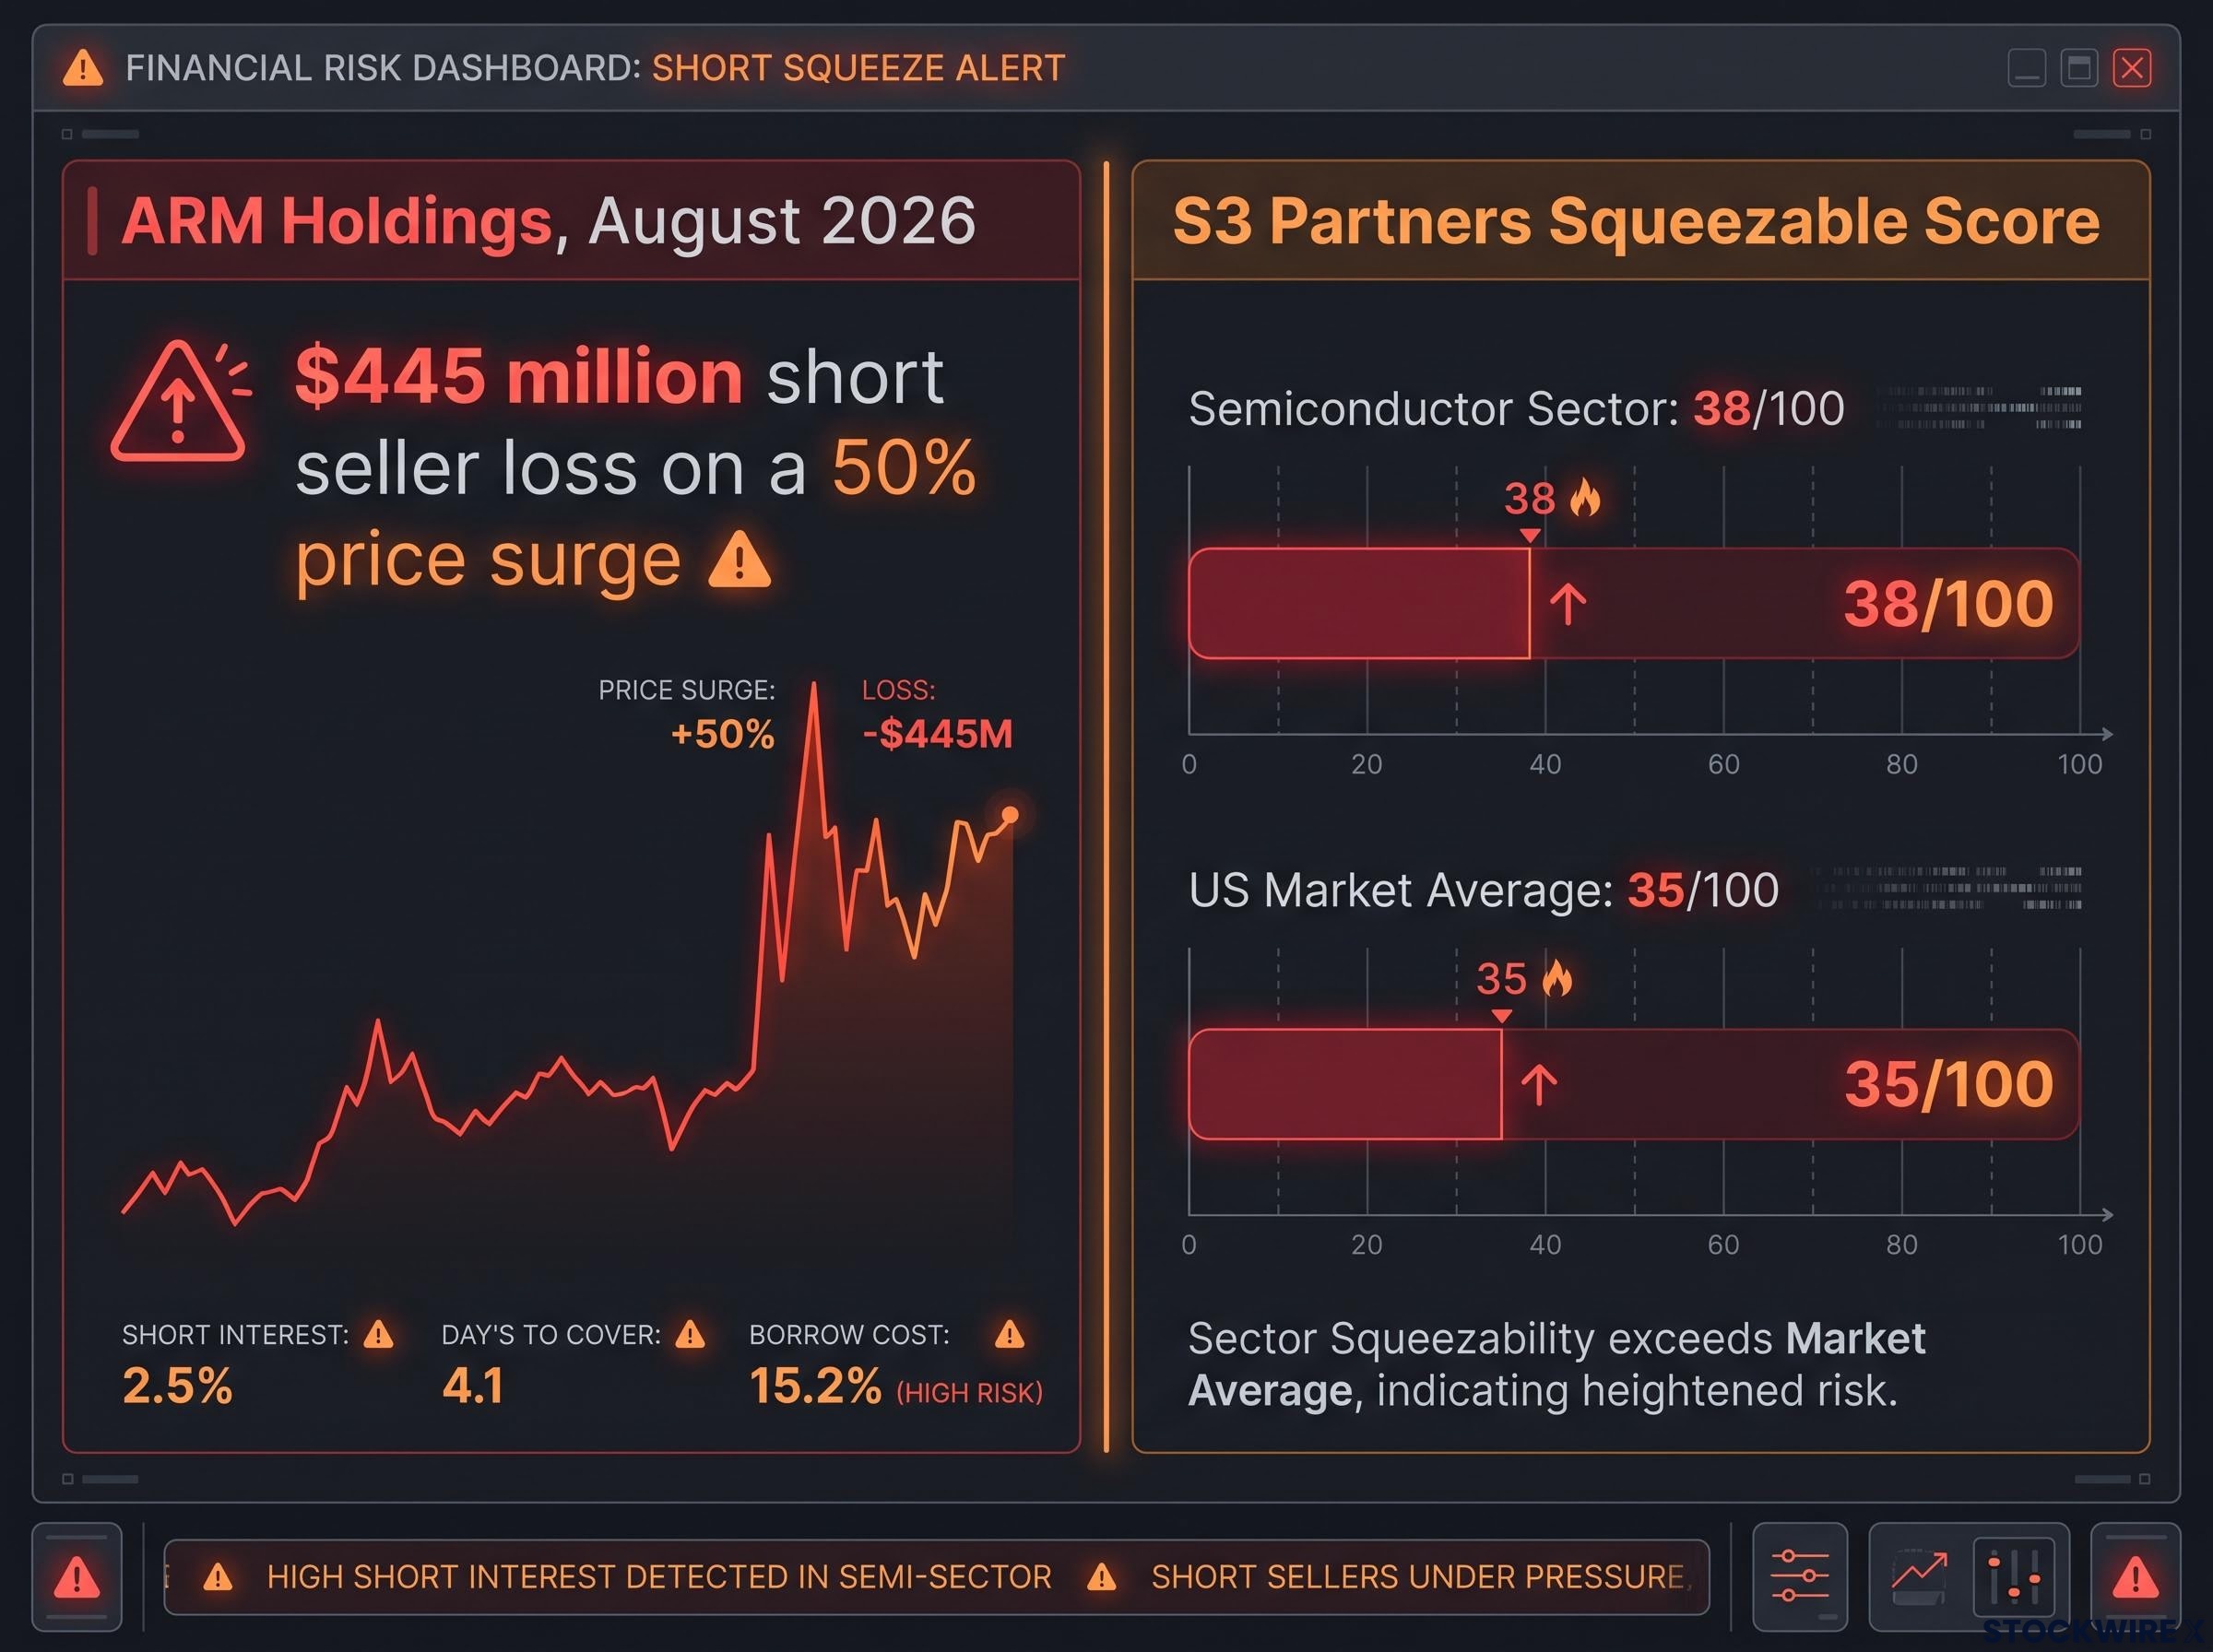
A short squeeze is where that asymmetry turns catastrophic. In August 2026, short sellers in ARM Holdings learned this in a single session.
Short squeeze mechanics follow a self-reinforcing logic that differs fundamentally from ordinary sell-offs: forced covering by margined short sellers drives price higher, which triggers further margin calls, which forces more covering, with market maker gamma hedging sometimes layering a second wave of buying on top of the first.
ARM Holdings, August 2026 Short sellers lost approximately $445 million on a sudden 50% price surge, a concrete illustration of how a resistance level that looked reliable can dissolve within hours in the semiconductor space.
Squeeze moves can produce 50% to 200% upside in a matter of hours, with widened bid-ask spreads and unpredictable fills compounding the damage. The semiconductor sector is structurally exposed here. S3 Partners data put the sector’s squeezable score at 38 out of 100, slightly above the US market average of 35 out of 100.
Micron itself showed how crowded positioning builds and unwinds. Short interest peaked at roughly 41.59 million shares, or 3.70% of float, in mid-June 2026, before easing to about 29.71 million shares, or 2.64% of float, by 31 August 2026, with a short-interest ratio near 1.2 days to cover.
When trend context disqualifies the setup entirely
The conditions that raise breakdown probability are worth memorising:
- A strong prevailing uptrend
- High existing short interest
- An upcoming catalyst such as earnings or a product announcement
- A wide bid-ask spread
- A thinly traded float
The uptrend is the one traders most often ignore. Shorting into resistance during a powerful uptrend is widely regarded as high-risk and low-probability, because the buying pressure that built the trend is still active. That same resistance that holds cleanly in a ranging or falling stock will frequently fail in a stock making higher highs, producing the gap-ups and breakouts that trap short sellers at the very levels they used as triggers.
This is exactly why SanDisk was ruled out as a swing short. Its proximity to all-time highs told the original analysis that the trend context was wrong for holding a short overnight, regardless of how clean the intraday resistance looked.
A resistance level does not neutralise the asymmetry of short selling. It only defines where you choose to take that asymmetry on. Understanding that distinction is what separates disciplined short-side traders from those who mistake a clean chart for a low-risk trade.
Applying the framework: a decision sequence for short-side setups at resistance
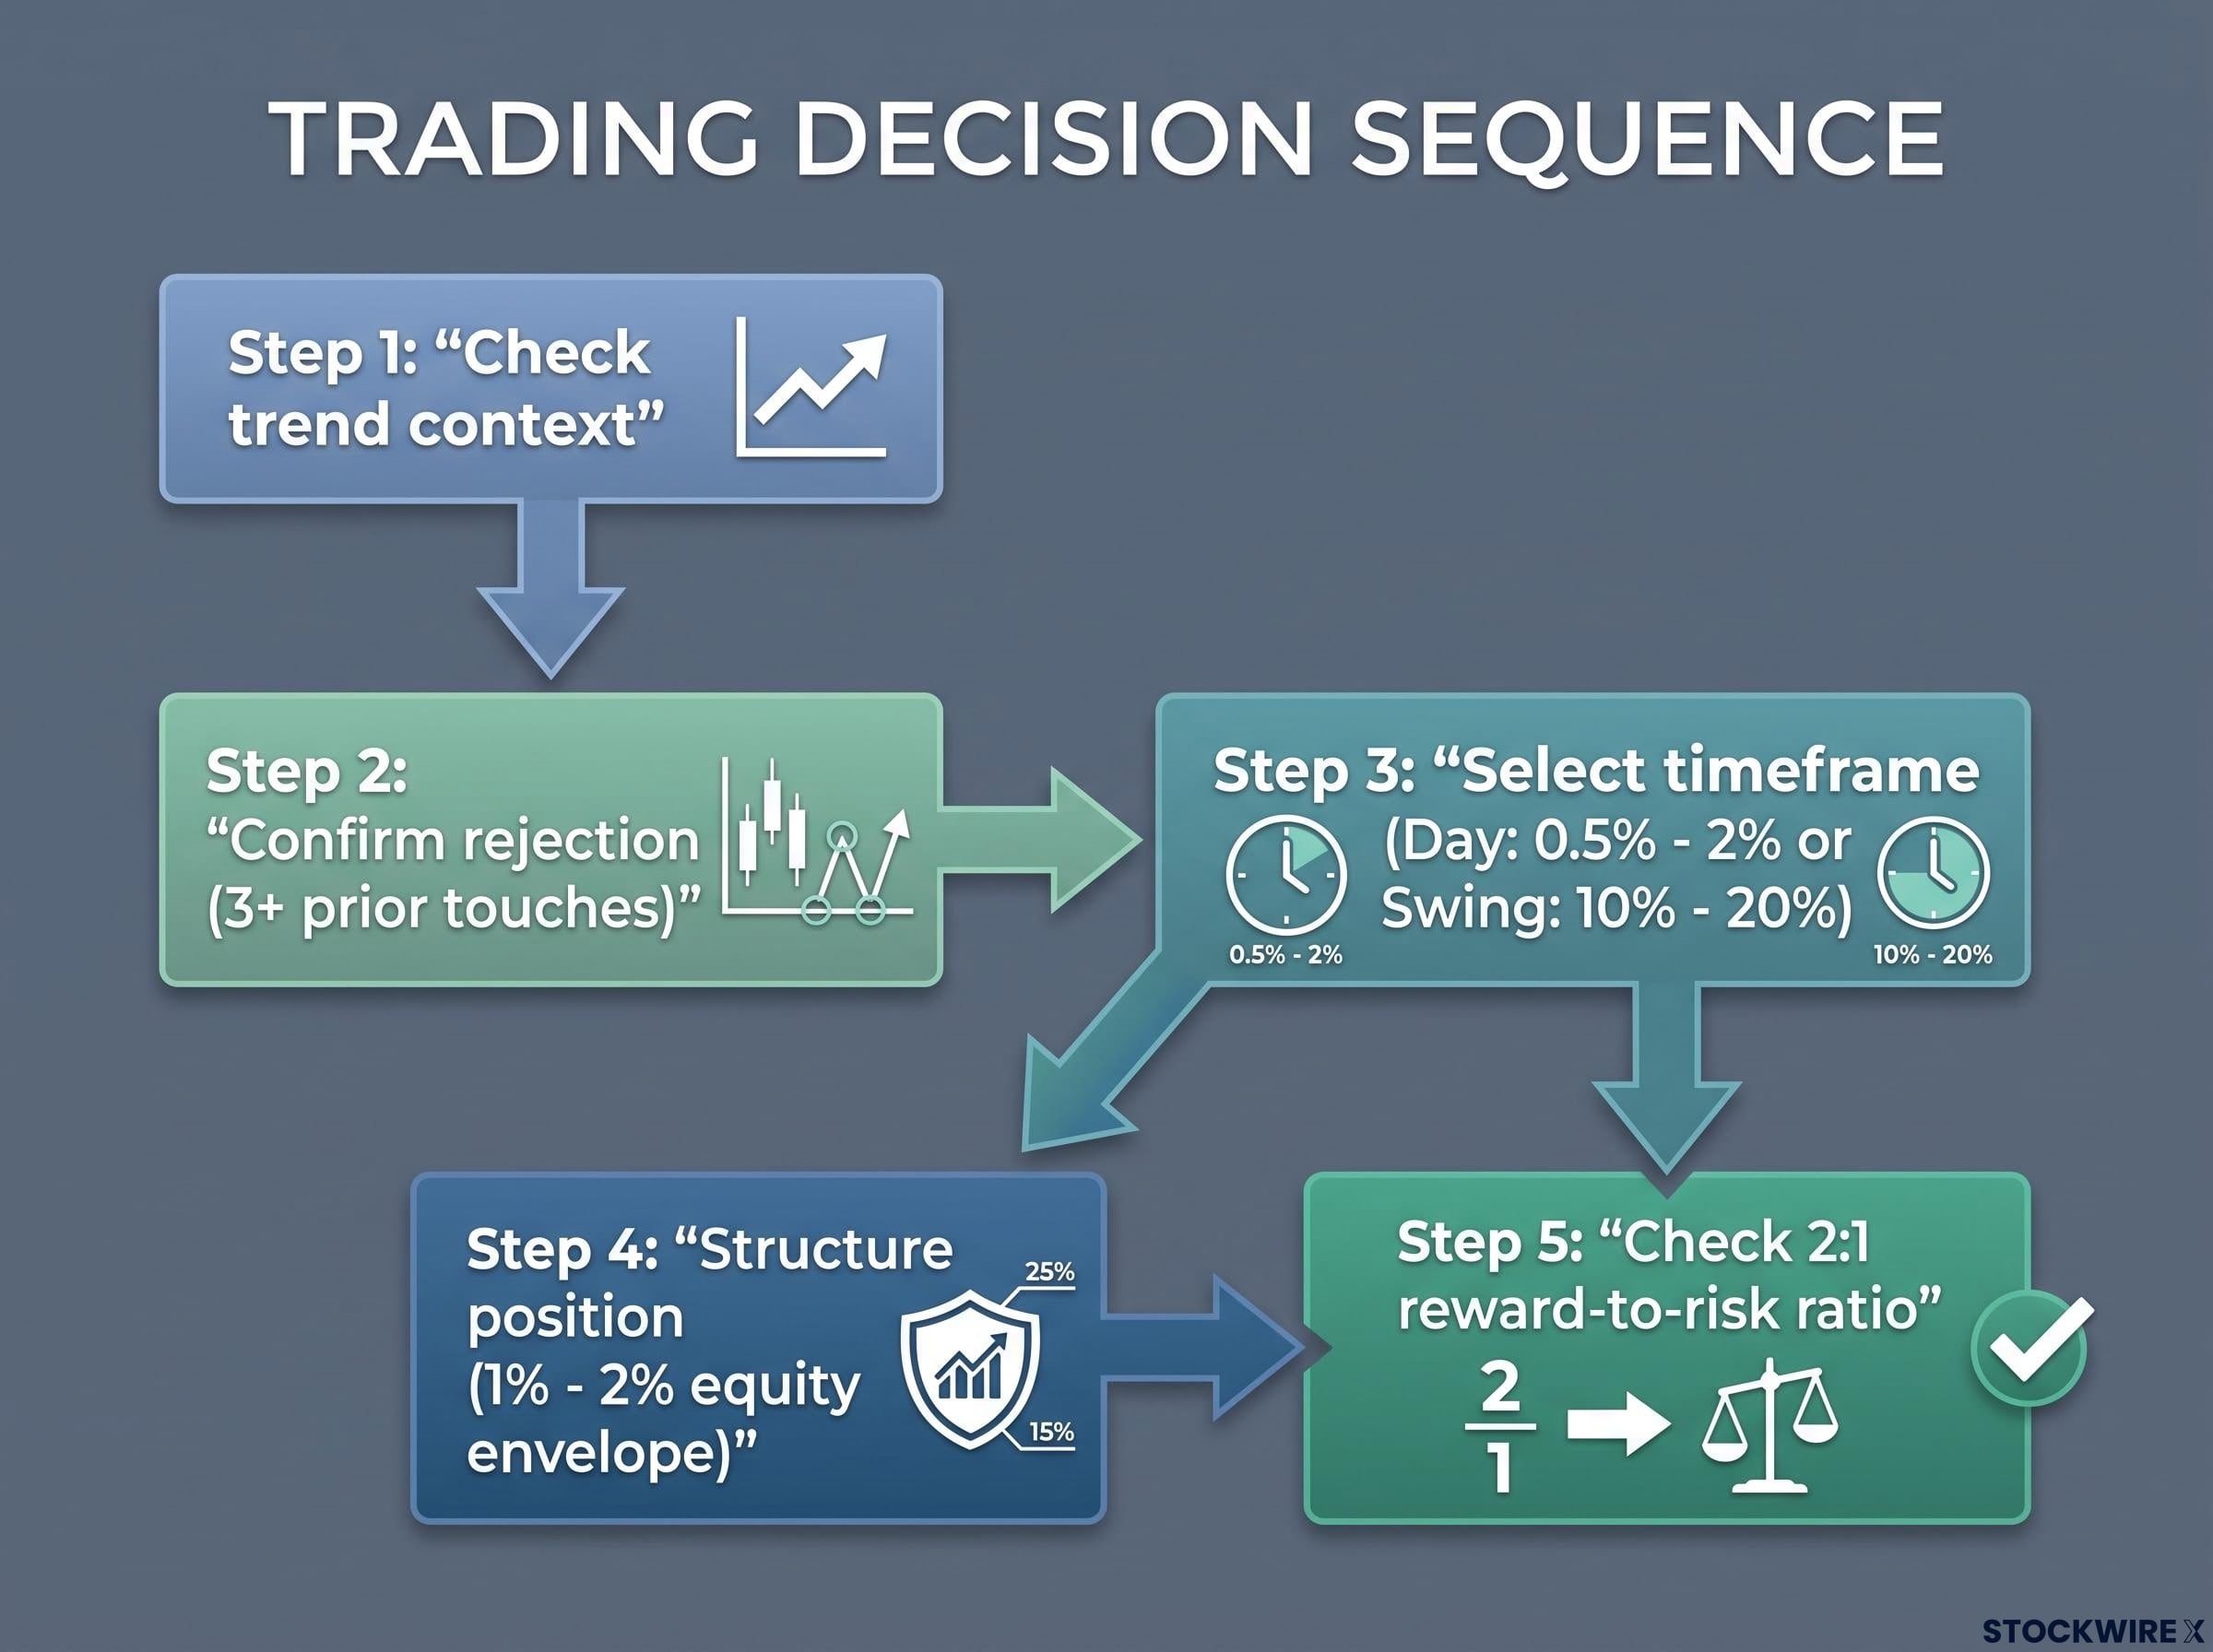
Pull all of it together and you get a sequence you can run before every setup. Treat each step as a gate that can disqualify the trade, not a box to tick on your way to an entry you have already decided to take.
- Check the trend context first. If the stock is in a strong uptrend near its highs, a swing short is disqualified before you even look at levels.
- Identify resistance and confirm rejection. Look for three or more prior touches and wait for a shooting star, bearish engulfing candle, or failed breakout.
- Select the timeframe. Decide whether you will hold overnight. That choice sets your target, day-trade at roughly 0.5% to 2% of price, or swing at 10% to 20%.
- Structure and size the position. For a two-tiered entry, size both legs so the combined risk stays inside your 1% to 2% equity envelope.
- Set target and stop, then apply the final filter. If the distance to target divided by the distance to stop does not clear 2:1, pass on the trade regardless of how clean the chart looks.
| Name | Setup type | Key resistance | Profit target | Disqualifying factor |
|---|---|---|---|---|
| SanDisk | Day trade only | $17.64, $18.27-$18.28, $19.15 | Approx 1% | Too close to all-time highs for a swing short |
| Micron | Swing trade | $102.70, add at $104.20 | Approx 11% | None; qualified as a swing candidate |
The sequence only protects you if each gate is a genuine disqualification point. The willingness to pass on a setup that fails one step is what separates a systematic method from discretionary guesswork.
This article is for informational purposes only and should not be considered financial advice. Investors should conduct their own research and consult with financial professionals before making investment decisions. Past performance does not guarantee future results, and trading short positions carries the risk of unlimited loss.
Trading resistance on the short side with discipline, not conviction
The value of this framework is not in predicting where a stock will go. It is a discipline of filters and limits, and its edge comes from what it rules out rather than what it confirms.
The day and swing distinction is the structural backbone. Choosing the right timeframe before you identify a single entry level is what makes your profit target and position structure coherent rather than arbitrary.
From here, the work is yours. The method only produces results when you run the decision sequence consistently, including on the setups it rejects at an early gate. The traders who apply it most effectively are the ones with the patience to pass on marginal setups and wait for the ones that clear every gate.
For readers who want to extend the framework beyond resistance-level setups, our dedicated guide to short-side entry signals covers gap-and-go continuation shorts, fade-the-gap entries, and relative weakness setups in detail, including the stop mechanics that practitioners use to manage each type dynamically.