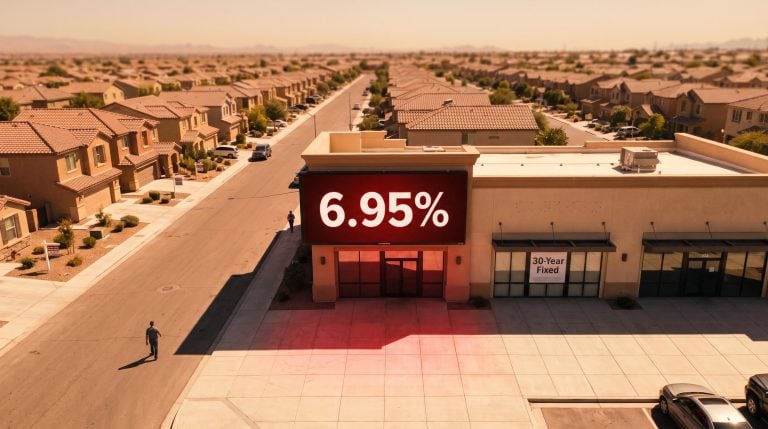
Something unusual is happening across the world’s biggest debt markets right now. In the United States, Germany, Japan, and the United Kingdom, government bond yields are all sitting at their highest levels in a generation or more, and they got there at roughly the same time.
Look at it from a distance and it stops resembling four separate central banks making four separate decisions. It starts to look like one thing: a synchronised repricing of what it costs to borrow money anywhere on the planet.
This is not the usual story of markets bracing for more rate hikes. Yields are high because the compensation investors demand simply to hold long-term debt, a figure called the term premium, has itself moved sharply upward. That distinction changes everything about how long elevated borrowing costs stick around, and which assets take the most damage.
Here is what the shift means in practice: for equity valuations, for how you position a portfolio, and for the run of economic data landing in the final days of September 2026 that could confirm or crack the whole thesis. This piece explains the mechanism, not just the numbers.
Why bond yields are rising everywhere at once
Start with what the data actually shows. Four of the most important sovereign bond markets have moved to multi-decade highs, and they did it together.
| Country | 10-year yield (mid-Sept 2026, approx.) | Historical context |
|---|---|---|
| United States | ~5.00% | Approaching the 5% threshold |
| United Kingdom | ~5.25-5.30% | Post-2008 peak |
| Germany | ~3.51-3.57% | Highest since 2009 |
| Japan | ~3.00% | 30-year high; BoJ rate at 31-year high |
Note: figures marked approximate are drawn from mid-September 2026 market data reports and remain unverified; sources differ slightly on the German and Japanese levels.
Four countries. Four different central banks. One direction. When markets move this closely in step, it usually points to a shared force underneath, not a coincidence of local decisions.
The synchronised nature of the move becomes clearer once you understand the bond yield mechanics that connect central bank policy, inflation expectations, and secondary market pricing into a single number that resets constantly.
What the term premium is and why it changed
The term premium is the extra return investors require for committing their money to a long-dated bond rather than rolling shorter positions and staying nimble. It is compensation for locking in duration and accepting the risk that inflation, or anything else, surprises them over ten years.
For more than a decade after the global financial crisis, that premium was unusually low, and at times negative. Quantitative easing (central banks buying bonds to hold rates down), subdued inflation, and heavy global demand for safe assets all conspired to keep the cost of lending long artificially cheap. Governments and companies borrowed at a discount because of it.
Those conditions have faded. Central banks are no longer suppressing yields at the same scale, inflation has proven stickier, and something new has arrived: supply.
Governments running large fiscal deficits must issue enormous volumes of debt, and that debt has to find buyers. When supply climbs and traditional buyers step back, prices fall and yields rise. That is bond market arithmetic, and it is pushing the term premium higher.
The scale of the shift is striking. On the U.S. 10-year Treasury, the term premium has reportedly swung from around negative 1.5% after the crisis to roughly positive 0.85% today (unverified). Analysts note that inflation expectations account for only about a quarter of the total yield increase (unverified). The rest is this structural repricing of duration.
Here is what that tells you. Elevated yields are not simply parked, waiting for a rate cut to send them back down. The underlying cost of lending long has changed, and that change can outlast any single central bank decision. Even if the Federal Reserve, the European Central Bank (ECB), or the Bank of Japan (BoJ) stop raising policy rates, long yields can stay high on their own.
When big ASX news breaks, our subscribers know first
How bond yields connect to everything else in a portfolio
You probably know the first-order rule already: when yields rise, bond prices fall. If you hold long-dated bonds, that hurts. Simple enough.
The less obvious part is how far that yield move reaches into the rest of your holdings, including the ones that have nothing to do with bonds.
The chain runs through the discount rate. When you value a company, you are estimating what its future earnings are worth in today’s money, and you shrink those future earnings using the risk-free rate as your yardstick. When that rate rises, distant earnings shrink faster in present-value terms. That mechanically compresses the price-to-earnings multiple investors will pay, and it bites hardest on growth companies whose profits sit mostly in the far future.
The discount-rate channel operates mechanically regardless of whether earnings are growing: the IMF estimated that a 100 basis point increase in global long-term real rates lowers the equilibrium price-to-earnings ratio of advanced-economy indices by 10-15%, holding earnings constant.
There are three transmission channels worth holding in your head:
- Discount rate compression: higher risk-free rates lower the present value of future earnings, squeezing equity valuations, especially for growth stocks.
- The competing asset hurdle: at roughly 5% on a U.S. Treasury, you can earn a meaningful, government-backed real return, so equities must clear a higher bar to justify their added risk.
- Refinancing pressure: companies and governments that borrowed cheaply must roll that debt at today’s yields, compressing corporate margins and straining public budgets over time.
Why should this persist rather than fade? The Fed’s own projections put 2026 PCE inflation at 3.7% and core PCE at 3.4%, both comfortably above the 2% target. As long as inflation runs hot, the case for a swift return to low rates weakens.
The theory becomes concrete when you look at where the money is actually going. In the week to 16 September 2026, investors pulled about $23 billion from global equity funds, reported as the largest such outflow over a nine-month stretch (unverified).
$23 billion exited global equity funds in a single week to 16 September 2026, the clearest single piece of evidence that institutional money has started acting on the repricing, not just talking about it.
The breakdown shows $31.44 billion in U.S. equity net outflows and $295 million from European funds, partly offset by $6.26 billion flowing into Asian equities (all unverified). The week before, ending 2 September 2026, saw $7.76 billion move into U.S. high-grade bond funds and $22.89 billion into money market funds (unverified).
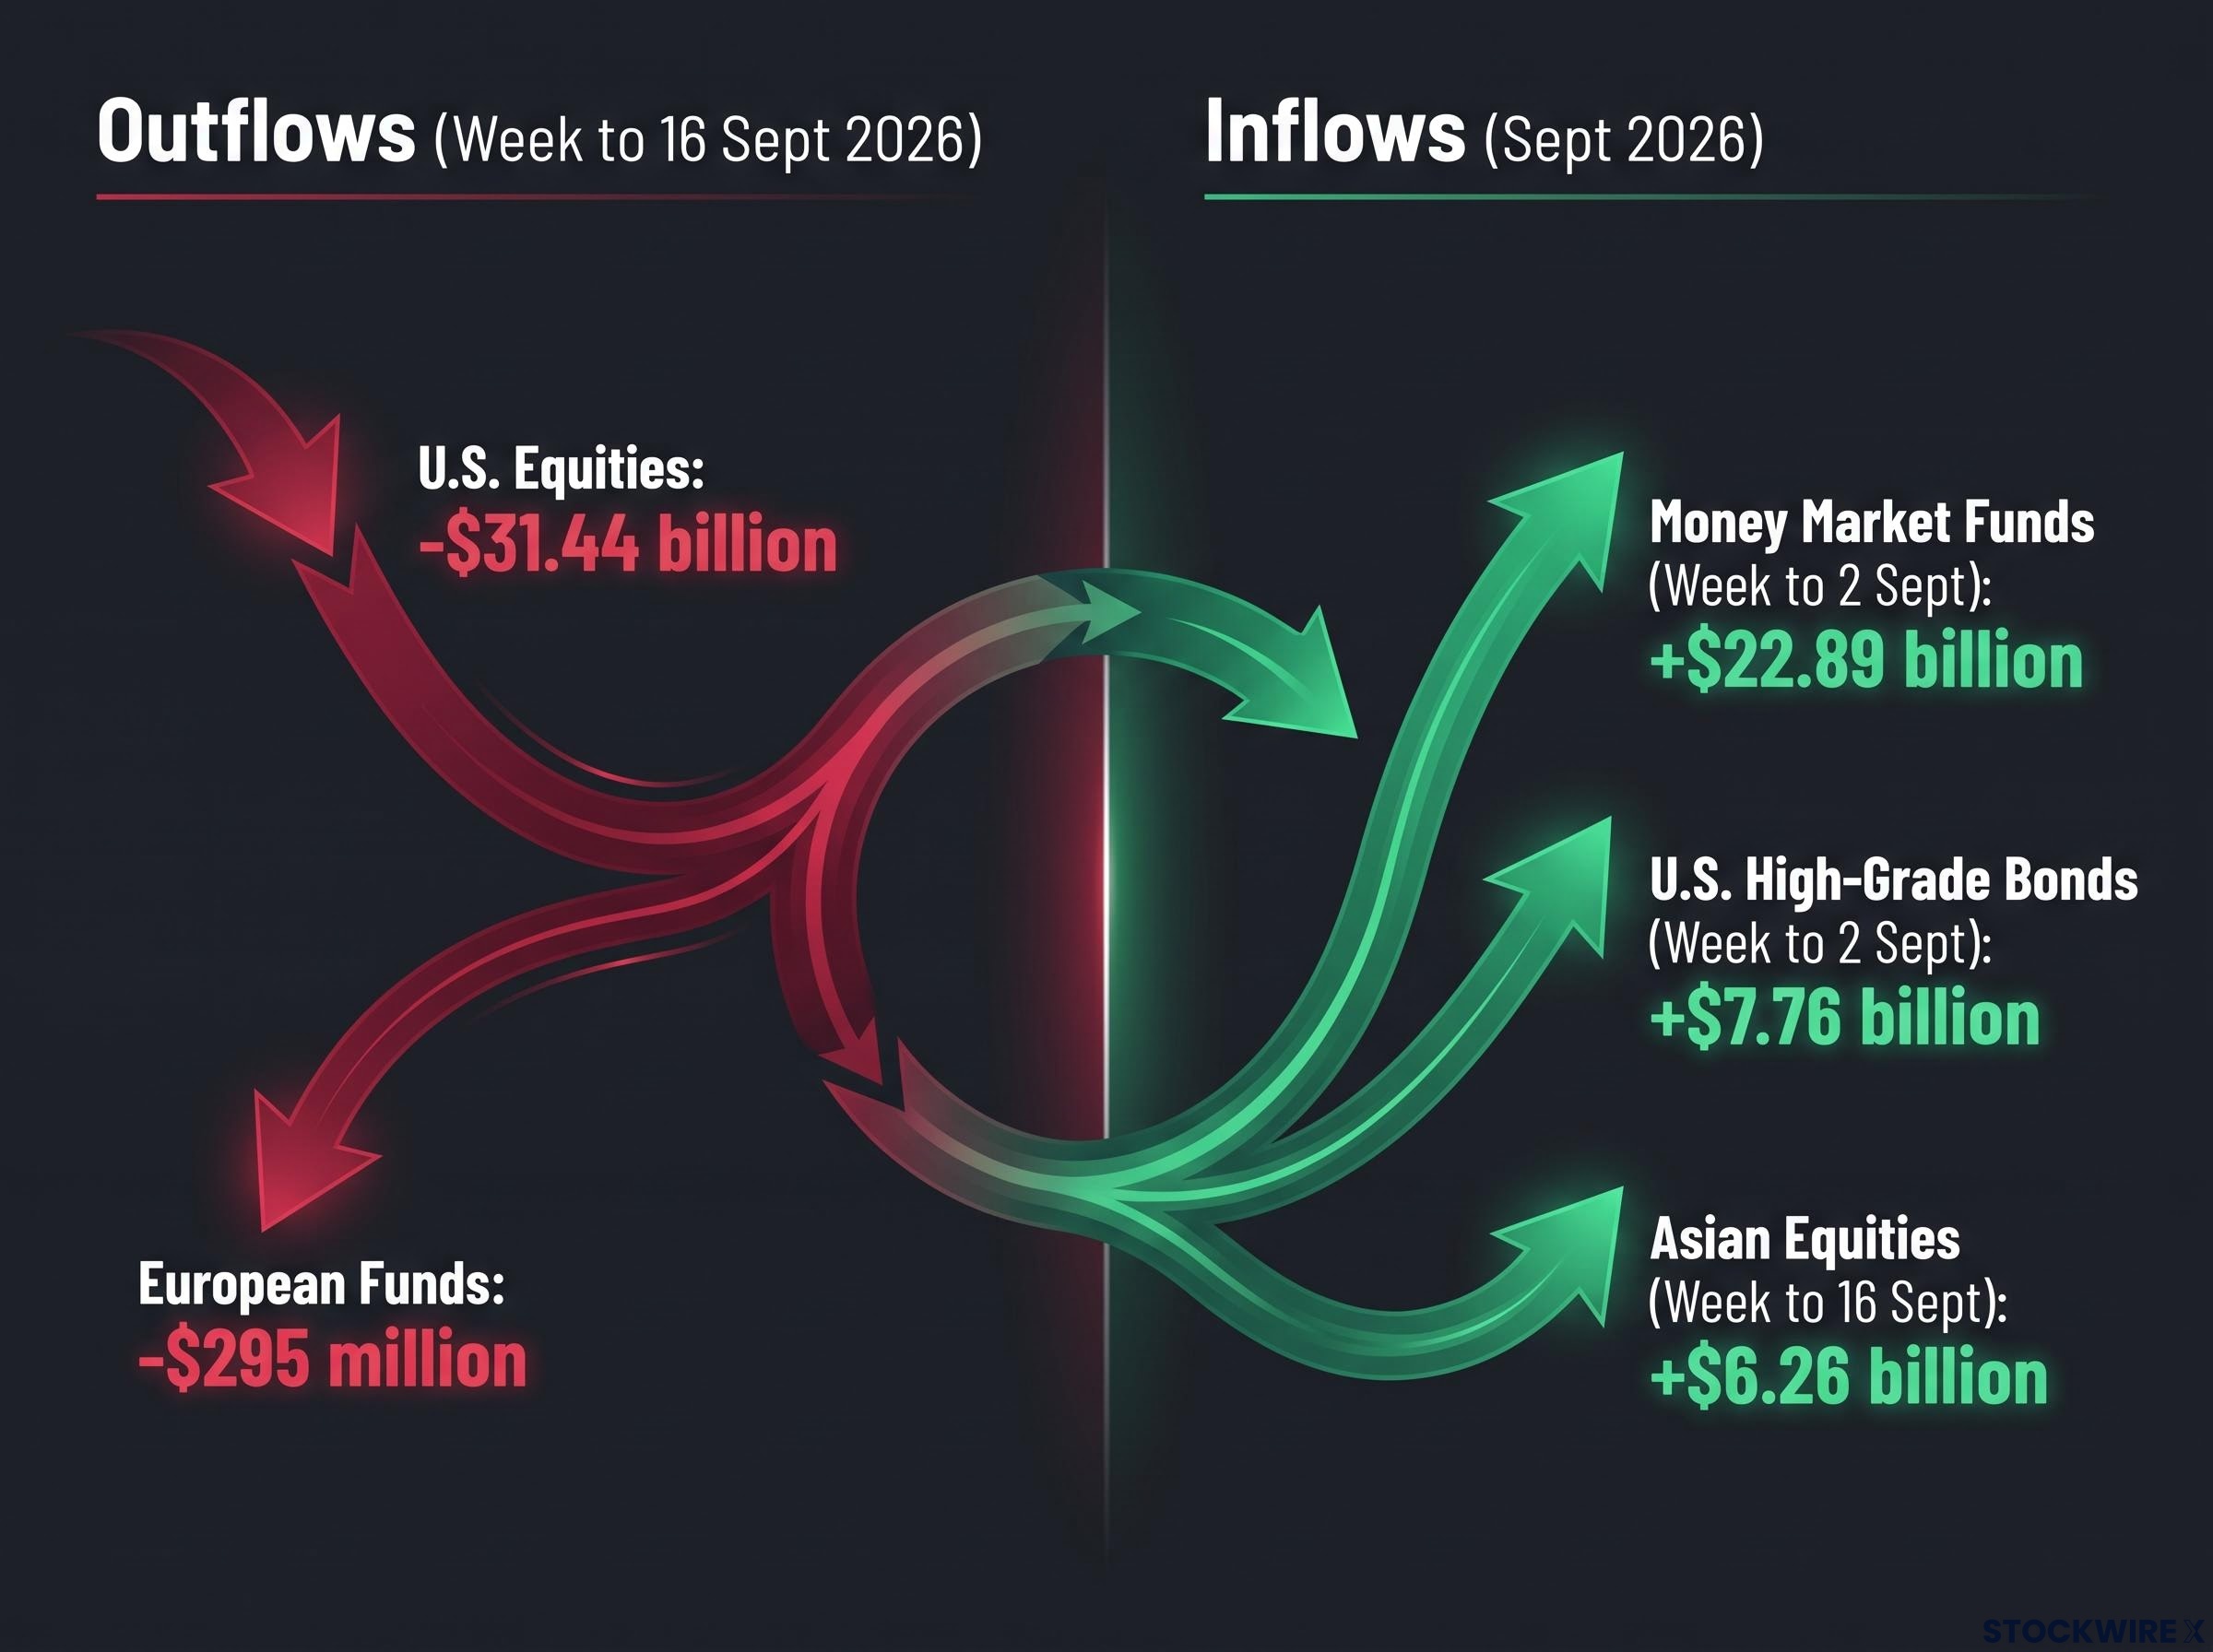
The read for you is direct. Your exposure to growth equities and long-duration assets carries the same pressure that is driving those outflows. This is not a distant institutional story; it is the mechanism operating on your portfolio too.
What oil prices have to do with how long this lasts
The comforting version of this story says yields will eventually fall once inflation cools. Energy prices are the reason that version is harder to defend than it sounds.
Brent crude recently pushed above $100 per barrel, roughly 25% higher than early-August 2026 levels, with mid-September reports citing a $103-104 range (unverified). Oil feeds inflation twice: directly through fuel and heating costs, and indirectly through transport and input costs that ripple into services prices. Both make it harder for any central bank to declare the inflation fight won.
The oil price transmission into inflation is more complex than headline CPI captures: war-driven energy costs routed through airfares and logistics appear in goods price categories rather than the energy line, meaning core PCE readings may be systematically understating the conflict’s contribution to sticky inflation.
That constraint lands differently on each major central bank:
- The Fed is watching PCE, which its own forecast already puts above target for 2026. Rising oil keeps that reading elevated and keeps the hawkish stance alive for longer.
- The ECB faces European inflation that is especially sensitive to energy costs, giving it reason to keep financial conditions tight.
- The BoJ, a large energy importer, sees import-driven price pressure complicate its slow move toward policy normalisation, with its benchmark already at a 31-year high.
Supply shock or demand signal? Why the distinction matters for rates
Not all oil rallies are equal, and the difference matters for rates.
A supply-side shock, driven by geopolitics that cut output, is in theory transitory. Central banks can sometimes look through it. A demand-driven rally is different: it signals a resilient economy, which may justify keeping policy restrictive for longer to cool things down.
Current market consensus leans toward supply constraints and a geopolitical risk premium, with conflict in the Middle East involving Iran cited as a disruption to regional energy flows. Some fund-flow commentary points to still-resilient demand, but the supply narrative dominates.
Treat oil as a leading indicator here. It may be the single variable that determines whether central banks can begin easing in 2026 at all, which makes it your best clue for how long the elevated yield environment persists.
What the late-September data releases could change
The structural forces are set. The near-term question is whether the incoming data confirms them or starts to challenge them, and the final days of September deliver the first real stress test.
The Fed recently raised rates by 25 basis points, so every release now helps markets judge whether that was a standalone move or the start of more tightening. Two reports carry the most signal: PCE inflation and the employment data, because they speak directly to the two things the Fed has said it is watching, price stability and labour market tightness.
| Date | Release | Why it matters for rate expectations |
|---|---|---|
| 24 Sept | Initial jobless claims, new home sales | Early read on labour softening and rate-sensitive housing |
| 25 Sept | Durable goods, final consumer sentiment | Business investment appetite and household mood |
| 29 Sept | JOLTS job openings, consumer confidence | Labour tightness, a core Fed input |
| 30 Sept | ADP employment, PCE inflation, consumer spending, GDP | The Fed’s preferred inflation gauge plus growth, in one session |
30 September is the single most consequential day of the cluster. PCE inflation, ADP employment, and GDP all land together, and the combination is the most likely trigger for a genuine repricing of whether yields have peaked or have further to run.
There is already a contradictory signal in the mix. The preliminary September consumer sentiment reading came in at 47.8, a deeply pessimistic figure, yet inflation expectations rose at the same time. Consumers feel gloomy about the economy but still expect prices to climb, a combination that muddies the Fed’s read considerably.
Core PCE is estimated at roughly 3.4% year-on-year heading into the release, so the actual print could move rate expectations meaningfully in either direction.
The practical takeaway: know which releases matter before they hit, so you interpret the market’s reaction rather than chase the headline. Market strategists have also noted that sharp, emotion-driven selloffs after these releases may hand cash-heavy investors a buying opportunity.
What a structurally higher cost of capital means for decisions you make now
Pull the threads together and three forces define the environment you are positioning inside.
Term premium repricing looks structural and likely persistent. Energy-driven inflation is elevated near-term with genuinely uncertain duration. And institutional repositioning, while significant, is clearly unfinished.
That last point is the signal worth acting on. Even after the outflows, fresh money keeps arriving in equities: global equity funds took in $12.46 billion in the week to 15 July 2026, following $48.35 billion the prior week (unverified). Fixed income inflows have reached roughly 7% of beginning-of-year assets against equity inflows near 2.8% (unverified). The rotation toward bonds is underway but not complete, which means the trend has room left to run.
Three portfolio dimensions deserve a fresh look:
- Duration exposure: long-dated bonds face further mark-to-market losses if term premia keep rising. Hold them as a deliberate choice, not an inherited one.
- Growth-versus-value balance: growth equities with distant earnings carry the heaviest discount-rate exposure.
- Emerging market weight: worth re-examining against your tolerance for capital-flow risk.
There is also the slow-burn refinancing cliff: sovereign and corporate debt rolled at today’s yields will steadily compound the budget and margin pressures already building.
The emerging market dimension
Higher global yields and a stronger dollar create specific strain for emerging economies running current account deficits. To keep foreign capital from leaving, they must offer higher yields themselves, which raises their own domestic borrowing costs in a self-reinforcing squeeze.
This is already visible. Emerging market equity funds shed more than $100 billion in June 2026, reported as the largest quarterly outflow since 1995 (unverified).
Treat this as a consideration, not a forecast. If the structural yield environment holds, emerging market exposure warrants closer scrutiny than it did in the low-rate era.
The question worth asking is simple: was your current positioning built for this environment, or for the one that just ended? The framework above helps you answer it, without anyone telling you what to buy or sell.
For readers wanting to understand why institutional investors are not yet pricing systemic stress despite multi-decade yield highs, our full explainer on credit spreads and yield signals examines how investment-grade and high-yield spreads provide a parallel read on whether the bond market is signalling crisis or repricing.
This article is for informational purposes only and should not be considered financial advice. Investors should conduct their own research and consult with financial professionals before making investment decisions.
Past performance does not guarantee future results. Financial projections are subject to market conditions and various risk factors. Several data points referenced above are unverified market flow estimates and should be treated as indicative rather than confirmed.