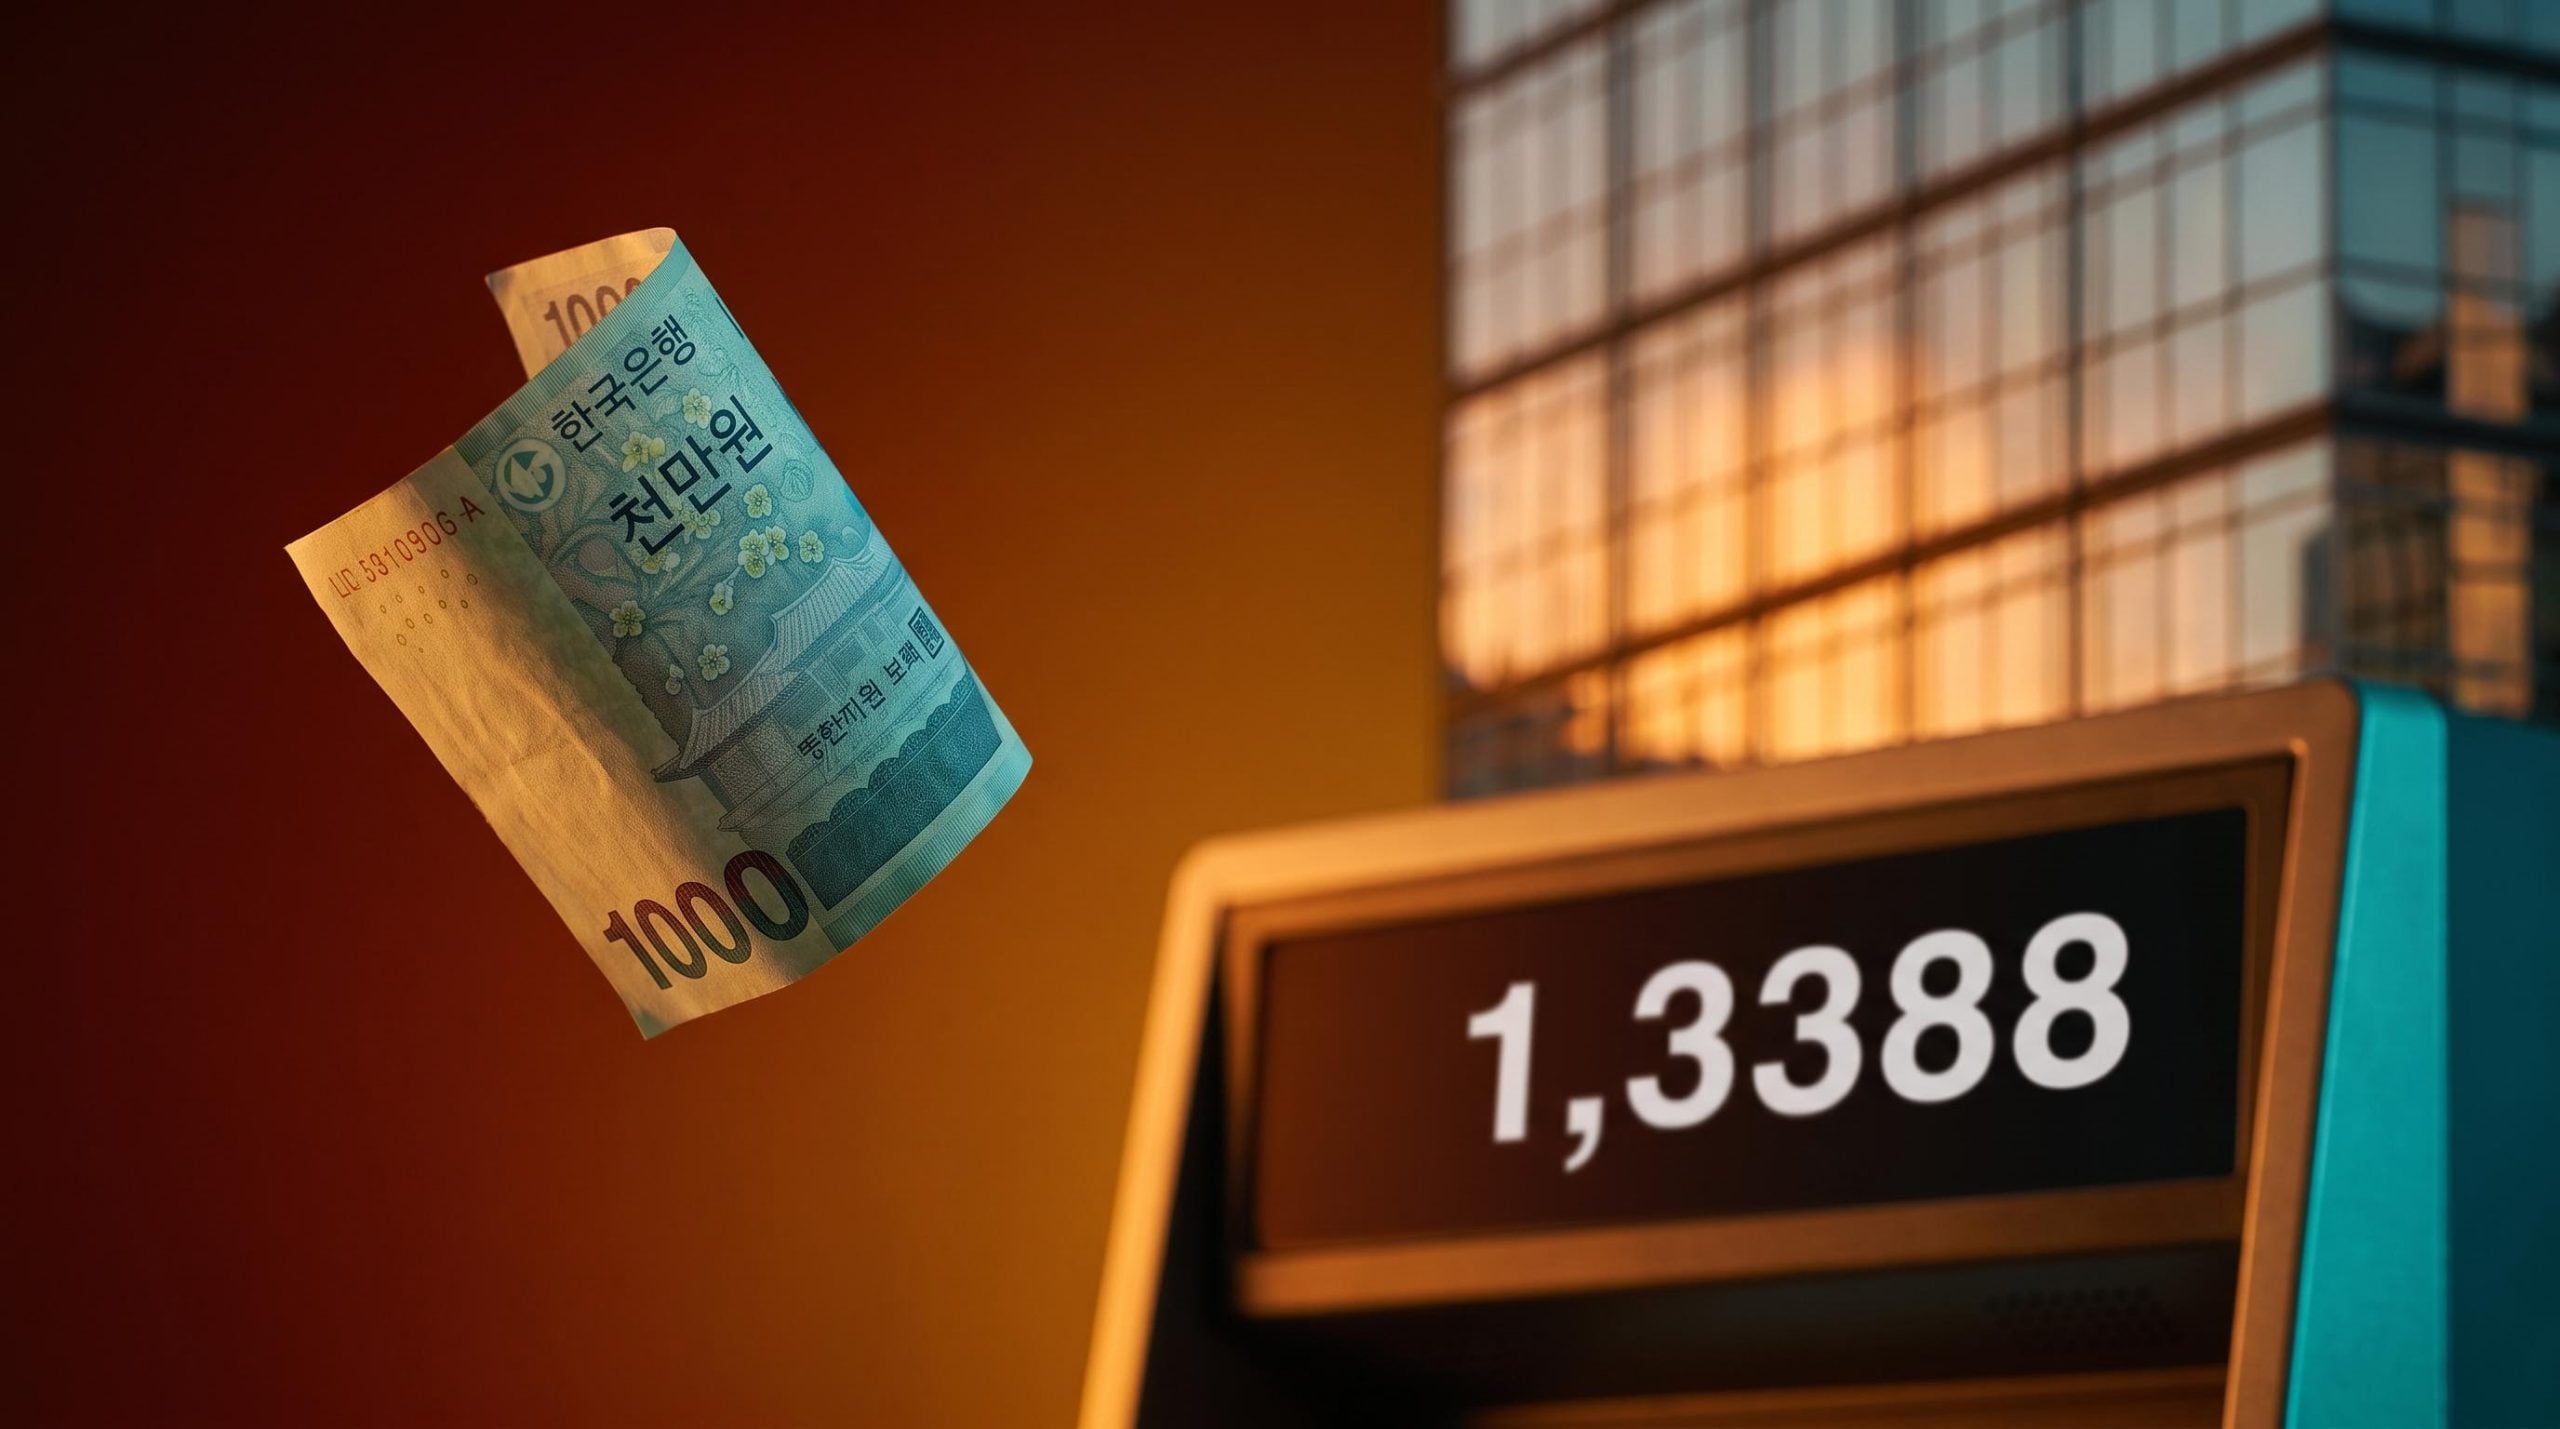
South Korea runs a current account surplus. Its semiconductor exports remain among the strongest in Asia. Its central bank has kept a hawkish tone. Yet none of that has been enough to stop the won from sliding toward levels the country typically only sees during a crisis.
As of mid-September 2026, the currency is trading near 1,388 per dollar. Two forces are behind the move: roughly KRW 14 trillion of foreign equity divestment over recent sessions, and the highest US Treasury yields since 2023 after the latest Federal Open Market Committee meeting.
That combination matters because it complicates any USD/KRW forecast built on fundamentals alone. Strong exports and a hawkish Bank of Korea are supposed to defend a currency. Here, they are being overwhelmed.
The distinction that follows is the one worth getting right: separating temporary portfolio rebalancing from genuine structural weakness. Get that read correct, and the near-term technical floor becomes far easier to assess.
Deconstructing the 14 trillion won foreign equity exodus
The headline number looks like panic. Look closer and it reads as something more surgical.
Over the seven most recent trading sessions, foreign investors sold roughly KRW 14 trillion in Korean equities, including a single Thursday session that saw KRW 2.3 trillion leave the market. Subsequent tallies point to net foreign selling of 11.95 trillion won across six consecutive sessions from 9-16 September 2026. Either way, the pace has been severe.
What it has not been is broad. Over 93% of the six-session foreign net selling targeted just two names: Samsung Electronics and SK hynix. Between them, they accounted for the overwhelming majority of the outflow.
| Asset | Foreign net selling (six sessions) | Share of concentrated selling |
|---|---|---|
| Total selloff | ~KRW 14 trillion | 100% |
| Samsung Electronics | KRW 6.29 trillion | Over 93% combined |
| SK hynix | KRW 4.88 trillion |
That concentration is the whole story. The selling is aimed at artificial intelligence and semiconductor exposure specifically, not at Korean corporate health generally.
Semiconductor capital rotation has been the defining flow story of 2026: SOXX gained roughly 40.4% in April alone, and the $86 billion in total April inflows is underpinned by a projected $630-$700 billion AI infrastructure investment cycle that has simultaneously concentrated risk inside Korean index heavyweights such as Samsung Electronics and SK hynix.
The broader KOSPI index tells you the same thing through its resilience. Despite the scale of the outflow, the index has held up better than the raw numbers would suggest, which is not what a market in capitulation looks like.

It is worth remembering the backdrop, too. Foreign investors net sold 156.56 trillion won on the KOSPI year-to-date through 3 July 2026, so heavy selling has been a feature of this year rather than a sudden September event.
For your portfolio, the read is important. Extreme concentration in two AI-linked chipmakers signals a targeted sector rotation, which means the currency drag it produces should not be mistaken for a warning about broader Korean corporate distress. Confusing the two is how investors talk themselves into selling assets that were never the target.
When big ASX news breaks, our subscribers know first
Why the won is uniquely vulnerable to portfolio rotation
If the selling is so concentrated, why does the whole currency move so hard? The answer sits in the machinery underneath the flows, and it is more structural than most headlines admit.
Start with the rebalancing mechanics. The surging weights of Samsung Electronics and SK hynix in global and emerging-market benchmarks force active managers to trim their Korean exposure simply to stay within allocation and concentration limits. When two stocks push a single country’s weighting too high, the rules require selling regardless of conviction. Profit-taking after dramatic AI-driven rallies has only accelerated that process.
Then there is the domestic side, which compounds everything. Korean residents have become large buyers of overseas assets, and that outbound flow drains won support at exactly the moments external shocks hit hardest.
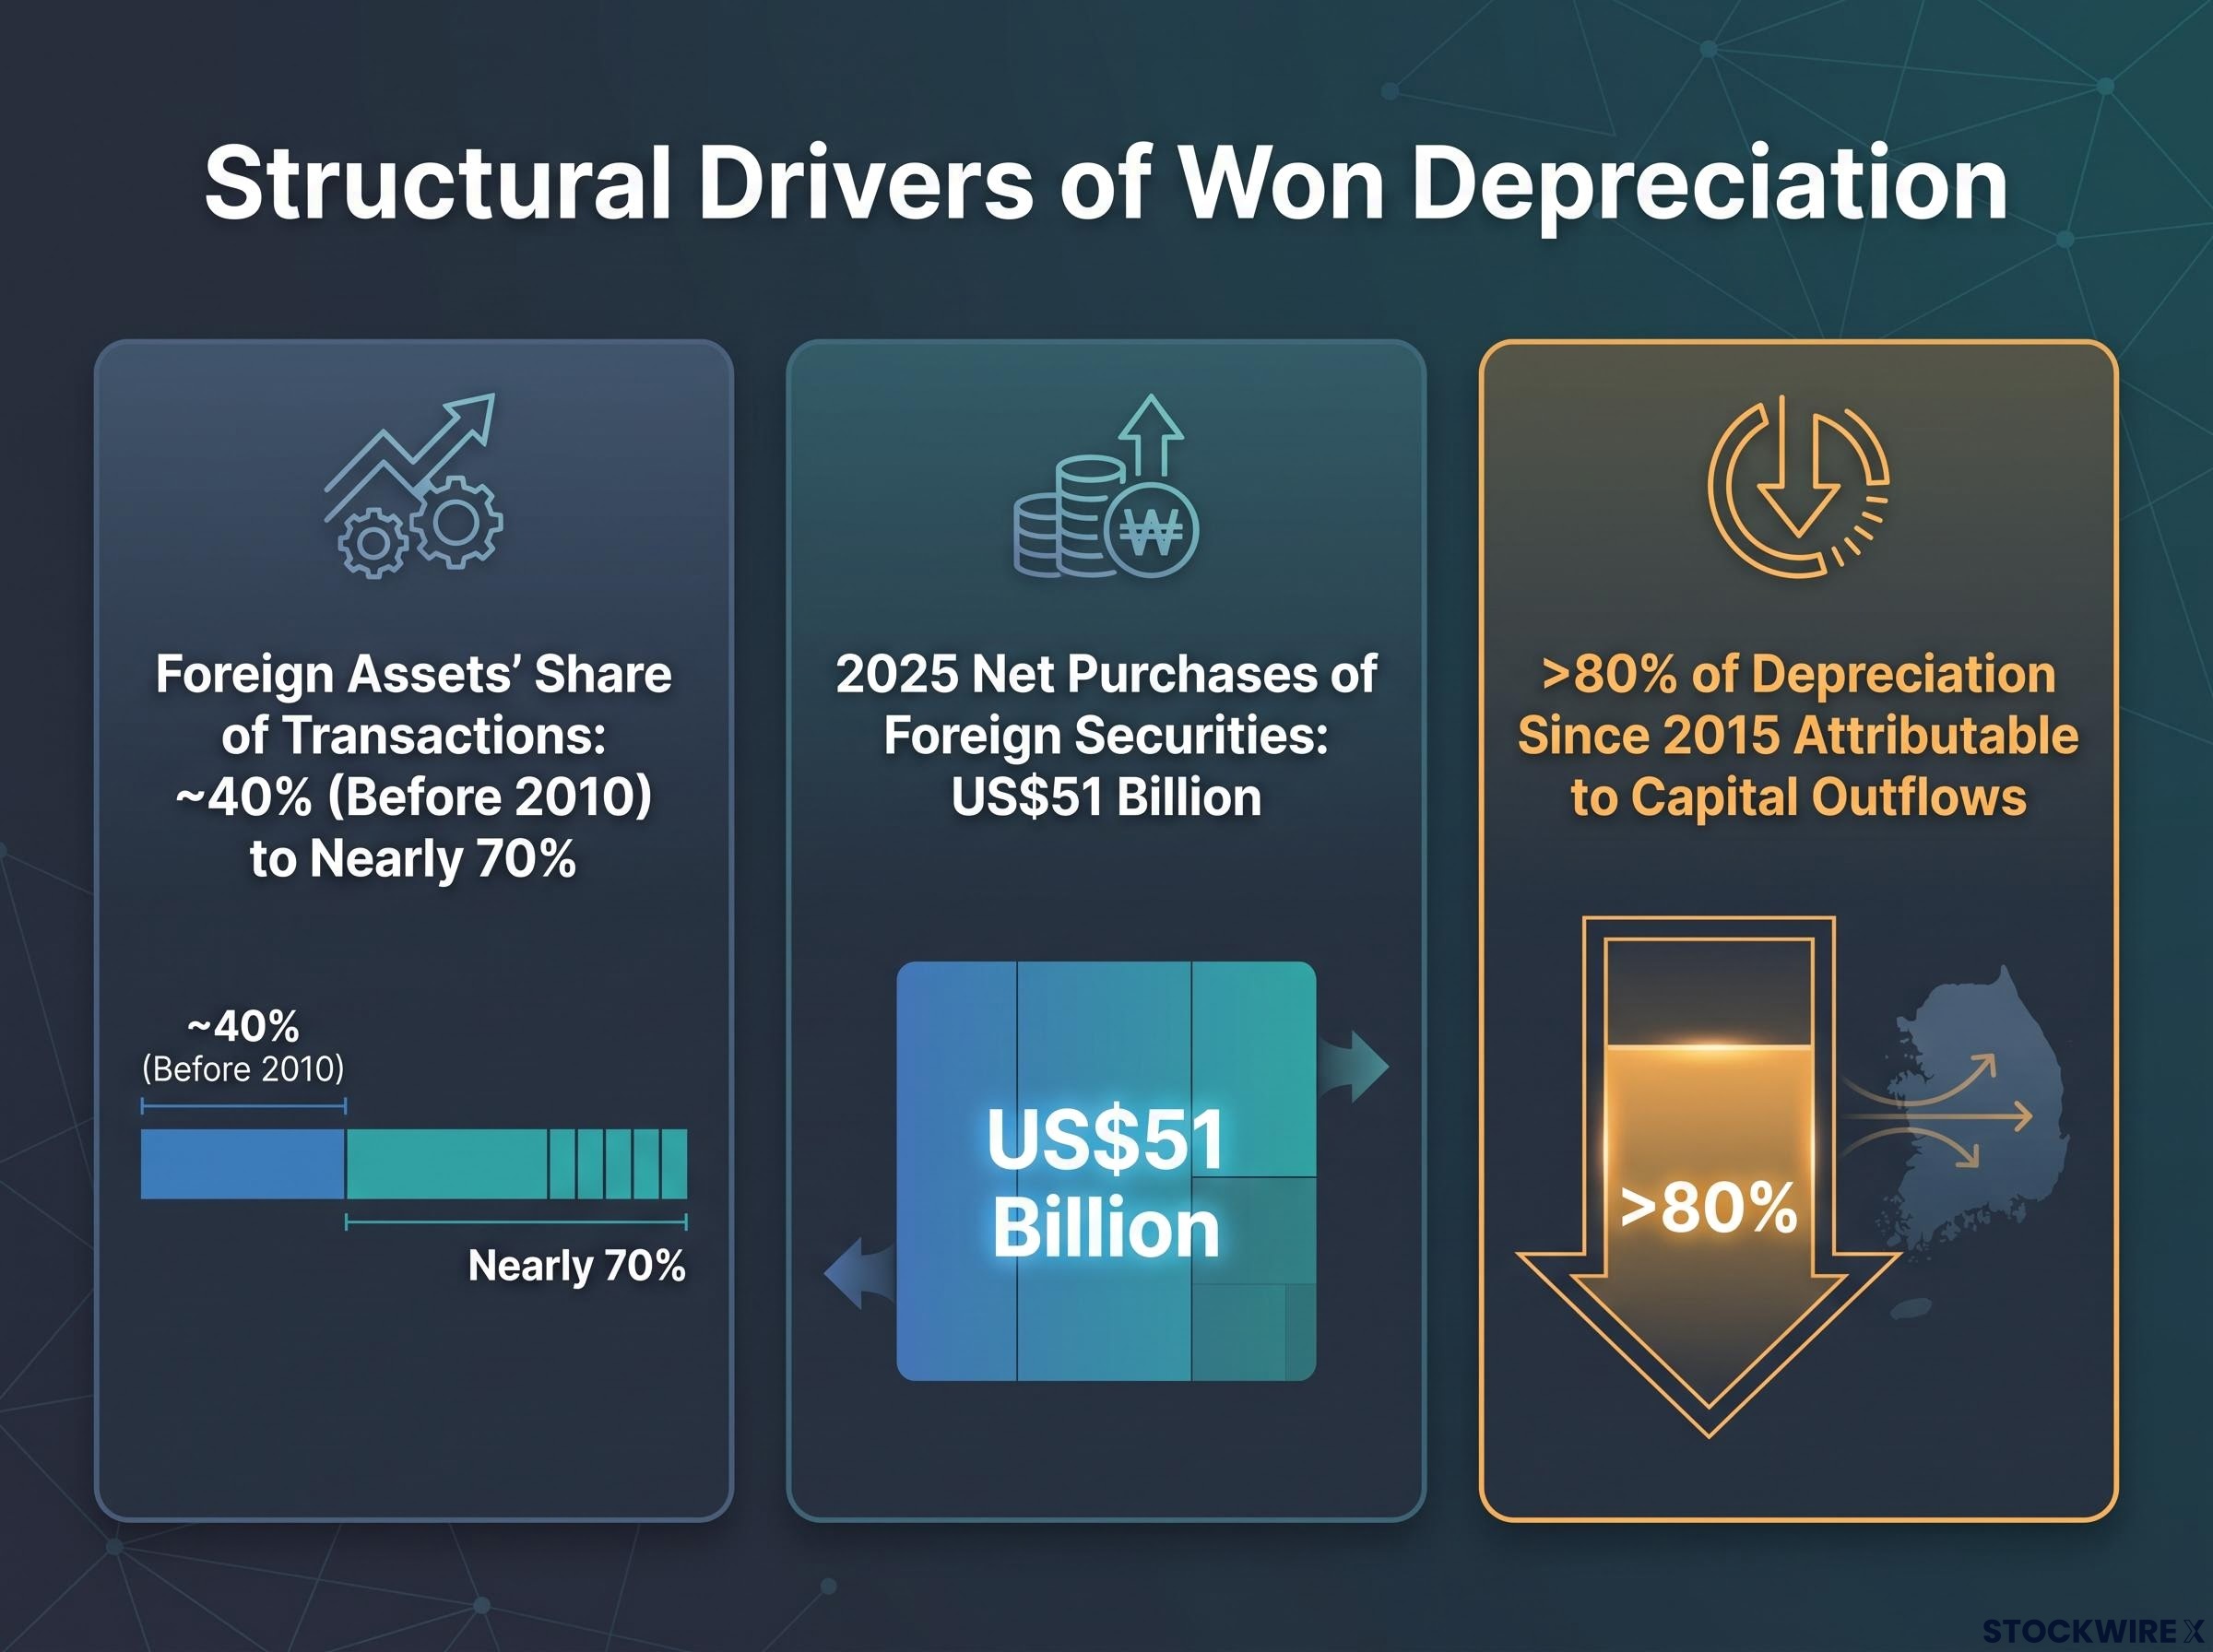
This is the structural shift that now supersedes traditional trade balances. According to the Bank of Korea and the Korea Capital Market Institute, over 80% of the won’s depreciation since 2015 is attributable to capital outflows rather than trade performance. Currency valuation is increasingly a story about where capital moves, not what a country ships.
Capital outflow dynamics have been reshaping Korean FX for years: according to Commerzbank, repatriation-driven currency moves are qualitatively different from speculative ones because they are tied to corporate cash cycles and harder to reverse on a single macro headline, giving structural flows a more durable influence on USD/KRW than intervention or sentiment alone.
The composition data underlines it. Foreign assets’ share of total financial transactions has risen from roughly 40% before 2010 to nearly 70%. And Korean retail and institutional investors made approximately US$51 billion in net purchases of foreign securities in 2025 alone.
Korea Exchange CEO Jeong Eun-bo has emphasised that messages from foreign institutions consistently describe the current move as rebalancing, noting that investors remain constructive on the market.
That framing matters for how you weigh policy responses. Once you understand that structural capital outflows, both foreign and domestic, are doing the heavy lifting, it becomes clear why standard government foreign exchange interventions tend to have limited staying power. Selling dollars to prop up the won fights the flow rather than the cause, and the flow is structural. For long-term emerging market currency exposure, that is the difference between a dip to buy and a trend to respect.
The inescapable gravity of 5 percent US Treasury yields
Local dynamics explain the shape of the move. Washington explains its force.
At its 15-16 September 2026 meeting, the Federal Open Market Committee voted unanimously to raise its target federal funds rate by 25 basis points to a range of 3.75%-4.00%, its first hike since July 2023. The vote confirmed what markets had already priced: a high-for-longer regime rather than a return to easing.
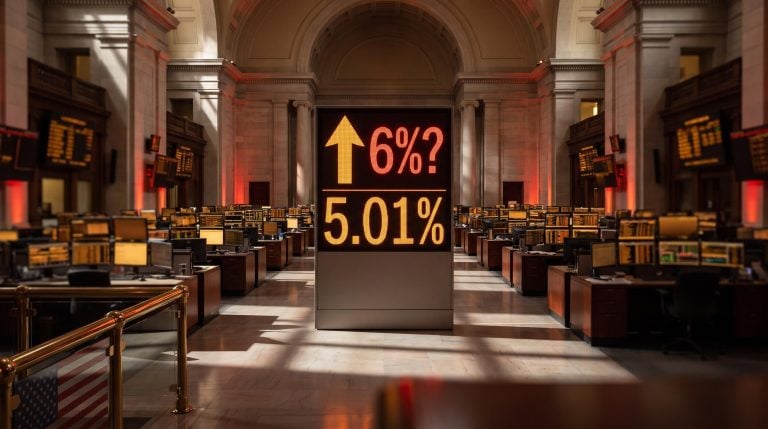
The bond market reflected it before the decision even landed. The US 10-year Treasury yield briefly crossed the threshold, reaching 5.01% on 14 September before settling to 4.96% by 18 September. When the world’s benchmark safe asset pays close to 5%, the return hurdle for holding riskier Asian equities climbs with it.
That is the transmission channel. Every rise in US yields raises the bar for what a Korean equity position needs to deliver to justify itself, and capital rotates accordingly.
The won is not suffering alone. The strong-dollar environment has pressured currencies across the region, though the severity varies:
- Indonesian rupiah: down 7.2% year-to-date, among the weakest in Asia
- Indian rupee: down 6.2% year-to-date, under sustained pressure
- Thai baht: softer alongside the broader complex
- Philippine peso: weighed down by the same widening rate differentials
Currencies such as the Singapore dollar, Malaysian ringgit and Vietnamese dong have held up comparatively well, which tells you the won’s weakness is not purely a dollar story. Its extra vulnerability comes from that sector concentration and resident capital flight on top of the global backdrop.
For your positioning, the swap-rate maths is unforgiving. As the differential between US and Korean rates widens, you have to demand meaningfully higher expected equity returns to justify holding won-denominated assets at all. In a high-for-longer world, that hurdle does not fall on its own.
Charting the support and resistance levels for the currency pair
Macro causes set the direction. Traders still need the levels, and the near-term map is now reasonably well defined.
With spot near 1,388, the pair retains an upward technical bias on the daily chart, though momentum indicators such as the Relative Strength Index (a gauge of whether an asset has moved too far, too fast) suggest the recent surge is losing steam. That points to consolidation rather than a straight-line breakout.
The downside floors and upside ceilings worth watching:
- First support at 1,373, the initial line of defence on any pullback
- Second support at 1,365, aligning with the 21-day moving average
- First resistance at 1,387, the 23.6% Fibonacci retracement of the sharp July-to-September decline
- Second resistance at 1,410, where the 38.2% Fibonacci retracement meets the 50-day moving average
The clustering of resistance near 1,410 is the level to respect. It signals a natural technical ceiling, but only if the Bank of Korea keeps its hawkish tightening stance to defend the currency. Remove that support, and the ceiling weakens.
Bank of Korea tightening has been the policy counterweight throughout 2026: the August rate hike to 3.00% was backed by a 6-1 board vote and accompanied by a GDP growth upgrade to 3.3%, a configuration that pushed Korean assets into a rare emerging-market position where real rates turned modestly positive and foreign fixed-income inflows became viable on their own merits.
Not every desk agrees on the bands. OCBC strategists Sim Moh Siong and Christopher Wong flag support nearer 1,375 and 1,365, while Commerzbank points to broader consolidation ranges around 1,330-1,380 or 1,360-1,400, noting that Bank of Korea tightening supports the won but progress will be gradual.
Institutional consensus and recovery forecasts
Look further out and the disagreement widens. Bank of America has forecast the won hovering around 1,395 per dollar by end-2026, while State Street Markets has pointed to weakness toward 1,390-1,400 over the same window.
A broader survey of experts anticipates a short-term rebound followed by renewed softening, with year-end projections clustering in the 1,340-1,450 range. The gap between the optimistic and cautious ends of that band is the real signal: any recovery is expected to be conditional and gradual, not a clean snap-back.
That conditionality rests on three things. A durable won recovery needs a narrower US-Korea rate gap, sustained export strength, and a genuine slowdown in domestic capital outflows. Absent all three, the technical ceiling holds and the floor keeps getting tested.
Navigating a conditional currency recovery
Pull the threads together and the picture is coherent. The equity selloff is real but concentrated, the structural outflows are the deeper driver, and US yields are the force amplifying both. Technical levels give you the guardrails; the rate gap gives you the direction.
Over the next quarter, the indicator that matters most is not the daily equity flow headline. It is the US-Korea rate differential, alongside the pace of resident capital moving offshore. Watch those, and the swings around 1,388 become far easier to interpret.
The trap is reacting to isolated outflow numbers. The signal sits in the gap.
For readers wanting to translate the currency and flow analysis into a practical positioning framework, our dedicated guide to investing in South Korean stocks covers broker access, KRX ticker conventions, and how won movements act as a second return driver that can silently amplify or undermine equity gains.
This article is for informational purposes only and should not be considered financial advice. Investors should conduct their own research and consult with financial professionals before making investment decisions.
Past performance does not guarantee future results. Financial projections are subject to market conditions and various risk factors, and forward-looking statements are speculative and subject to change based on market and policy developments.