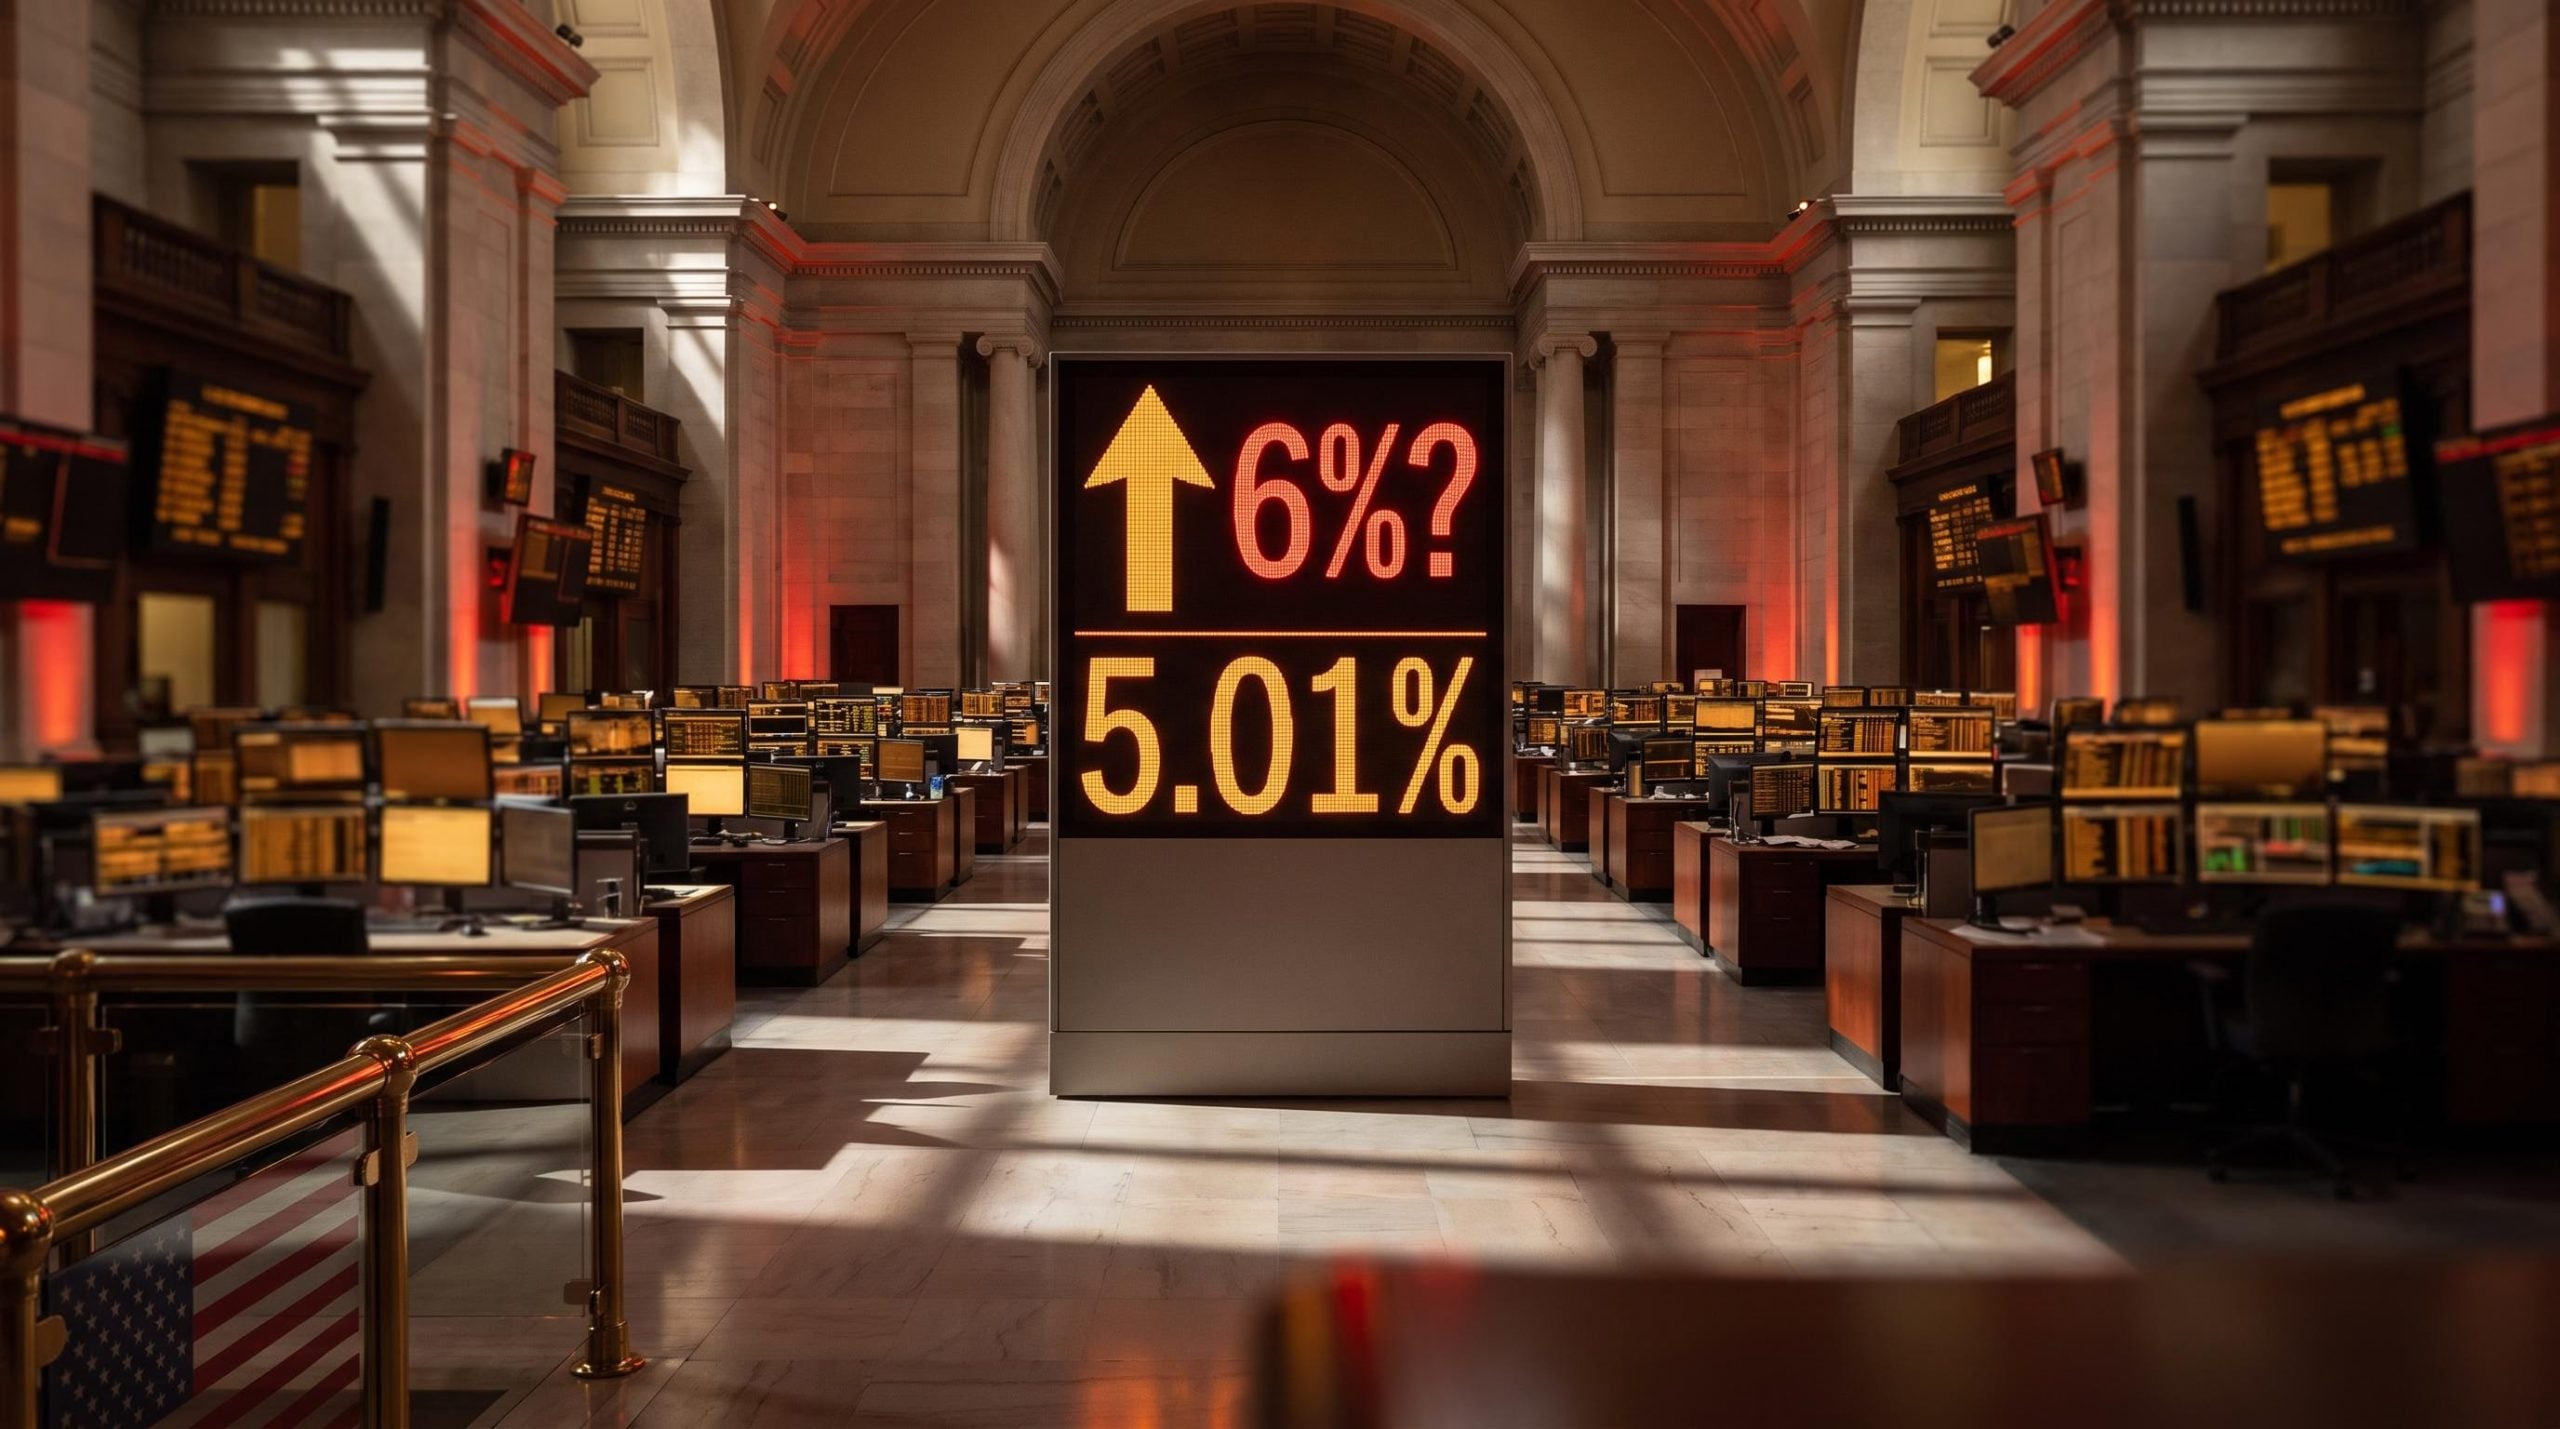
The 10-year Treasury yield sits near 5.0% today. One prominent contrarian says it is heading to 6%. That gap is not a curiosity. It is a scenario with real consequences for mortgage rates, equity valuations, and the cost of nearly every dollar borrowed in America.
Treasury Secretary Scott Bessent has called the 10-year yield the single most important asset globally. It has already risen roughly 21% year-over-year and is trading near levels last seen in 2007. Most institutional forecasters expect it to fall back toward 4.5% by year-end. The structural forces underneath the surface tell a more complicated story.
This is the explainer for what a move to 6% would actually mean in practice. After reading, you will understand what is driving the contrarian case, why the transmission effects from a 6% yield are more consequential than you might expect, and what all of it means for how you think about your own portfolio.
Why one analyst is calling for 6%, while Wall Street expects a retreat
Market analyst Todd “Bubba” Horowitz forecasts the 10-year yield reaching 6% or higher by year-end, driven by what he describes as persistent borrowing demand and structural economic imbalances. He rates the outcome at roughly 50/50 in his own assessment. That is not a fringe conviction call. It is a coin flip from someone watching the same data everyone else sees.
Wall Street disagrees, and not by a little.
As of 18 September 2026, the 10-year sits at approximately 5.01%, its highest since 2007. The major institutions cluster well below Horowitz. Goldman Sachs revised its end-2026 target to 4.75%, citing higher energy prices and less room for front-end relief. Bank of America holds a baseline of 4.50%. Morgan Stanley scenario tables land around 4.05-4.25%, treating roughly 4% as an effective floor. A July 2026 Reuters poll of 74 fixed-income strategists produced a median of about 4.48% over three to six months.
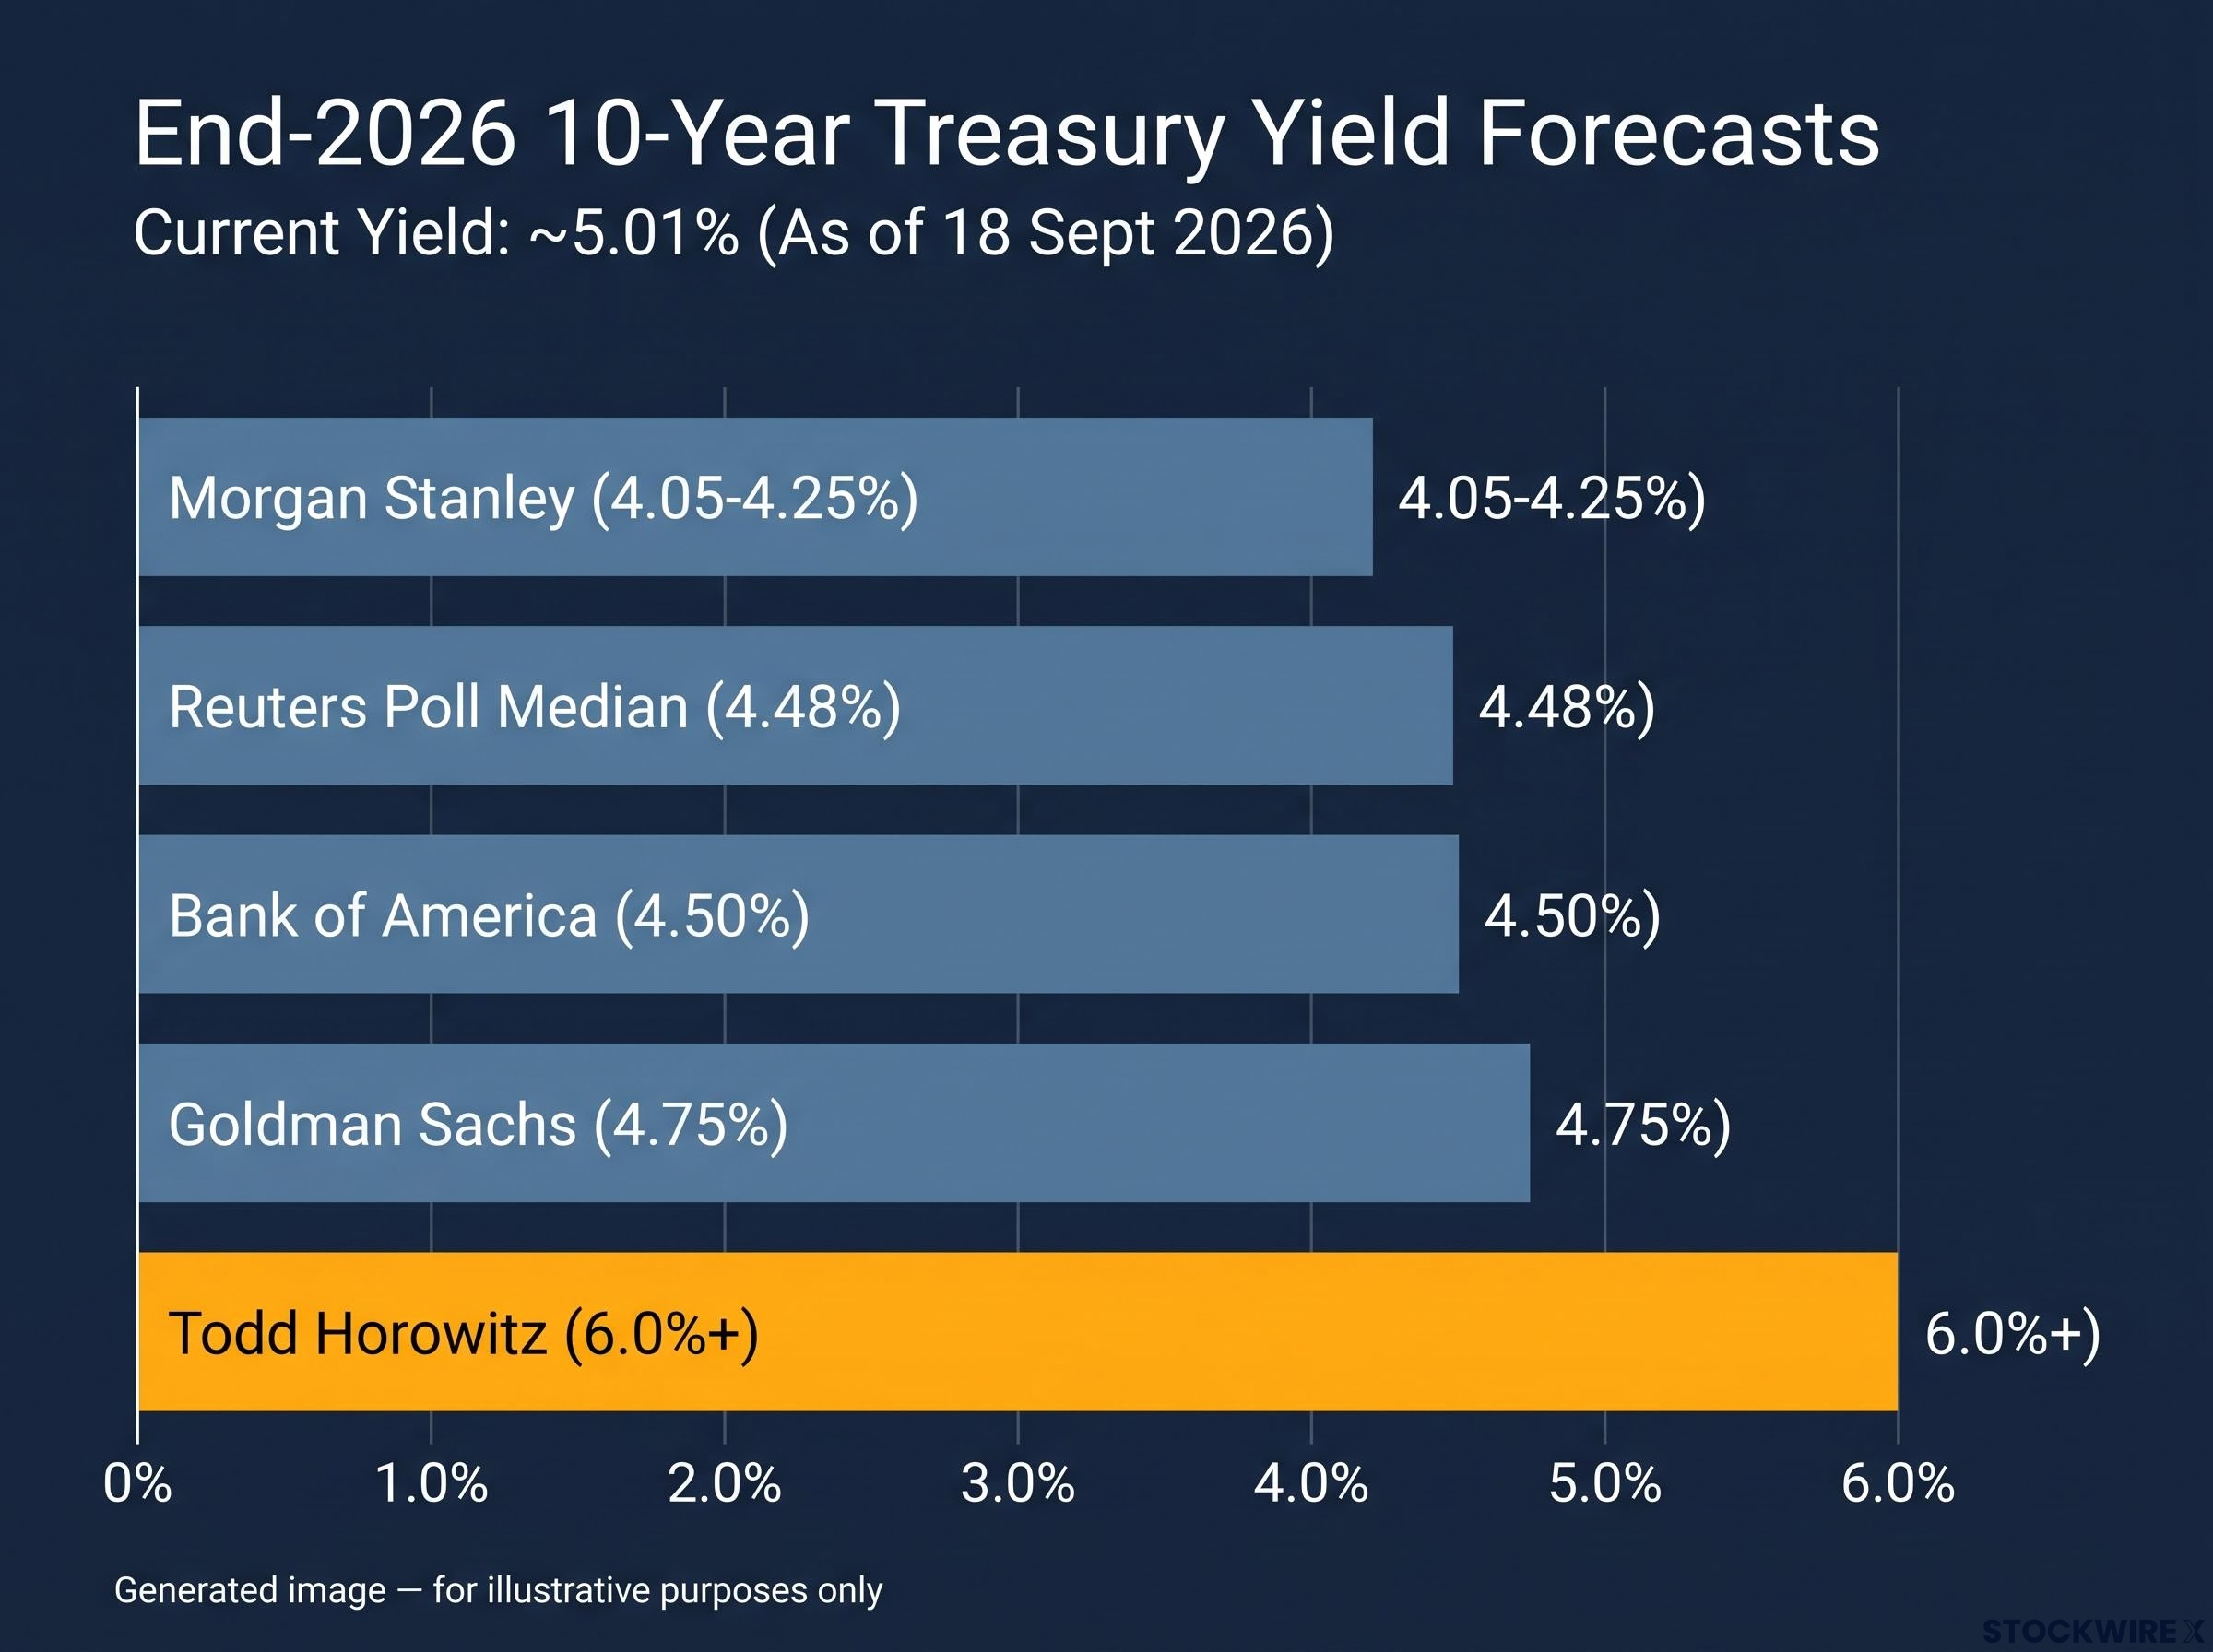
| Forecaster | End-2026 Forecast | Key Rationale |
|---|---|---|
| Goldman Sachs | 4.75% | Higher energy prices, reduced front-end relief |
| Bank of America | 4.50% | Baseline with downside risks toward 4.0-4.25% |
| Morgan Stanley | 4.05-4.25% | Roughly 4% treated as an effective floor |
| Reuters Poll (median) | 4.48% | Median of 74 strategists, 3-6 month horizon |
| Todd Horowitz (contrarian) | 6.0%+ | Persistent borrowing demand, structural imbalances |
Prediction markets sit between the two camps. Kalshi data pricing showed a 73% chance the yield ends 2026 above 4.75%, a 58% chance of 5% or higher, and a 32% chance of 5.1% or above.
Treasury Secretary Scott Bessent has described the 10-year yield as the single most important asset globally.
What this disagreement tells you is not simply that forecasters use different models. It reflects genuinely different views on whether the structural forces in the U.S. economy are being adequately priced. That uncertainty is precisely why the 6% scenario deserves serious analysis rather than a dismissive wave. Knowing where professional money is positioned, and where it is not, is the starting point for any honest read on the tail risk sitting inside your own holdings.
The gap between institutional forecasters and the contrarian call reflects a deeper disagreement about how bond yields are set and what structural forces the market is genuinely pricing, particularly whether the current term premium normalisation is a cyclical adjustment or a permanent regime change.
When big ASX news breaks, our subscribers know first
The structural forces that make 6% more than a tail risk
Three pressures are pushing in the same direction, and each one strengthens the others.
Start with the fiscal picture. The Congressional Budget Office revised its FY 2026 deficit estimate to approximately $2.1 trillion, around 5.8% of GDP, with federal debt projected toward 120% of GDP by 2036. Heavy Treasury issuance to fund that gap pushes long-term yields up mechanically. IMF analysis quantifies the link: a 1 percentage point rise in primary deficits lifts 10-year yields by 26-29 basis points over two years. Bigger deficits mean more bonds, and more bonds mean the market demands a higher yield to absorb them.
Then there is the term premium, the extra return investors require for holding longer-dated debt. RBC iShares estimates that normalising term premium alone could push 10-year rates as much as 1.3 percentage points higher than they would otherwise be. A large part of that comes from a shrinking pool of price-insensitive buyers. Foreign central banks historically suppressed yields by buying Treasuries regardless of price. As that buying fades, the suppressant fades with it.
The retreat of price-insensitive buyers has been partly offset by domestic commercial banks, which now hold a record $4.8 trillion in Treasuries driven by Basel capital treatment, but this substitution introduces a different risk profile: bank balance sheets are rate-sensitive in ways that foreign reserve managers are not, and a sustained yield spike would reprice those holdings against equity capital.
Stack those two forces and 6% stops looking wild. Add the third, and it starts to look like a destination.
Consumer delinquencies as a policy constraint
The third force is consumer stress, and it matters for a reason that is not obvious. It constrains what the Federal Reserve can do.
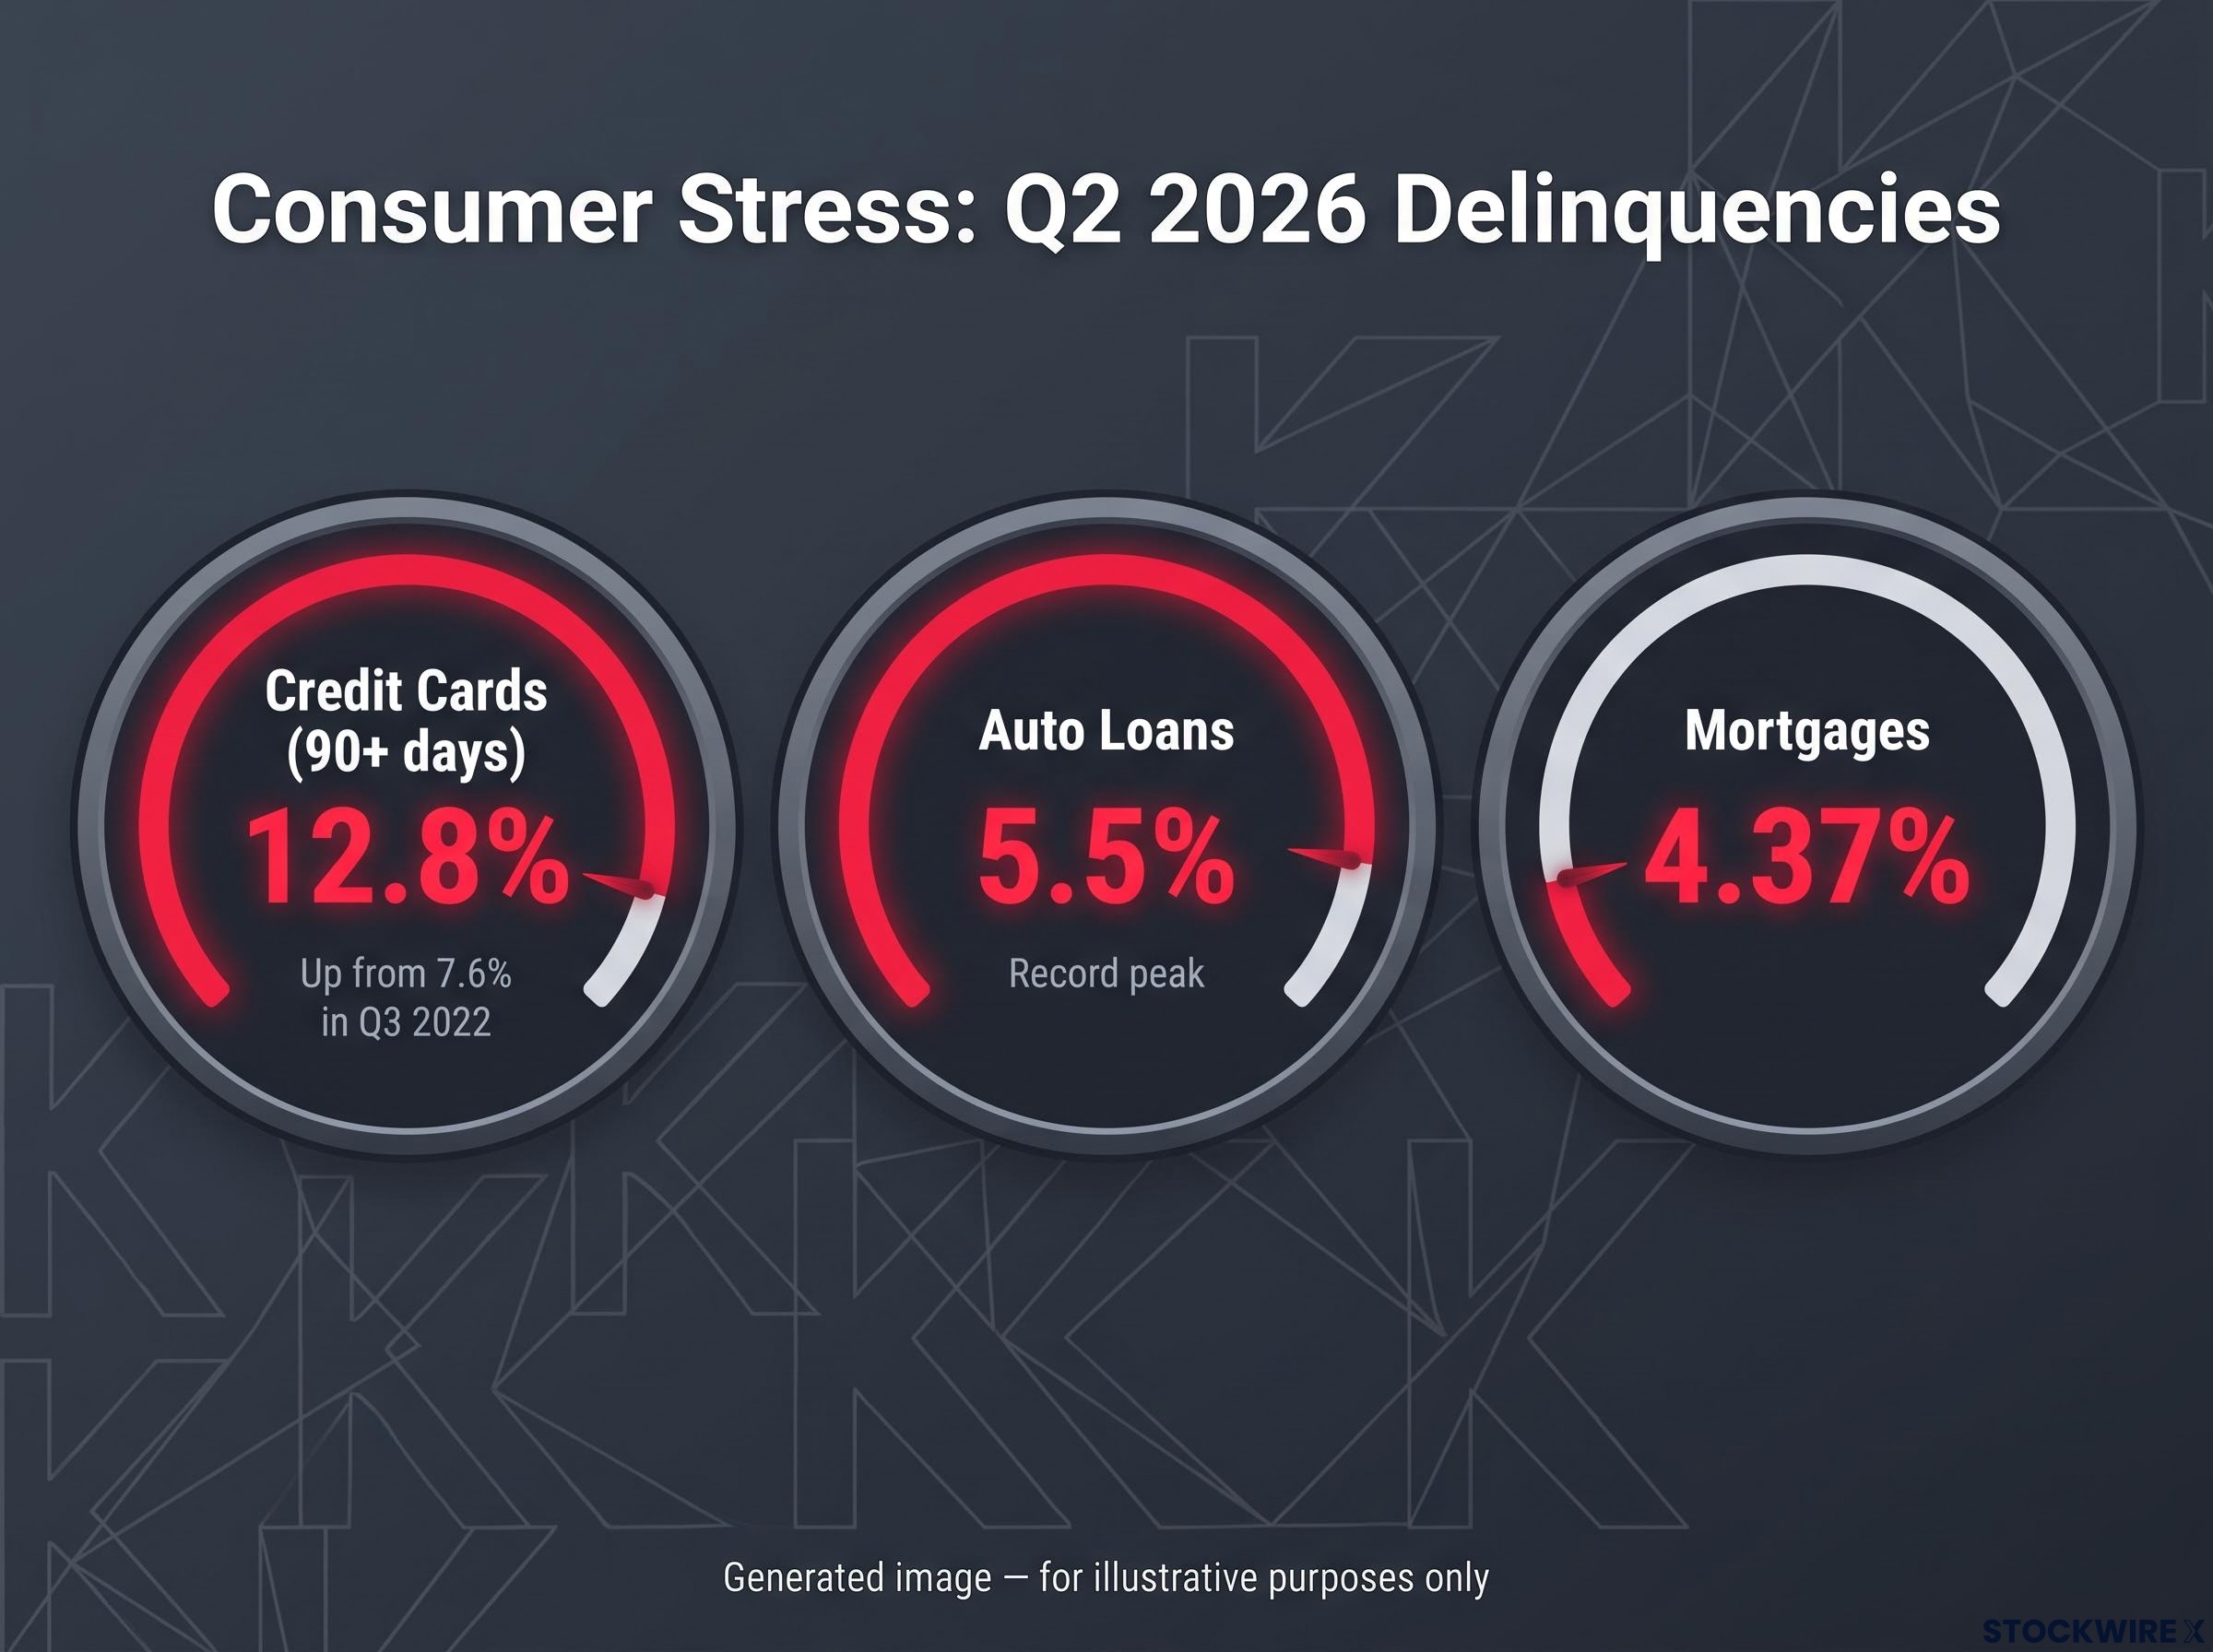
New York Fed Q2 2026 data shows a K-shaped strain, where upper-income households remain largely insulated while lower-income households are already in distress even at current rates:
The New York Fed Quarterly Report on Household Debt and Credit for Q2 2026 recorded aggregate delinquency rates with 4.7% of outstanding debt in some stage of delinquency, and noted rising early-delinquency transitions for both auto loans and mortgages, confirming the K-shaped strain the article describes.
- 90-plus day delinquent credit card balances at 12.8%, up from 7.6% in Q3 2022
- Auto loan delinquencies at a record 5.5% in Q2 2026, surpassing Great Recession peaks
- Mortgage delinquencies at 4.37% at the end of Q2 2026, per the Mortgage Bankers Association
Here is why that data does more than measure pain. Rate cuts would normally relieve this pressure. But if inflation has not returned to target, the Fed cannot cut aggressively without risking a second inflation wave. That leaves the long end of the curve without a natural ceiling from policy.
For you, the distinction is the whole game. If this is a temporary spike, patience is the right response. If it is a structural regime, the right response is a genuine portfolio adjustment. The delinquency data, combined with sticky inflation, tilts the odds toward regime rather than spike.
How a 6% yield transmits through every corner of the economy
Start with the number you feel most directly: your mortgage.
Thirty-year mortgages typically trade at a spread of 1.7-2.0 percentage points above the 10-year. At a 4.48% yield, that has historically meant a mortgage rate around 6.36%. A sustained 6% yield implies 30-year rates of roughly 7.7-8%. For a homebuyer, that is the difference between a house being affordable and being out of reach, and it is why housing activity slows sharply when the 10-year climbs.
The mortgage-to-Treasury spread has normalised from the historically wide 3.0 percentage points reached in 2022-2023 back to approximately 2.0 percentage points today, but that normalisation is cold comfort for buyers: at a 6% 10-year yield, even a 2.0-point spread produces a 30-year rate that erases the affordability calculations underlying most current purchase contracts.
A sustained 6% 10-year yield implies 30-year mortgage rates of roughly 7.7-8%.
The effect radiates outward from there. Corporate and municipal bonds price off the 10-year plus a credit spread, so a higher benchmark raises debt-service costs and lifts the hurdle rate for capital expenditure. Fewer projects clear that hurdle.
Equities feel it through valuation. The 10-year serves as the risk-free rate in discounted cash flow models, the standard method for valuing a company’s future earnings in today’s dollars. A shift from a 3-4% environment to a 5-6% one raises discount rates by 100-300 basis points, compressing price-to-earnings multiples close to one-for-one unless stronger growth offsets it.
Not everyone loses. Savers and retirees benefit, with sustained high rates reviving the certificate of deposit market and improving bank liquidity for lending.
| Asset Class | At 5% Yield | At 6% Yield | Key Impact |
|---|---|---|---|
| 30-year mortgages | ~6.7-7% | ~7.7-8% | Housing affordability strained sharply |
| Corporate bonds | 10-year + spread | Higher base + spread | Rising debt-service and capex hurdle rates |
| Equity discount rates | Base case | +100-300 bps | P/E multiples compress near one-for-one |
| Savings and CDs | Elevated | Higher still | Retirees and savers benefit |
Worth remembering: 30-year Treasuries once yielded roughly 14%. A 6% yield carries genuine shock value today, but it is historically moderate. For most readers who own a home or hold equities, a 6% yield is not a bond market abstraction. It is the mechanism that reprices your refinancing cost, your portfolio’s earnings multiple, and your savings rate all at once. That is what earns the 10-year its title as the world’s most important asset.
What stands between the current yield and 6%
The contrarian case deserves a stress test, and the countervailing forces are substantial.
- Yield-insensitive demand. CreditSights notes that a yield near 6% would look extraordinarily attractive relative to the past 15 years. Pension funds, insurers, and global investors would likely step in aggressively, acting as a natural circuit breaker that pulls yields back down.
- Fed easing and the recession loop. A sharp yield spike raises recession odds, and recessions historically trigger safe-haven flows into Treasuries that cap the long end. Vanguard projects policy rates in major developed markets settling between 2.25% and 3.75%.
- Foreign buying. NBER and Fed studies estimate a $100 billion foreign official purchase can reduce long-term yields by 13-68 basis points, with cumulative inflows historically depressing yields by 80-150 basis points. A re-acceleration of reserve accumulation could suppress yields meaningfully.
These are real. But read the sequencing carefully, because it changes everything.
Balancing the case: what the probabilities actually say
Kalshi pricing showed only a 32% probability for a 5.1% or higher outcome, so prediction markets are clearly not treating 6% as likely. Horowitz himself puts his call at roughly 50/50. Policy actors are attentive too: Treasury intervention in the bond market reportedly began around 19 August 2026, when the yield was still below 4.7%.
Here is the honest verdict. Six percent is not the base case. But the countervailing forces are conditional and reactive, not pre-installed. Institutional buying arrives after the spike. Foreign demand depends on geopolitical alignments that are themselves uncertain. Fed easing requires inflation to cooperate.
The ceiling on yields, in other words, lags the initial move. Even a 30-50% probability of a 6% yield is a scenario that warrants active attention. Treating it as purely theoretical carries its own risk, and that is exactly why positioning before a spike is more defensible than reacting during one.
Positioning your portfolio for a world where 6% is possible, not just theoretical
You do not need to bet on 6% arriving to prepare for it. The point is that being wrongly positioned in long-duration assets carries asymmetric downside, so the sensible posture performs across both the consensus and contrarian scenarios. Institutional managers are already deploying it.
- Manage duration. Managers at BlackRock, RBC, and Vanguard favour underweighting long-duration Treasuries and concentrating fixed income in the 3-to-7-year “belly” of the curve. This part offers the best trade-off between yield and sensitivity to term-premium expansion, capturing income without the price risk that hits the long end hardest.
- Build a barbell. Hold short-duration, high-quality fixed income for yield and capital preservation on one end, and selective defensive, dividend-producing equities that can tolerate elevated discount rates on the other.
- Anchor with cash. With policy rates projected at 2.25-3.75%, cash and short-term instruments serve as a low-volatility income anchor in the middle of that barbell.
- Hedge inflation. Treasury Inflation-Protected Securities (TIPS), government bonds whose value rises with inflation, guard against re-accelerating nominal yields driven by energy prices and structural pressures.
Managing duration exposure is not abstract: a bond fund with a duration of 17 loses approximately $85,000 on a $500,000 position from a single 1 percentage-point rate rise, compared to $30,000 for a duration-6 fund, which is why the 3-to-7-year belly of the curve represents a materially different risk profile than headline bond-fund labels suggest.
Set realistic expectations for the income side.
Vanguard projects 10-year annualised returns for U.S. bonds at 4.3-5.3%.
That projection matters because it reframes the goal. In a heavy-supply, elevated-term-premium regime, fixed-income returns come from yield and carry rather than duration-driven price gains. None of these moves is a speculative wager on 6%. They are rational hedges for an environment where the upside risk to yields is real and the cost of being caught long duration is steep, which makes this posture worth considering whether or not the contrarian call proves correct.
This article is for informational purposes only and should not be considered financial advice. Investors should conduct their own research and consult with financial professionals before making investment decisions. Past performance does not guarantee future results. Financial projections are subject to market conditions and various risk factors, and forward-looking scenarios are speculative and subject to change.
What a rate regime, not a rate spike, changes about long-term financial planning
The most useful question is not “will yields hit 6%?” It is “what if rates stay above 5% for years rather than months?” The duration of elevated rates matters as much as the level.
Recall that 30-year Treasuries once yielded roughly 14%. Measured against that history, a multi-year 5-6% environment is uncomfortable for the assumptions of the past decade and a half, but it is not aberrant. The zero-rate era was the anomaly. The 21% year-over-year jump in the yield shows how quickly the regime has already shifted.
The structural forces behind it are not a next-quarter problem. Deficits are driving federal debt toward 120% of GDP by 2036, term premium is normalising, and consumer stress is constraining the Fed’s ability to cut. None of that resolves soon.
So the shift this asks of you is not a single trade. It is a change in the mental model. The assumption that rates will drift back toward zero deserves to be retired. Any plan built on it, from mortgage timing to equity allocation to retirement income, deserves a second look. The real question is not only what to do if yields hit 6%, but what to do now that the era of cheap money looks structurally over.