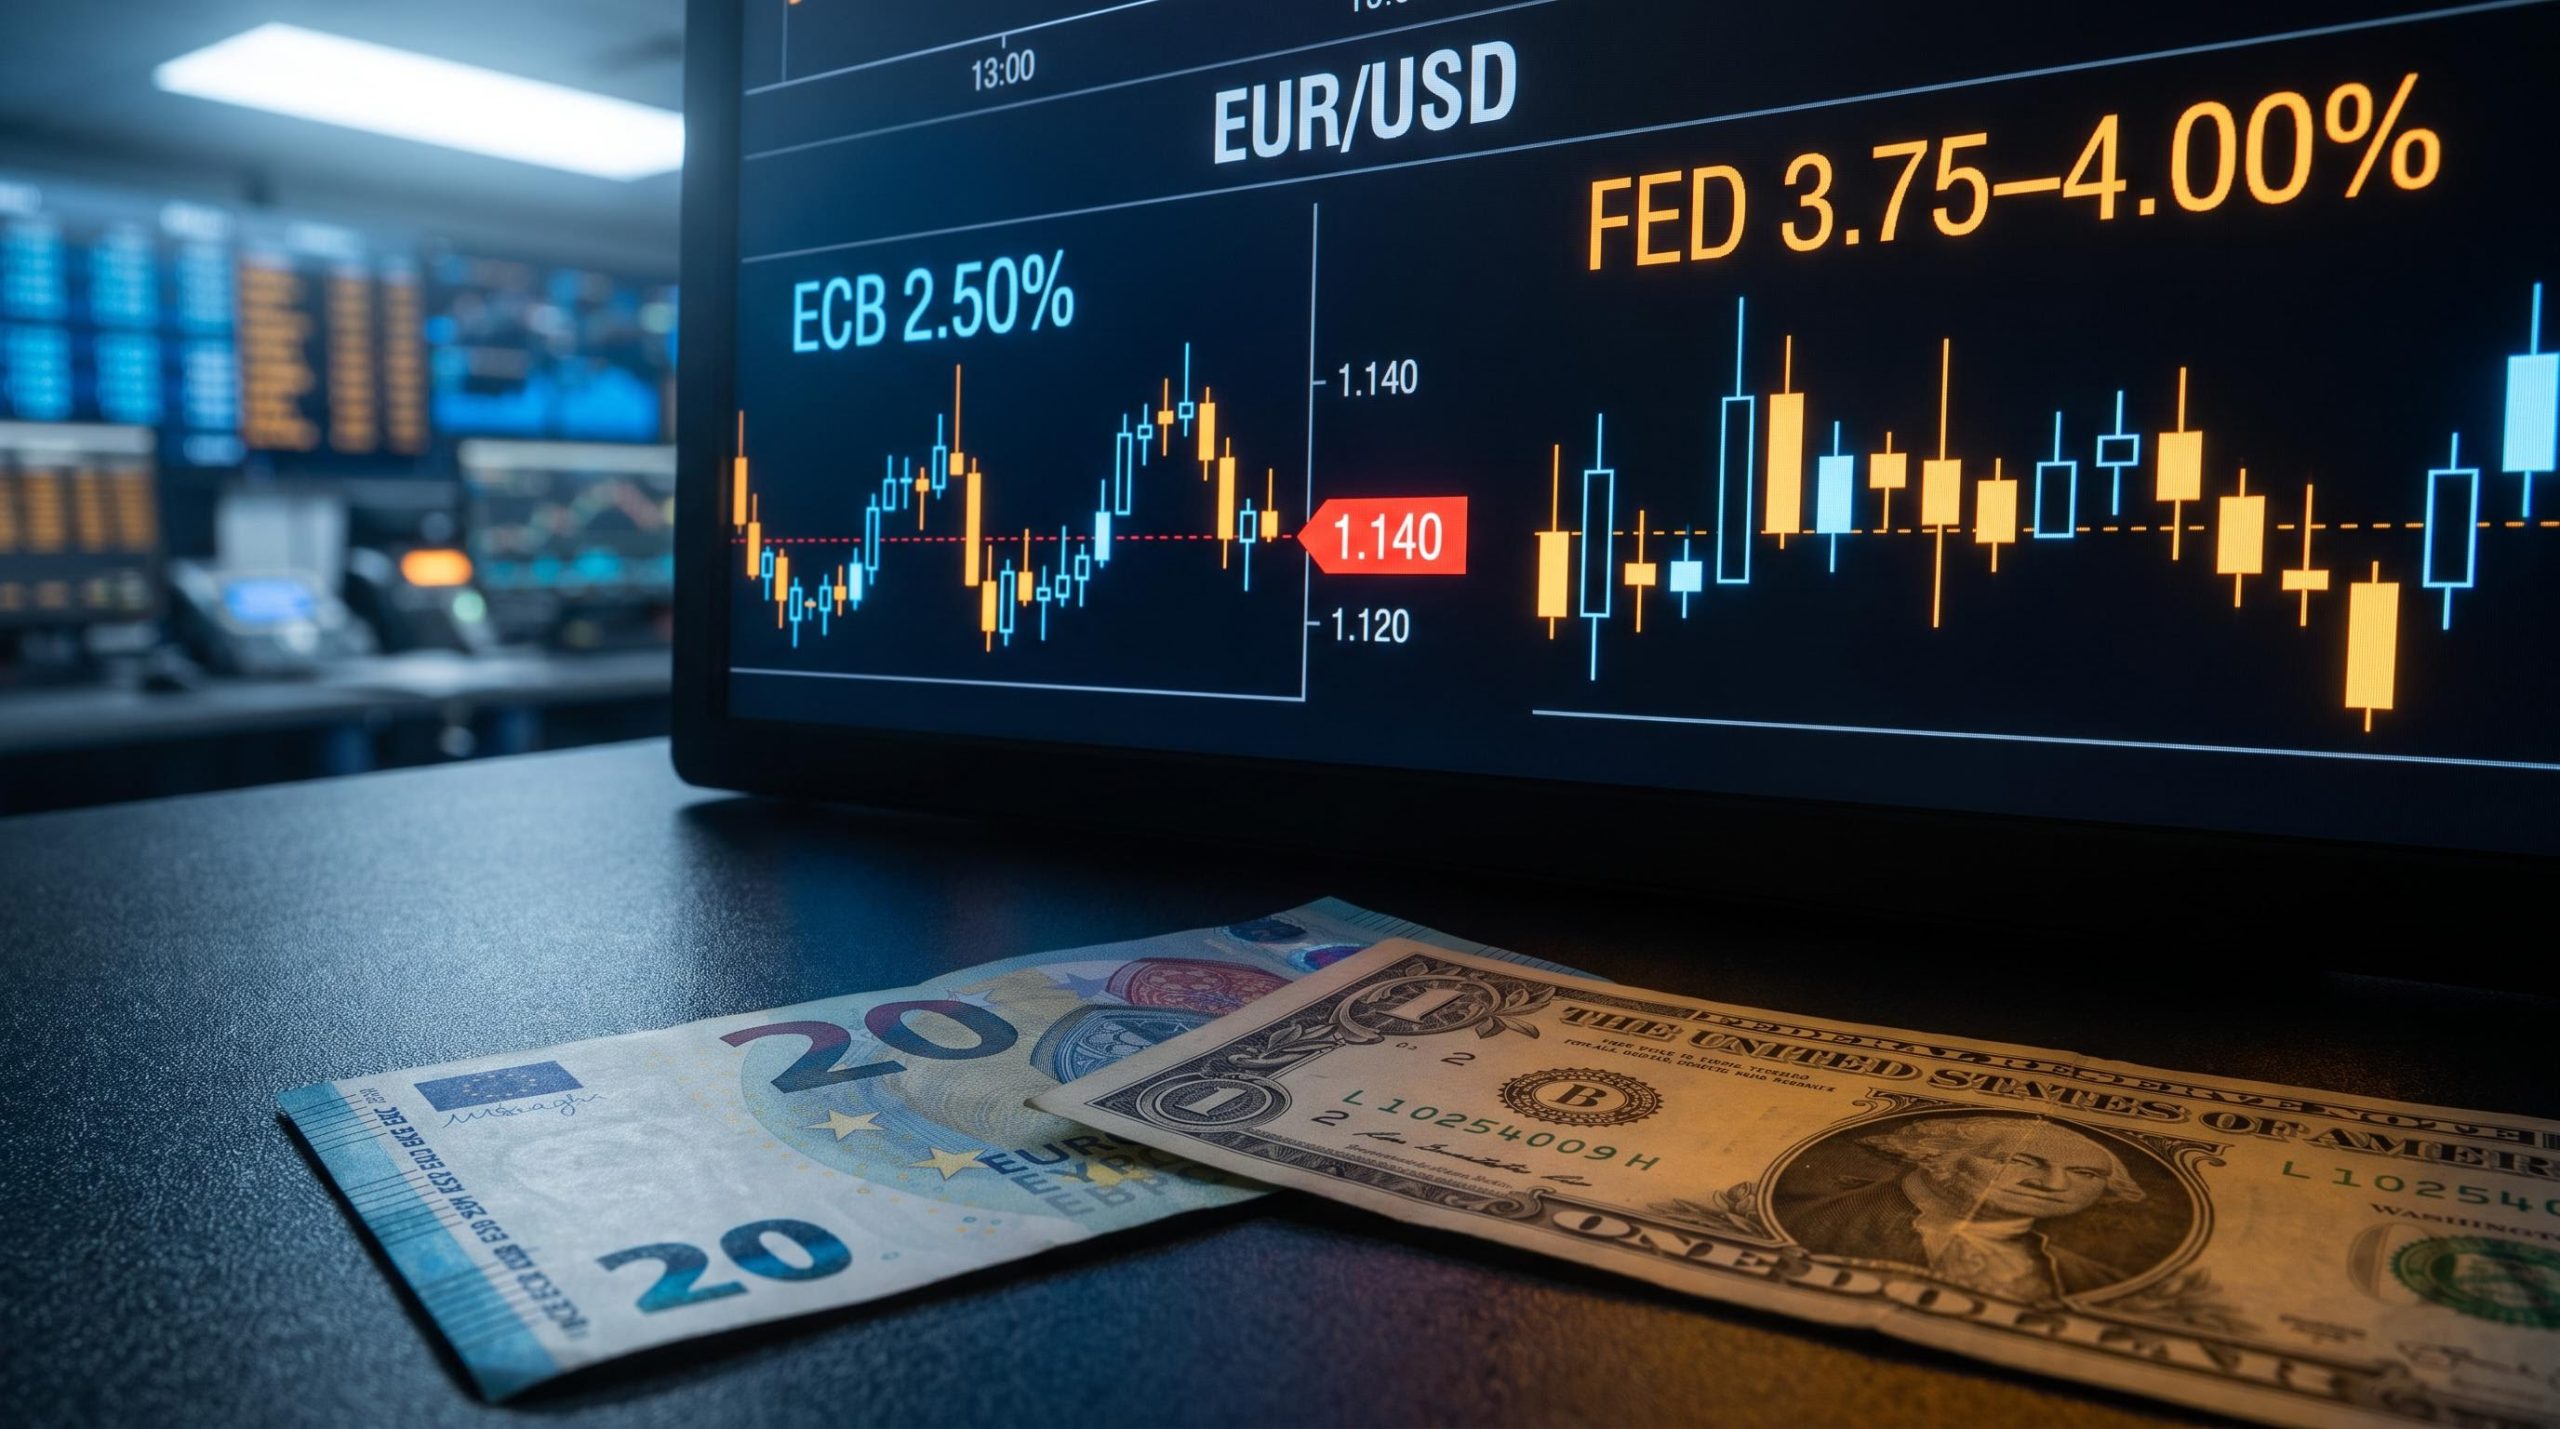
The US Dollar Index crossed above 100 this week for the first time in roughly seven weeks, a level markets treat as psychologically meaningful. What makes the move worth attention is not the number itself but what put it there: three separate forces arriving at the same trade at the same moment.
The Federal Reserve has restarted a hiking cycle markets had written off. A Middle East risk premium is layering safe-haven demand on top of that shift. And the technical structure has flipped constructive, drawing momentum capital toward the breakout. These are three distinct market logics, and right now they all point the same way.
This is not a routine confluence. When yield fundamentals, geopolitical fear, and chart momentum align, the combined signal is stronger than any one driver alone. What follows here maps exactly which variables are doing the work, where price faces its next tests, and what conditions would have to change for the rally to stall. Treat it as an analytical map, not a forecast.
The Fed’s September decision changed the rate calculus for the dollar
To understand why the dollar’s floor has moved, you have to read the last three months as a sequence rather than a single event.
In June 2026, the Federal Open Market Committee (FOMC) held rates steady at 3.50-3.75% but removed its prior outlook for a rate cut, signalling that a hike was back on the table. That was the setup.
The confirmation came on 16 September 2026. The Fed unanimously voted 12-0 to raise the federal funds target range by 25 basis points to 3.75-4.00%, the first hike since July 2023. A cycle markets had considered finished was live again.
The forward signal mattered more than the hike itself. The dot-plot median rose to 4.1% for year-end 2026, up 30 basis points from June’s 3.8% projection. The dot plot is the chart of where individual Fed officials expect rates to sit, and this shift implies at least one more hike before year-end, with the October and December meetings as the candidates.
Forward guidance mechanics mattered more than the hike itself in September 2026 because the 25 basis-point move was priced in at near-certainty odds before the meeting, meaning the dot-plot revision and Warsh’s press conference language carried the real information content that repositioned dollar flows.
That 30-basis-point revision is not a technical footnote. It tells you the Fed’s own collective forecast turned materially hawkish in three months, and that repricing is what is rebuilding the interest rate differential, the gap between US yields and those elsewhere, that had been suppressing the dollar since late 2024.
Fed Chair Kevin Warsh made the reasoning plain at the post-meeting press conference.
Inflation “remains excessively elevated and has persisted at high levels for an extended period,” said Kevin Warsh, Federal Reserve Chair.
UOB Group has translated the policy shift into its forecasts. The bank now expects two additional Fed rate hikes going forward and identifies upside risks to its USD projections against both G-10 and Asian currency pairs, citing the reversal of the rate-differential headwind that had weighed on the index.
| Policy element | June 2026 | September 2026 |
|---|---|---|
| Fed funds target range | 3.50-3.75% (held) | 3.75-4.00% (hiked) |
| Dot-plot median, year-end | 3.8% | 4.1% |
| Forward guidance | Cut outlook removed; hike possible | One further hike signalled |
For anyone holding international assets or currency-exposed positions, the distinction here is the whole point. A structural shift in the rate differential is a sustained trend, not a short-term spike, and reading it correctly changes how you weigh the dollar’s staying power.
When big ASX news breaks, our subscribers know first
What safe-haven demand actually means when geopolitical risk overlaps with a hiking cycle
The rate story explains the floor. Geopolitics explains why the dollar pushed through it this week.
Two specific events sit behind the move. Iran’s Islamic Revolutionary Guard Corps (IRGC) reported striking a Togo-flagged oil tanker over a rumoured unauthorised transit through the Strait of Hormuz. Separately, US President Donald Trump signalled he was nearing a decision on the potential resumption of large-scale military operations against Iran.
The Strait of Hormuz is the chokepoint through which a large share of the world’s seaborne oil passes, which is why threats to it move markets so quickly. Reuters described the dollar as “girded by bets” on the hiking cycle, with equity weakness coinciding with the push to multi-week highs.
How the two-stage transmission mechanism works in practice
The link from conflict to dollar strength runs through a specific causal chain, and it helps to break it into two stages.
Stage one is about oil and yields. Conflict raises the risk of supply disruption, which pushes crude prices higher. Higher oil feeds inflation expectations, and markets respond by driving up nominal US Treasury yields as they price in more tightening.
Stage two is about flows. Elevated yields make dollar assets more attractive relative to lower-yielding alternatives. At the same time, conflict-driven volatility weakens risk appetite, sending capital toward the dollar and Treasuries as safe-haven liquidity.
What makes this moment potent is that both stages currently push in the same direction. Geopolitical risk is amplifying an existing fundamental story about higher US yields rather than acting as a standalone driver, which is why the combined signal reads stronger than either factor on its own.
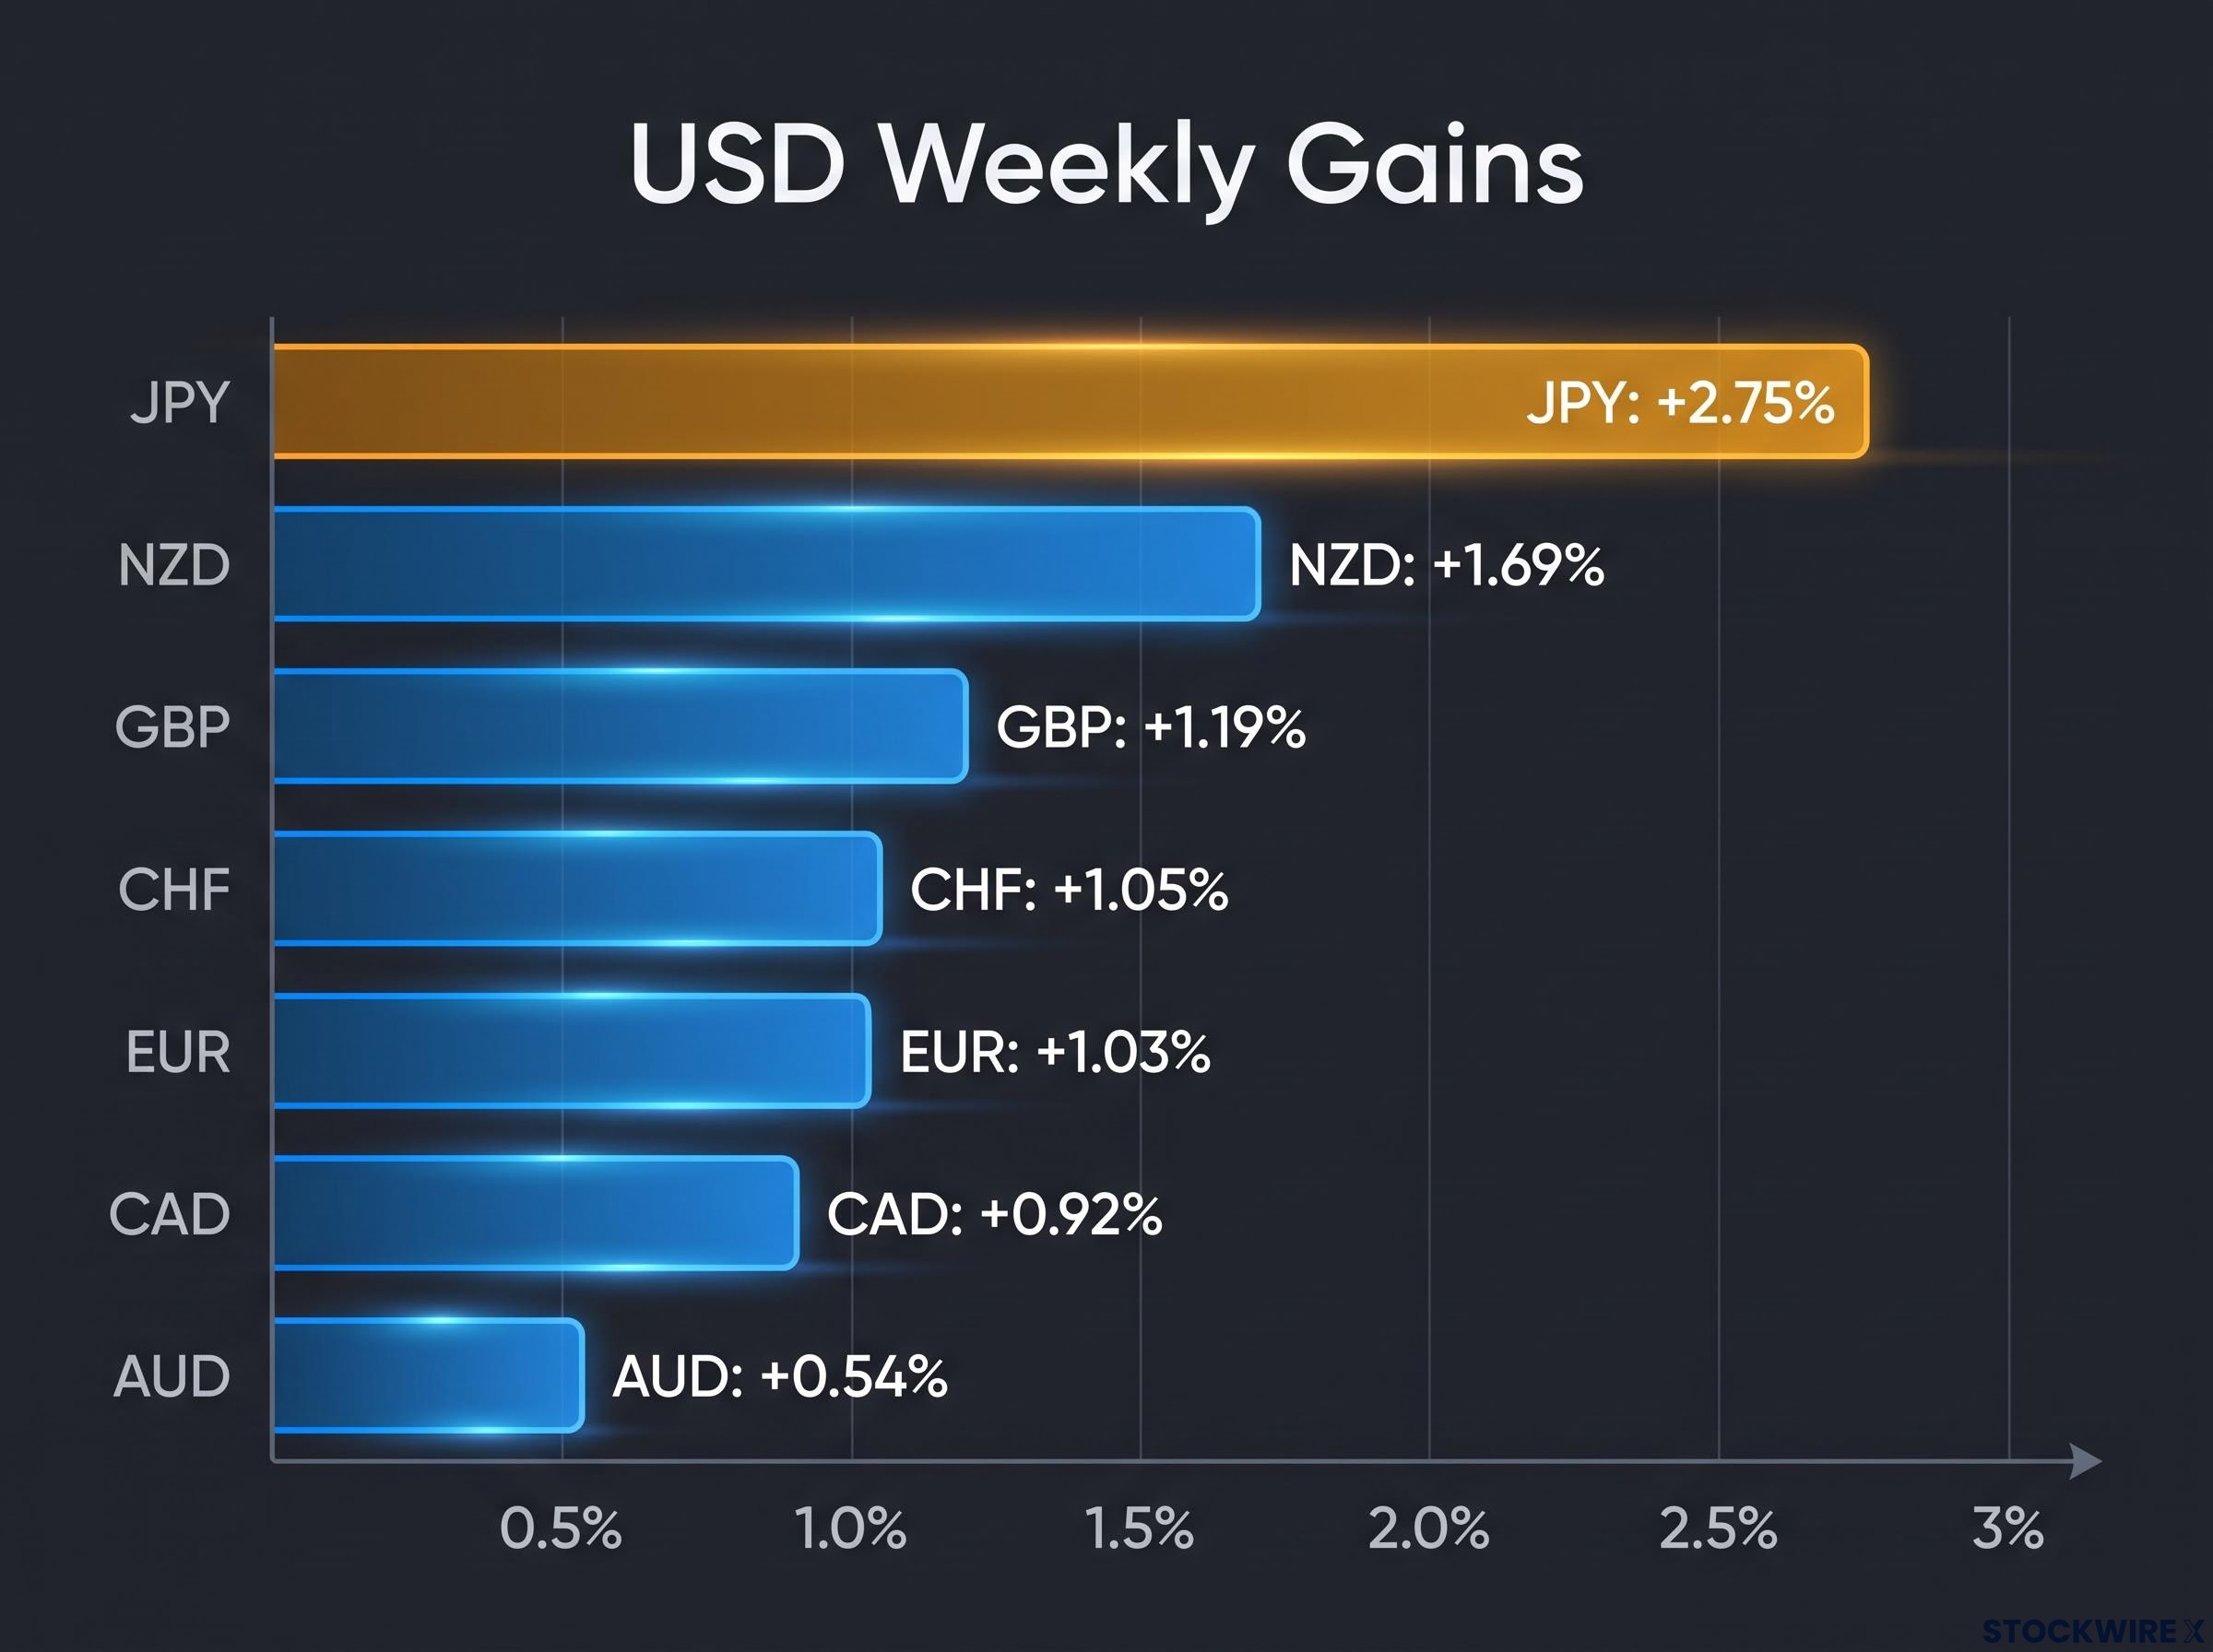
The cross-currency data confirms the pattern. Over the week, the USD outperformed every major currency, with the breadth of the move telling you this is a genuine risk-off rotation rather than a set of one-off currency quirks.
Risk-off rotation drives capital into dollar assets through two distinct channels: first, elevated Treasury yields raise the return on dollar-denominated holdings, and second, conflict-driven volatility triggers a flight to USD liquidity that is independent of yield levels entirely, which is why the yen took the sharpest weekly loss while commodity currencies softened across the board.
- JPY: USD gained approximately 2.75%, its strongest weekly move
- NZD: +1.69%
- GBP: +1.19%
- CHF: +1.05%
- EUR: +1.03%
- CAD: +0.92%
- AUD: +0.54%
The yen, a funding and low-yield currency, took the hardest hit, while commodity and higher-beta currencies softened across the board. That spread is the tell.
For anyone with exposure to international equities, emerging market assets, or commodity-linked currencies, the practical read is this: the risk premium is not priced in isolation. It is reinforcing a yield-driven move, which means both triggers would need to reverse together for the dollar to hand back recent gains.
Where the DXY technical picture says the rally faces its next real tests
The fundamentals set the direction. The chart tells you where that direction gets tested, and those levels are worth watching yourself rather than waiting for someone to interpret them for you.
Start with the bias. The index is trading above its 100-day Exponential Moving Average (EMA), a moving average that weights recent prices more heavily, and it has reclaimed the 50.0% Fibonacci retracement level. Fibonacci retracements are horizontal levels traders use to mark where a price move might pause or reverse. Together, these two features define a constructive floor for the current rally, with the index near 100.30.
Above current price sits the resistance ladder. Clearing each rung would signal that momentum is genuinely behind the move rather than fading.
| Level type | Price level | Significance |
|---|---|---|
| Resistance (61.8% Fib) | ~100.57 | Immediate barrier; first upside test |
| Resistance (78.6% Fib) | ~101.12 | Stronger barrier above |
| Cycle peak | 101.82 | Medium-term ceiling |
| Support (50.0% Fib) | 100.18 | First level to watch below |
| Support (38.2% Fib / 100-day EMA) | 99.80 / 99.69 | Key structural cluster |
Below that cluster, deeper demand sits at 99.32 and around 98.55, the structural low.
The zone that matters most The support cluster between 99.69 (the 100-day EMA) and 99.80 (the 38.2% Fibonacci retracement) is where the 100-day EMA and Fibonacci support converge. A daily close below this band would invalidate the bullish bias and open the way to a re-test of the structural low near 98.55.
That cluster is the line between trend resumption and failed breakout. It tells you whether the fundamental story is holding on the chart or quietly deteriorating.
For anyone tracking currency-sensitive positions, these levels give you concrete reference points. You do not need a trading background to watch whether price holds above 99.69 or clears 100.57; those two numbers tell you most of what you need to know about whether the move is real.
What would have to change for this dollar rally to stall
A rally built on three pillars is only as durable as its weakest one. Stress-testing each in turn tells you which variable to watch most closely, and why the durability here is conditional rather than guaranteed.
- Fed policy risk. A softer inflation or growth print before October could prompt the FOMC to delay the signalled additional hike. And if the European Central Bank (ECB) or Bank of Japan tighten more aggressively, the US yield advantage doing much of the rate-differential work could narrow faster than the dot plot implies.
Central bank divergence is the mechanism that gives the current Fed-versus-ECB and Fed-versus-BoJ rate gap its directional force; historical episodes, including the 2014-2015 cycle that produced a roughly 22% euro decline over seven months, show that the trajectory of the gap matters more than its absolute size in determining how far a currency move extends.
- Geopolitical de-escalation. Any ceasefire signal, de-escalation, or material retreat in oil prices would strip out the safe-haven premium currently embedded in dollar flows. That removes one of the two reinforcing forces without any change in Fed policy at all.
- Technical reversal. A failure to hold the 99.69-99.80 cluster, or a rejection from 100.57, would shift momentum-following capital from long to neutral, raising the risk of a crowded-trade unwind if consensus on dollar strength becomes too one-sided.
Here the scale of the move reframes the risk. Over the past four weeks the index has gained only approximately 0.17%, against roughly 3.03% over twelve months.
That modest four-week figure is the detail that changes the picture. This is not a market that has over-extended on dollar strength, which means the likely downside is a controlled retracement rather than a disorderly unwind, provided the Fed does not pivot sharply.
History rhymes here. In 2022, aggressive Fed hikes combined with the Russia-Ukraine war drove the index to a cycle peak before it retraced once markets grew confident the tightening was ending. Mid-2010s hiking cycles paired with Middle East oil shocks followed a similar arc: pronounced strength, then reversal as policy differentials narrowed.
The technical conditions that would signal a trend reversal
Two signals are specific enough to monitor without guesswork.
A daily close below the 99.69-99.80 support cluster invalidates the bullish bias outright. A rejection from 100.57 on high volume would invite profit-taking near resistance.
Neither is a prediction. Both are observable events you can watch for in real time, which is exactly what makes them useful.
The single scenario that removes the structural support fastest is markets beginning to price Fed rate cuts before the additional hike is delivered. That is the one to weigh most heavily.
What this convergence of drivers tells you about where to focus attention now
Pull the three threads together and a hierarchy emerges. The Fed rate differential is the structural floor. Geopolitical risk is the amplifier. The technical break above 100 is the momentum confirmation.
The three-pillar hierarchy Fed policy is the structural floor; Middle East risk is the amplifier; the break above 100 is the momentum confirmation. All three currently point the same way, which is what makes the setup analytically significant.

The key insight is that the pillars are not equal in durability. The policy pillar is structural but has a defined shelf life tied to the October-December FOMC calendar. Geopolitics is conditional and can reverse on a single headline.
That places the October FOMC meeting as the next real decision point. The dot plot’s implied additional hike either gets confirmed or called into question by incoming data, which makes the October Consumer Price Index (CPI) and Personal Consumption Expenditures (PCE) inflation readings the most forward-looking variables for dollar direction. UOB Group’s flagged upside risks against G-10 and Asian pairs give that structural view institutional corroboration.
Policy rate transmission is the upstream variable connecting the FOMC calendar to dollar direction, Treasury yields, and equity valuations simultaneously; a single dot-plot revision can reprice all three asset classes before the first additional basis point is actually delivered, which is why the October CPI and PCE prints carry so much forward weight for the dollar’s next leg.
The actionable takeaway: the index’s near-term direction hinges more on whether US inflation data validates the hawkish dot plot than on geopolitics alone. If you are weighing international equity or fixed-income exposure over the next quarter, the window for dollar outperformance is probably measured in weeks to months rather than something open-ended, because prior hiking-plus-geopolitical episodes ran until the Fed neared its terminal rate. This cycle is not there yet.
Three specific things to watch:
- October CPI and PCE releases relative to Fed expectations
- The October FOMC outcome, and whether the signalled hike lands
- DXY price action at 100.57, the technical read on institutional momentum
This article is for informational purposes only and should not be considered financial advice. Investors should conduct their own research and consult with financial professionals before making investment decisions. Past performance does not guarantee future results. Financial projections are subject to market conditions and various risk factors, and forward-looking statements are speculative and subject to change based on market developments.