
#
The wheel strategy carries a paradox that trips up more traders than any single mechanical mistake. It is built explicitly to lower the price you paid for a stock, cycle after cycle, credit after credit. Yet lowering that number does almost nothing to reduce how much of the stock’s downside you are actually carrying.
Retail interest in options has stayed elevated since the pandemic. According to NYSE Data Insights, retail participation in the U.S. options market peaked at roughly 48% in July 2022 and sat around 45% in July 2023, driven by zero-commission apps and easier access. The wheel is one of the strategies that ride this wave, and its appeal, systematic premium income and a steadily falling cost basis, is real. It is also incomplete without understanding what the strategy structurally cannot do.
NYSE Data Insights on options market trends shows retail participation climbing sharply through the post-pandemic period, with zero-commission platforms lowering the barrier to options trading for individual investors who previously relied on equity-only accounts.
How the wheel actually works, step by step
The wheel is a two-leg cycle, and the order matters. It starts with a short put, then transitions into covered calls, then loops. Watching it assemble piece by piece is the only way to see why the arithmetic works the way it does.
Leg one is selling a put. You sell an out-of-the-money put, meaning the strike sits below the current stock price, and you collect a premium the moment the trade fills. That premium is yours whether or not you ever buy the shares.
Cash-secured puts are the structural foundation of the wheel’s first leg: you reserve the capital required to buy 100 shares, sell the put against that reserved cash, and collect premium while waiting for your conviction price to arrive.
Take a stock trading at $100. You sell a $97 strike put and collect $1.00 in premium. If the stock stays above $97, the put expires worthless and you keep the credit. If it drops below $97, you are assigned: you buy 100 shares per contract at $97, but the $1.00 you collected means your effective cost basis is $96.00, not $97.
Assignment is where the strategy shifts gears, and the shift is automatic.
When big ASX news breaks, our subscribers know first
From assignment to covered calls: what the transition looks like
At assignment, the short put disappears from your account and is replaced by long shares, typically processed over the weekend before Monday. You now own 100 shares per contract at the strike price, net of the premium you already banked.
Those shares are the collateral for the next leg. Because you own them outright, you can immediately begin selling covered calls against them, which is exactly where leg two of the wheel begins.
Now the cost basis starts falling. You sell a covered call for $0.75, then buy it back before expiration for $0.20, keeping a net credit of $0.55. That comes straight off your basis, dropping it from $96.00 to $95.45. Repeat with a second call sold for $0.60 and closed for $0.15, a net credit of $0.45, and your basis falls again to $95.00.
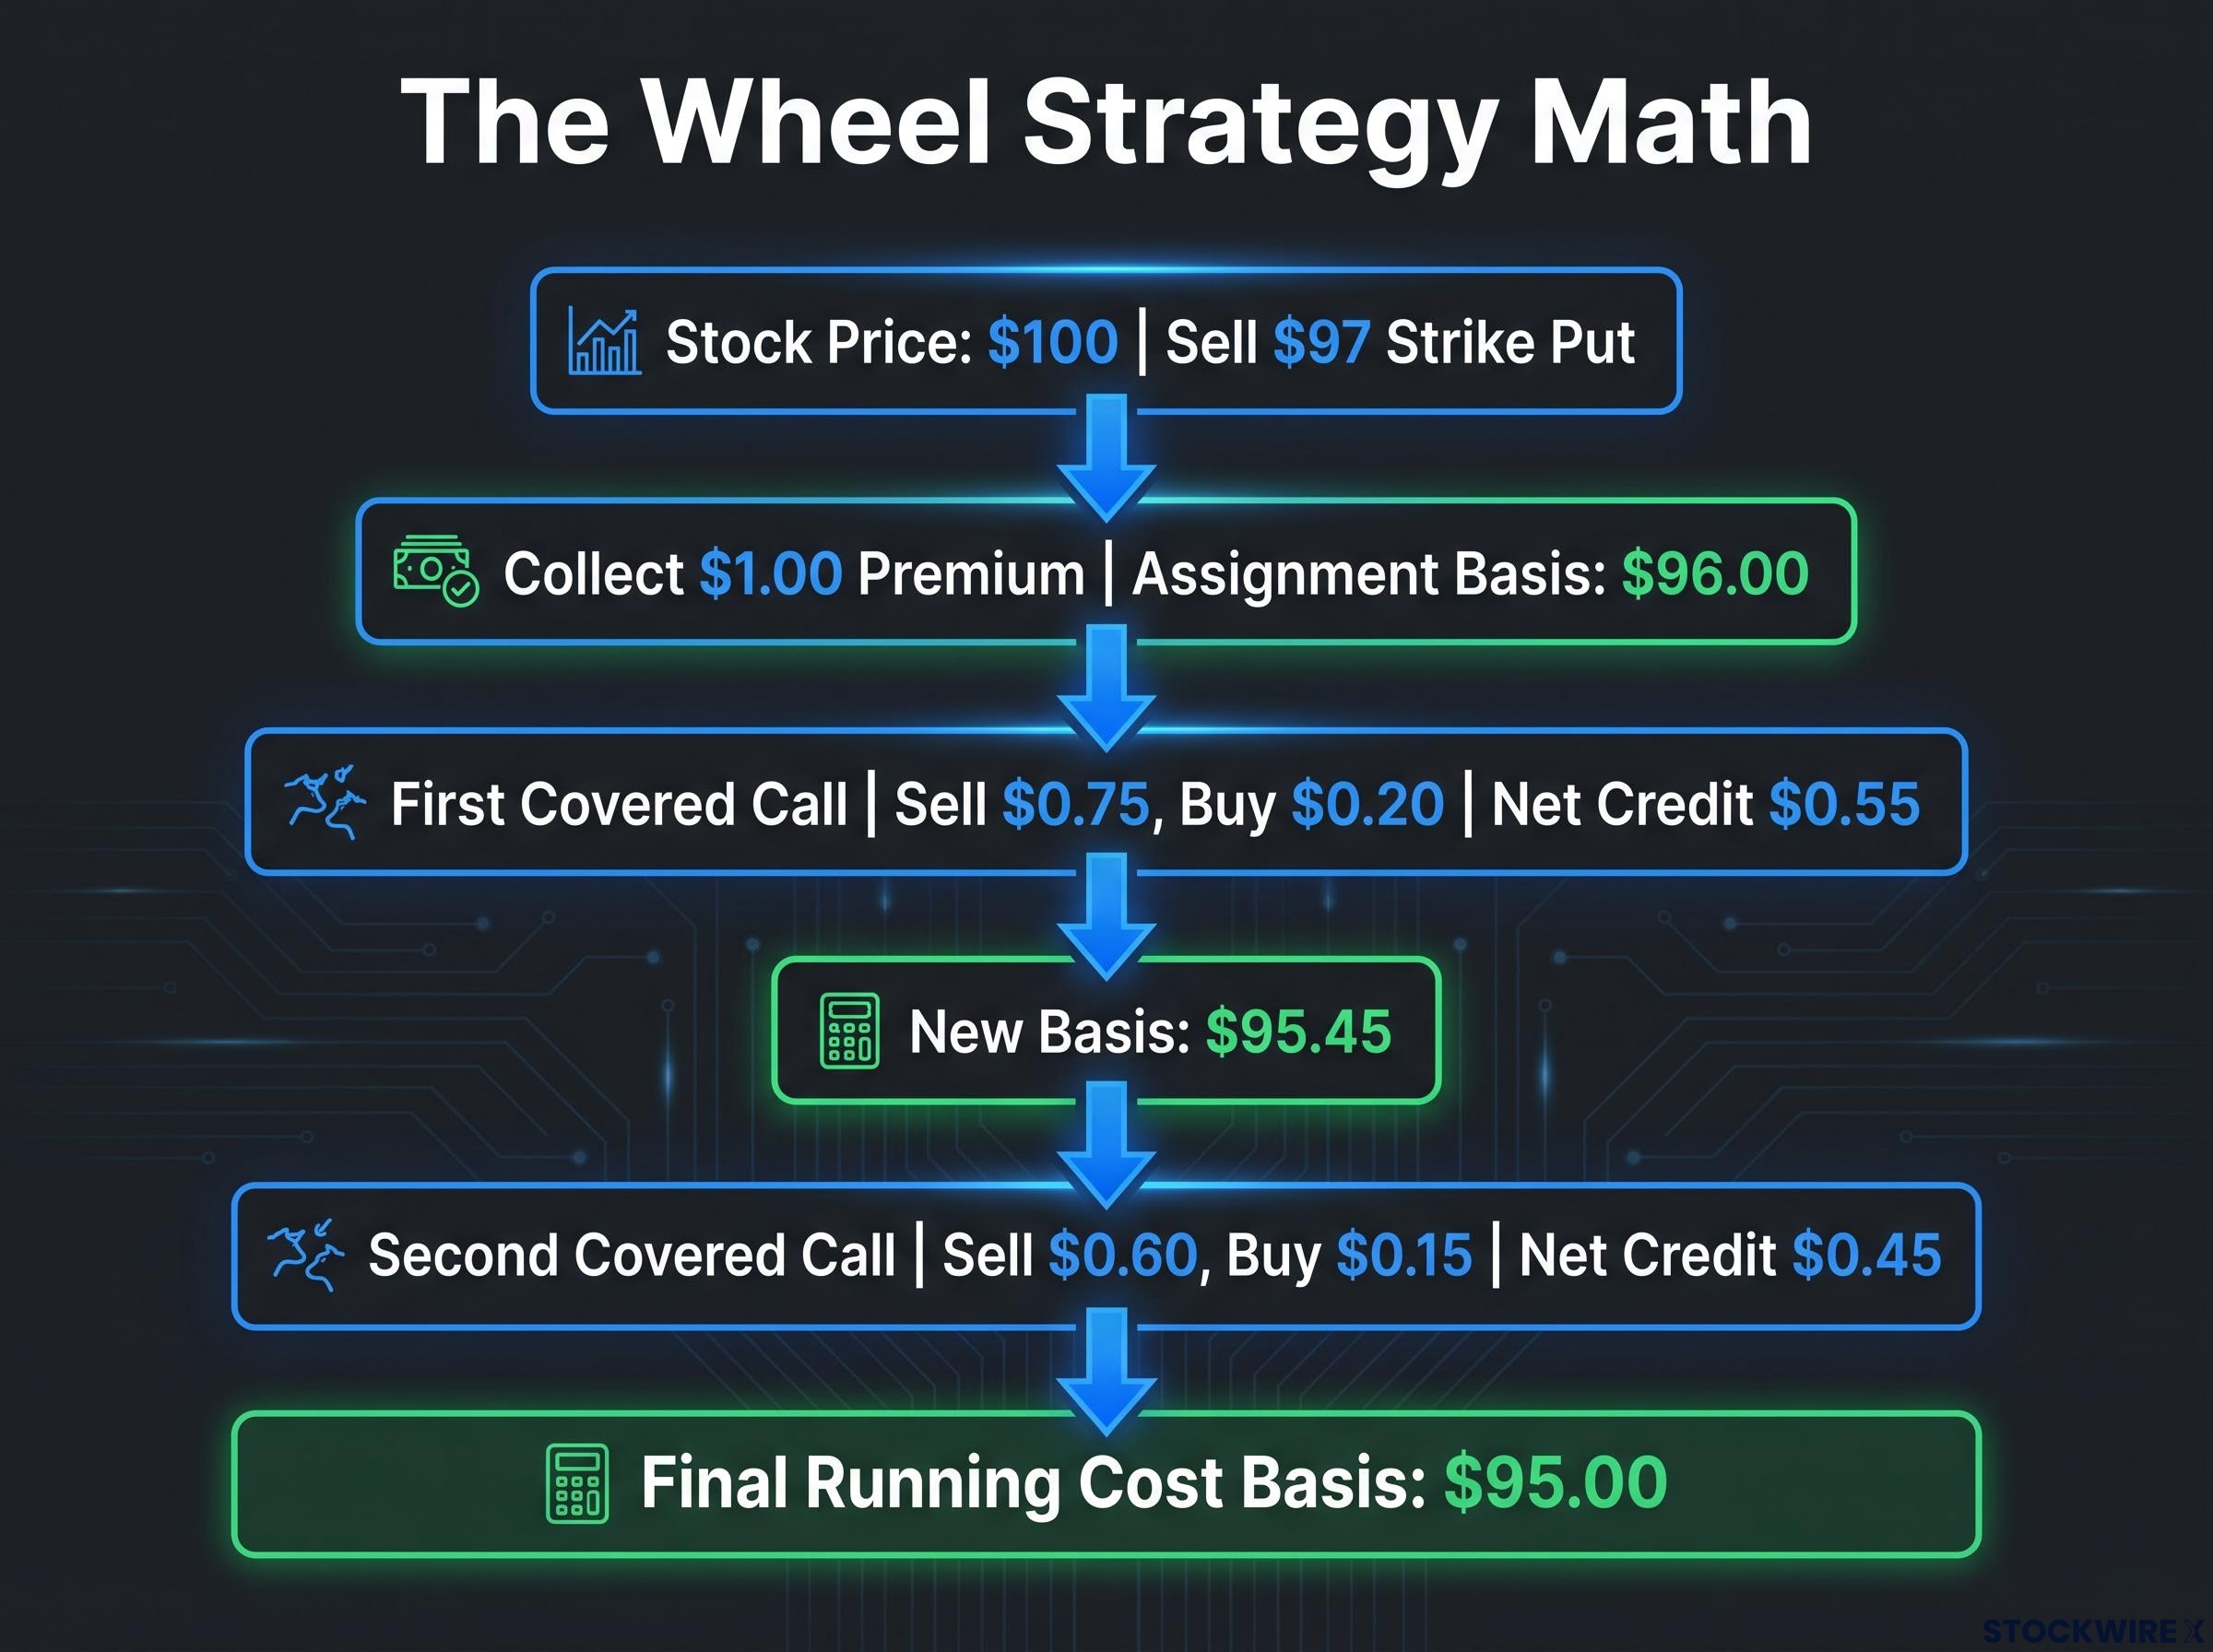
| Cycle / Action | Premium Collected | Premium Paid to Close | Net Credit | Running Cost Basis |
|---|---|---|---|---|
| Short put assigned ($97 strike) | $1.00 | – | $1.00 | $96.00 |
| First covered call | $0.75 | $0.20 | $0.55 | $95.45 |
| Second covered call | $0.60 | $0.15 | $0.45 | $95.00 |
Each covered call cycle runs over a few weeks and repeats month after month. Here is the sequence inside a single cycle:
- Open the call by selling it and collecting the premium.
- Monitor the position as it decays.
- Close it before expiration to capture most of the premium.
- Calculate the net credit (premium received minus premium paid to close).
- Subtract that net credit from your running cost basis.
Calls are usually closed early rather than held to assignment, so you capture partial premium and reset the cycle rather than surrendering the shares. Drop your own strikes and premiums into this template, and you can see your adjusted basis after two or three cycles before you place a single trade.
What the wheel cannot do, and why that matters
Here is the mental model most retail traders start with: the wheel is an income strategy that reduces risk. Here is the model you should leave with. The wheel is a structured way of owning stock with modest premium enhancement, and it does not reduce your equity exposure at all.
That distinction is the whole game. The premium you collect is a buffer against small moves, not a hedge against large ones.
The core reframe Tastytrade’s Tom Sosnoff and Tony Battista frame the wheel as short puts plus covered calls that leave your equity risk “unchanged versus owning the stock outright.” The premium is simply a small cushion, not protection.
Two tradeoffs follow directly from that. On the upside, covered calls cap your participation, so a strong rally leaves you selling shares away right as the gains accelerate. On the downside, you are effectively long stock the whole way down, and the premiums you have banked provide only partial relief against a sustained fall.
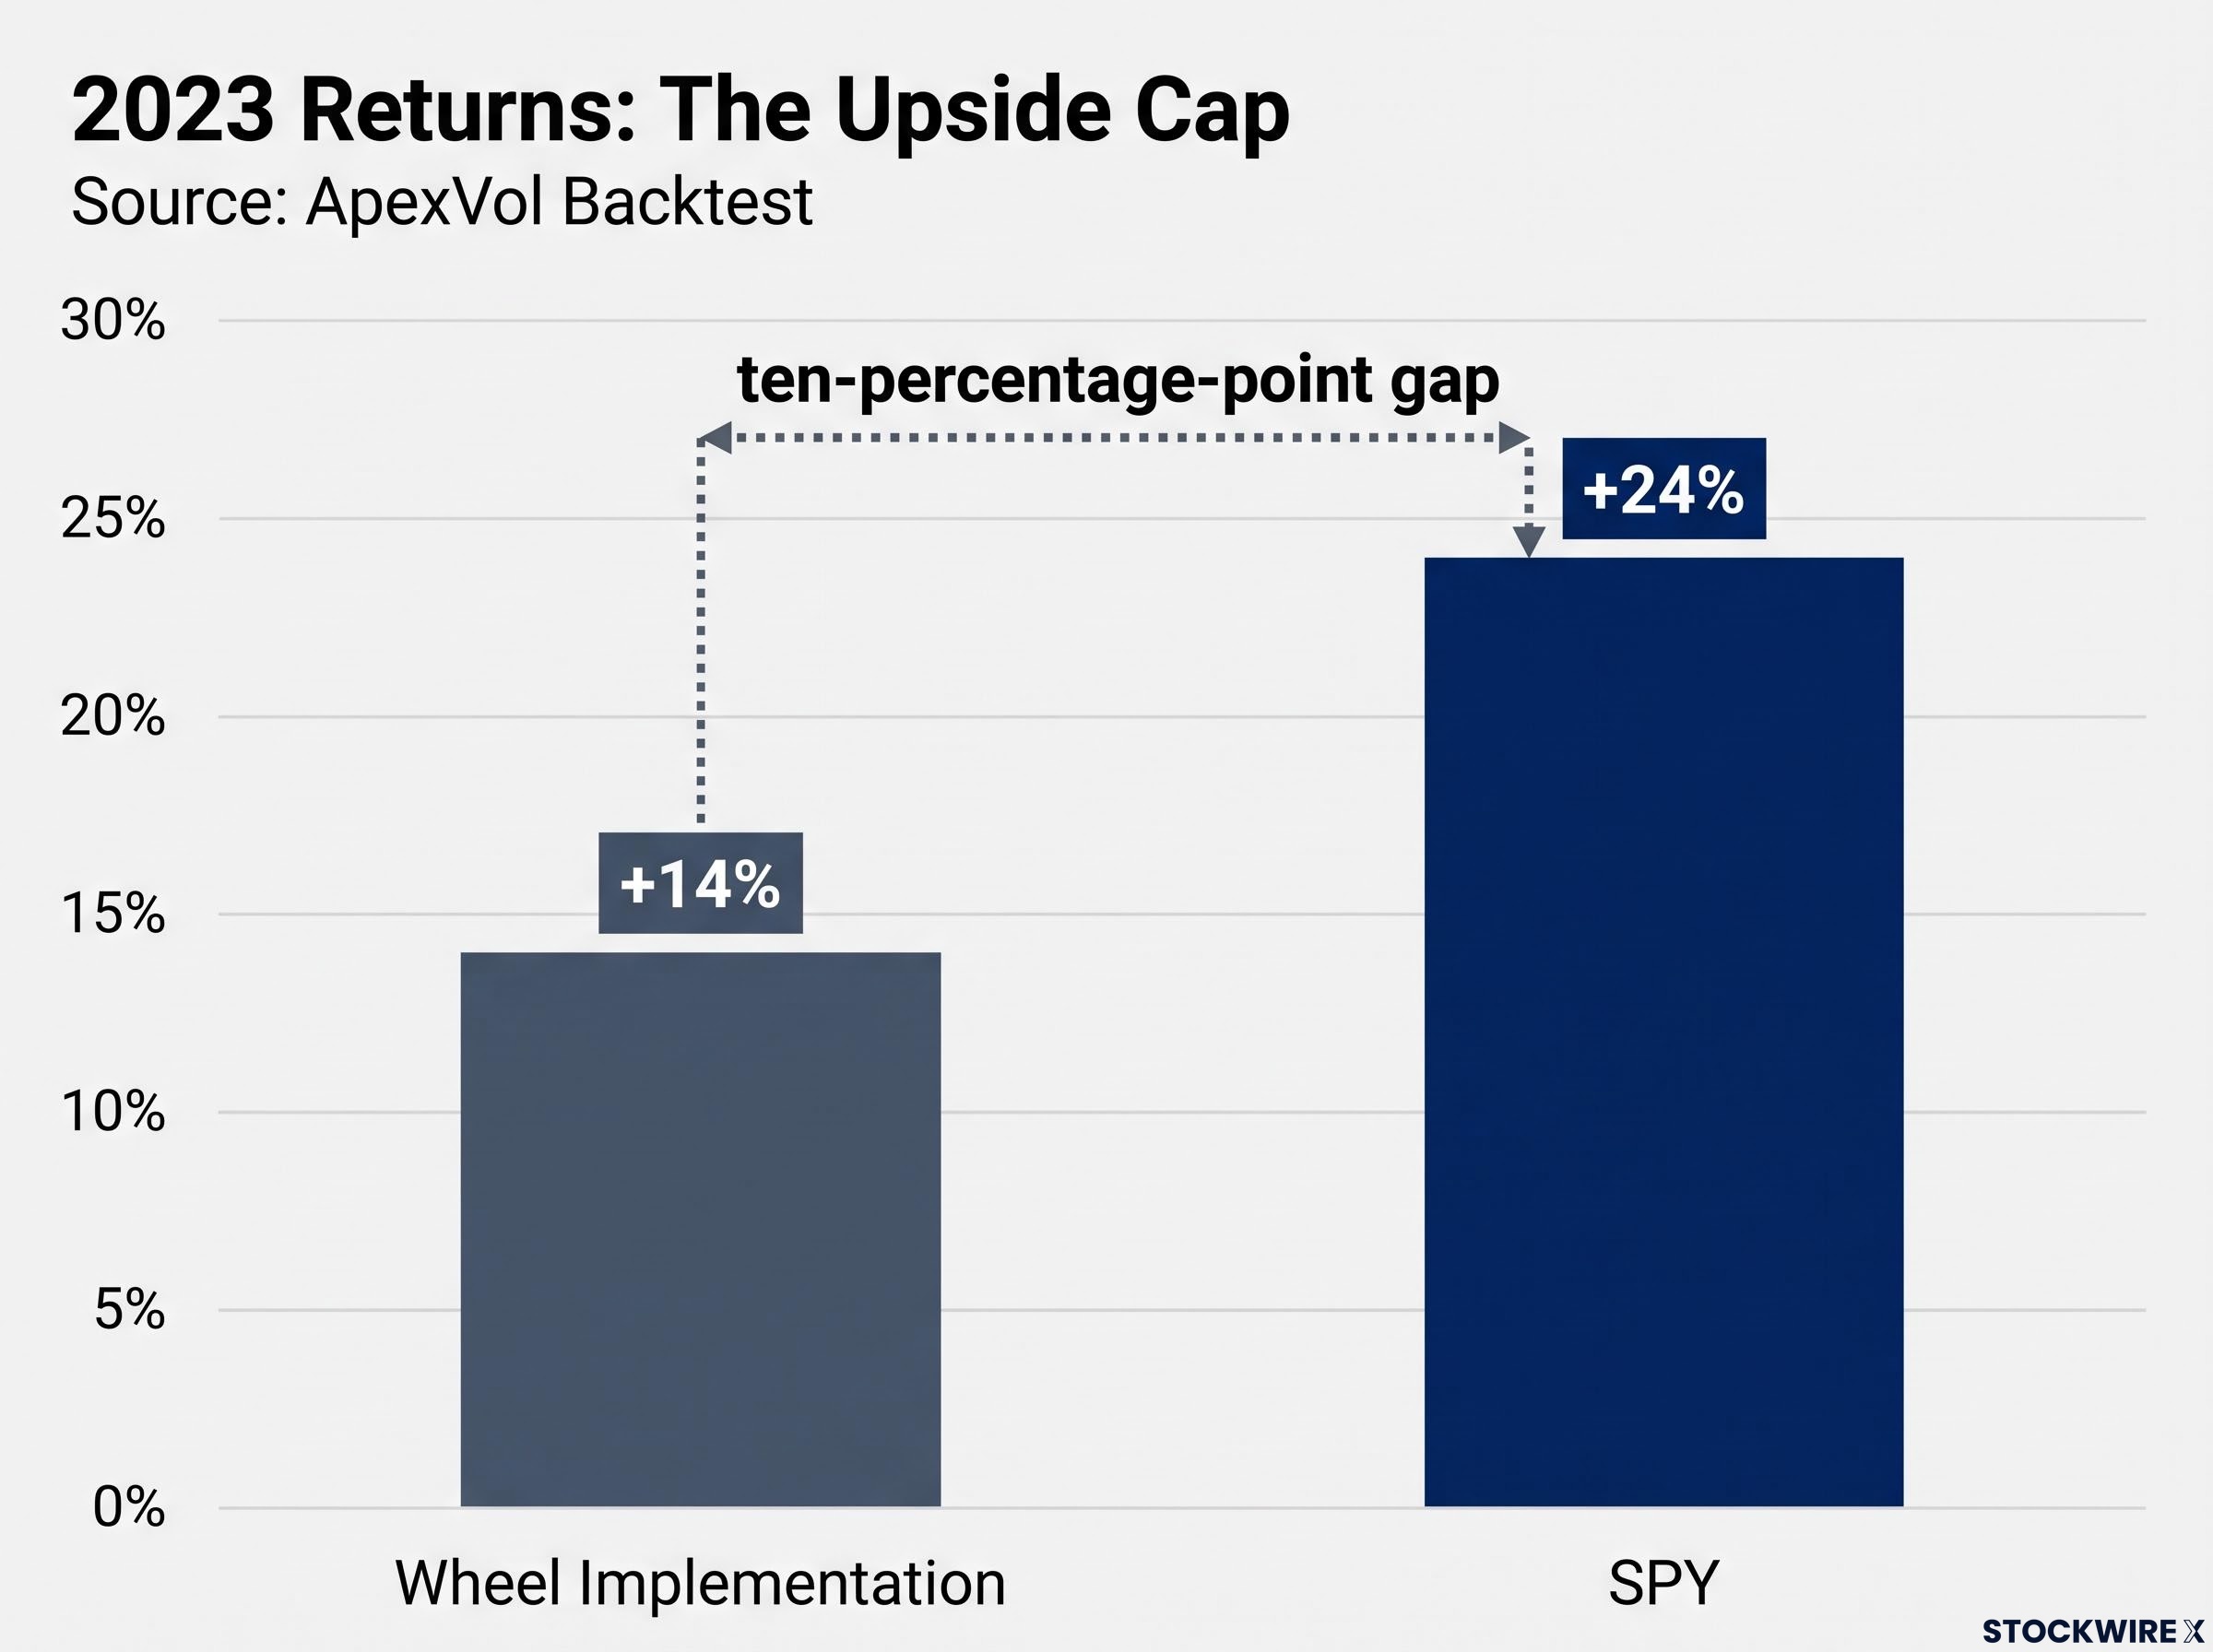
The 2023 numbers make the upside cap concrete. According to an ApexVol backtest, a wheel implementation returned roughly +14% in 2023 against +24% for SPY, a ten-percentage-point gap driven almost entirely by covered calls capping the rally. That is not a rounding error. It is a systematic cost you take on every time you run the wheel in a grinding bull market rather than a sideways one, and you should decide to accept it consciously before you sell the first put.
The long-run cost of premium selling is quantified by 19 years of Cboe data showing that a systematic put-write approach returned 7.1% annualised versus 10.9% for the S&P 500, compounding a $100,000 starting balance into $372,000 instead of $733,000, which is the same structural underperformance dynamic that explains the wheel’s 2023 gap against SPY.
Then there is the behavioural trap. Options Alpha’s Kirk Du Plessis warns about traders who keep “rolling down and out,” selling fresh calls on a name that keeps falling. The cost basis on the screen drifts lower and lower, creating an illusion of safety, while the actual capital tied up in a deteriorating business erodes.
This is basis anchoring, and it is why retail traders consistently underestimate the wheel’s downside:
- Income illusion and basis anchoring: a lower effective basis feels like lower risk, even though the stock can fall far below that adjusted figure.
- High win rates in benign markets: frequent small wins in calm conditions breed overconfidence.
- Underestimation of regime shifts: traders extrapolate recent sideways or bullish conditions and discount the possibility of a prolonged bear phase.
Name what the strategy cannot do, and you can weigh it honestly. A falling basis is a scoreboard, not a shield.
When the wheel works, and when it does not
The same wheel mechanics produce completely different outcomes depending on the market you run them in. Rather than declare a verdict, it helps to walk through three regimes and let each one make its own case.
Start with sideways to mildly bullish markets. The stock oscillates within a range, so you collect premium repeatedly without giving away much upside or eating frequent large drops. Tastytrade and Options Alpha broadly agree this is the wheel’s sweet spot, particularly when implied volatility (IV), the market’s expectation of how much a stock will move, is elevated but not at crisis levels. Rich premiums give you a meaningful cushion; calm-but-not-comatose conditions keep gap risk low.
Now a strong bull trend. Here the covered calls that generate your income become the thing that hurts you, capping gains and forcing assignments right as the stock runs. The +14% versus +24% SPY gap from 2023 is exactly this regime punishing the strategy.
And a sustained downtrend, which is the worst case. Short puts get assigned at successively lower prices, and covered calls provide only thin relief while the underlying grinds down. Very low IV makes matters worse in any regime, because thin premiums no longer compensate for the downside you are accepting.
| Market Condition | IV Environment | Wheel Suitability | Primary Risk |
|---|---|---|---|
| Sideways / mildly bullish | Elevated, not crisis-level | Strongest fit | Occasional whipsaw |
| Strong bull trend | Often lower | Weak fit | Capped upside, underperformance |
| Sustained bear / downtrend | Often elevated / spiking | Worst fit | Repeated assignment into losses |
Choosing the underlying is itself a regime decision. These three criteria reduce the odds of a single event erasing years of premium:
- Liquidity: tight spreads and robust options volume to minimise slippage.
- Diversification: broad ETFs or large-cap quality names over speculative, high-beta single stocks that carry gap and blow-up risk.
- Position sizing: cash-secure every put and limit each position to a small fraction of total portfolio equity, avoiding correlated names in the same sector.
Before running the wheel on any name, ask three questions: what is the IV regime, what is the underlying’s trend, and could you comfortably hold 100 shares of it if you were assigned today?
Before settling on an underlying for the wheel, reading options chain signals gives you a concrete read on where the market’s implied move sits, how skew is priced, and whether speculative demand is concentrated on one side, all inputs that inform whether the premium on offer actually compensates for the assignment risk you are accepting.
Tracking your adjusted cost basis across multiple cycles
Understanding the arithmetic is one thing. Keeping an accurate running record across a dozen cycles is another, and this is where the income narrative either holds up or quietly falls apart.
Your platform’s transaction history is the raw material. Filter the activity or orders section by symbol and by a date range, whether year-to-date or a rolling 7, 30, or 60-day window, and every net credit you collected shows up individually, ready to be subtracted from your basis.
The illustrative case is simple. A $0.20 net credit from one covered call cycle and a $0.30 net credit from another appear as separate line items in the transaction view, and each comes off the running basis in turn.
For anything beyond a couple of cycles, a spreadsheet is more reliable. The five-step manual process looks like this:
- Filter your transaction history by symbol and date range inside the platform.
- Identify each covered call cycle’s open and close transactions.
- Calculate the net credit per cycle (premium received minus premium paid to close).
- Export to a spreadsheet such as Excel for cumulative subtraction from the assignment price net of the original put premium.
- Verify the result against your platform’s profit-and-loss figure to confirm it is accurate.
That final step is the one people skip, and it matters most.
A hard reconciliation check If you cannot match your running adjusted cost basis to the actual profit-and-loss your platform reports, you are running on mental accounting fiction rather than a verifiable financial record. Accurate tracking is what turns the wheel’s income story into something you can actually trust.
One judgment call remains manual. If you have layered a separate short put spread onto the name for extra delta exposure, you may want to exclude those transactions from the core position’s cost basis, which no automated filter will decide for you.
Platform-assisted tracking: what Thinkorswim and others offer
Some of this can be automated at the platform level. Charles Schwab’s Cost Basis education section includes a dedicated thinkorswim tutorial that walks through adjusting how the cost of a trade displays on the platform, letting you reflect premiums, fees, or custom entries without rebuilding everything by hand.
Tastytrade and Interactive Brokers both offer general P&L and cost-basis reporting. For now, manual spreadsheet tracking remains the most reliable method across platforms.
Running the wheel with clear eyes
Strip away the mechanics and the wheel comes down to a handful of honest preconditions. On the right underlying, in a range-bound and moderately volatile market, with disciplined sizing, the systematic premium it produces is a real if modest enhancement over passive stock ownership. That is the genuine value, and it is worth having.
It is also the ceiling. Expert commentary across sources converges on the same view: the wheel is a tactical overlay on equity exposure, valuable in the right context, not an income machine that neutralises downside.
Run it responsibly and six guidelines fall out as a pre-trade checklist:
- Understand the true risk: it is economically equivalent to owning the stock.
- Select appropriate underlyings: liquid, diversified, quality names.
- Match the strategy to the regime: sideways or mildly bullish, with meaningful IV.
- Size conservatively: cash-secure every put, limit each position.
- Maintain accurate cost basis records you can reconcile to P&L.
- Avoid behavioural inertia: reassess the fundamentals after assignment, as Options Alpha urges, rather than mechanically selling more calls on a failing business.
The cost basis number is a tracking tool, not a risk indicator. The real question is never how low your basis has fallen; it is whether the stock is still worth owning at today’s price. Put it to yourself plainly before the next trade: would you be comfortable buying 100 shares of this name outright at today’s price? If the answer is no, the wheel does not change that calculation.
For investors who want defined-risk premium income without the full capital commitment of cash-securing a put, our dedicated guide to credit spreads covers how bull put spreads cap maximum loss while preserving three separate paths to profit, making them a useful complement or alternative to the wheel’s structure.
This article is for informational purposes only and should not be considered financial advice. Investors should conduct their own research and consult with financial professionals before making investment decisions.
Past performance does not guarantee future results. Financial projections are subject to market conditions and various risk factors.