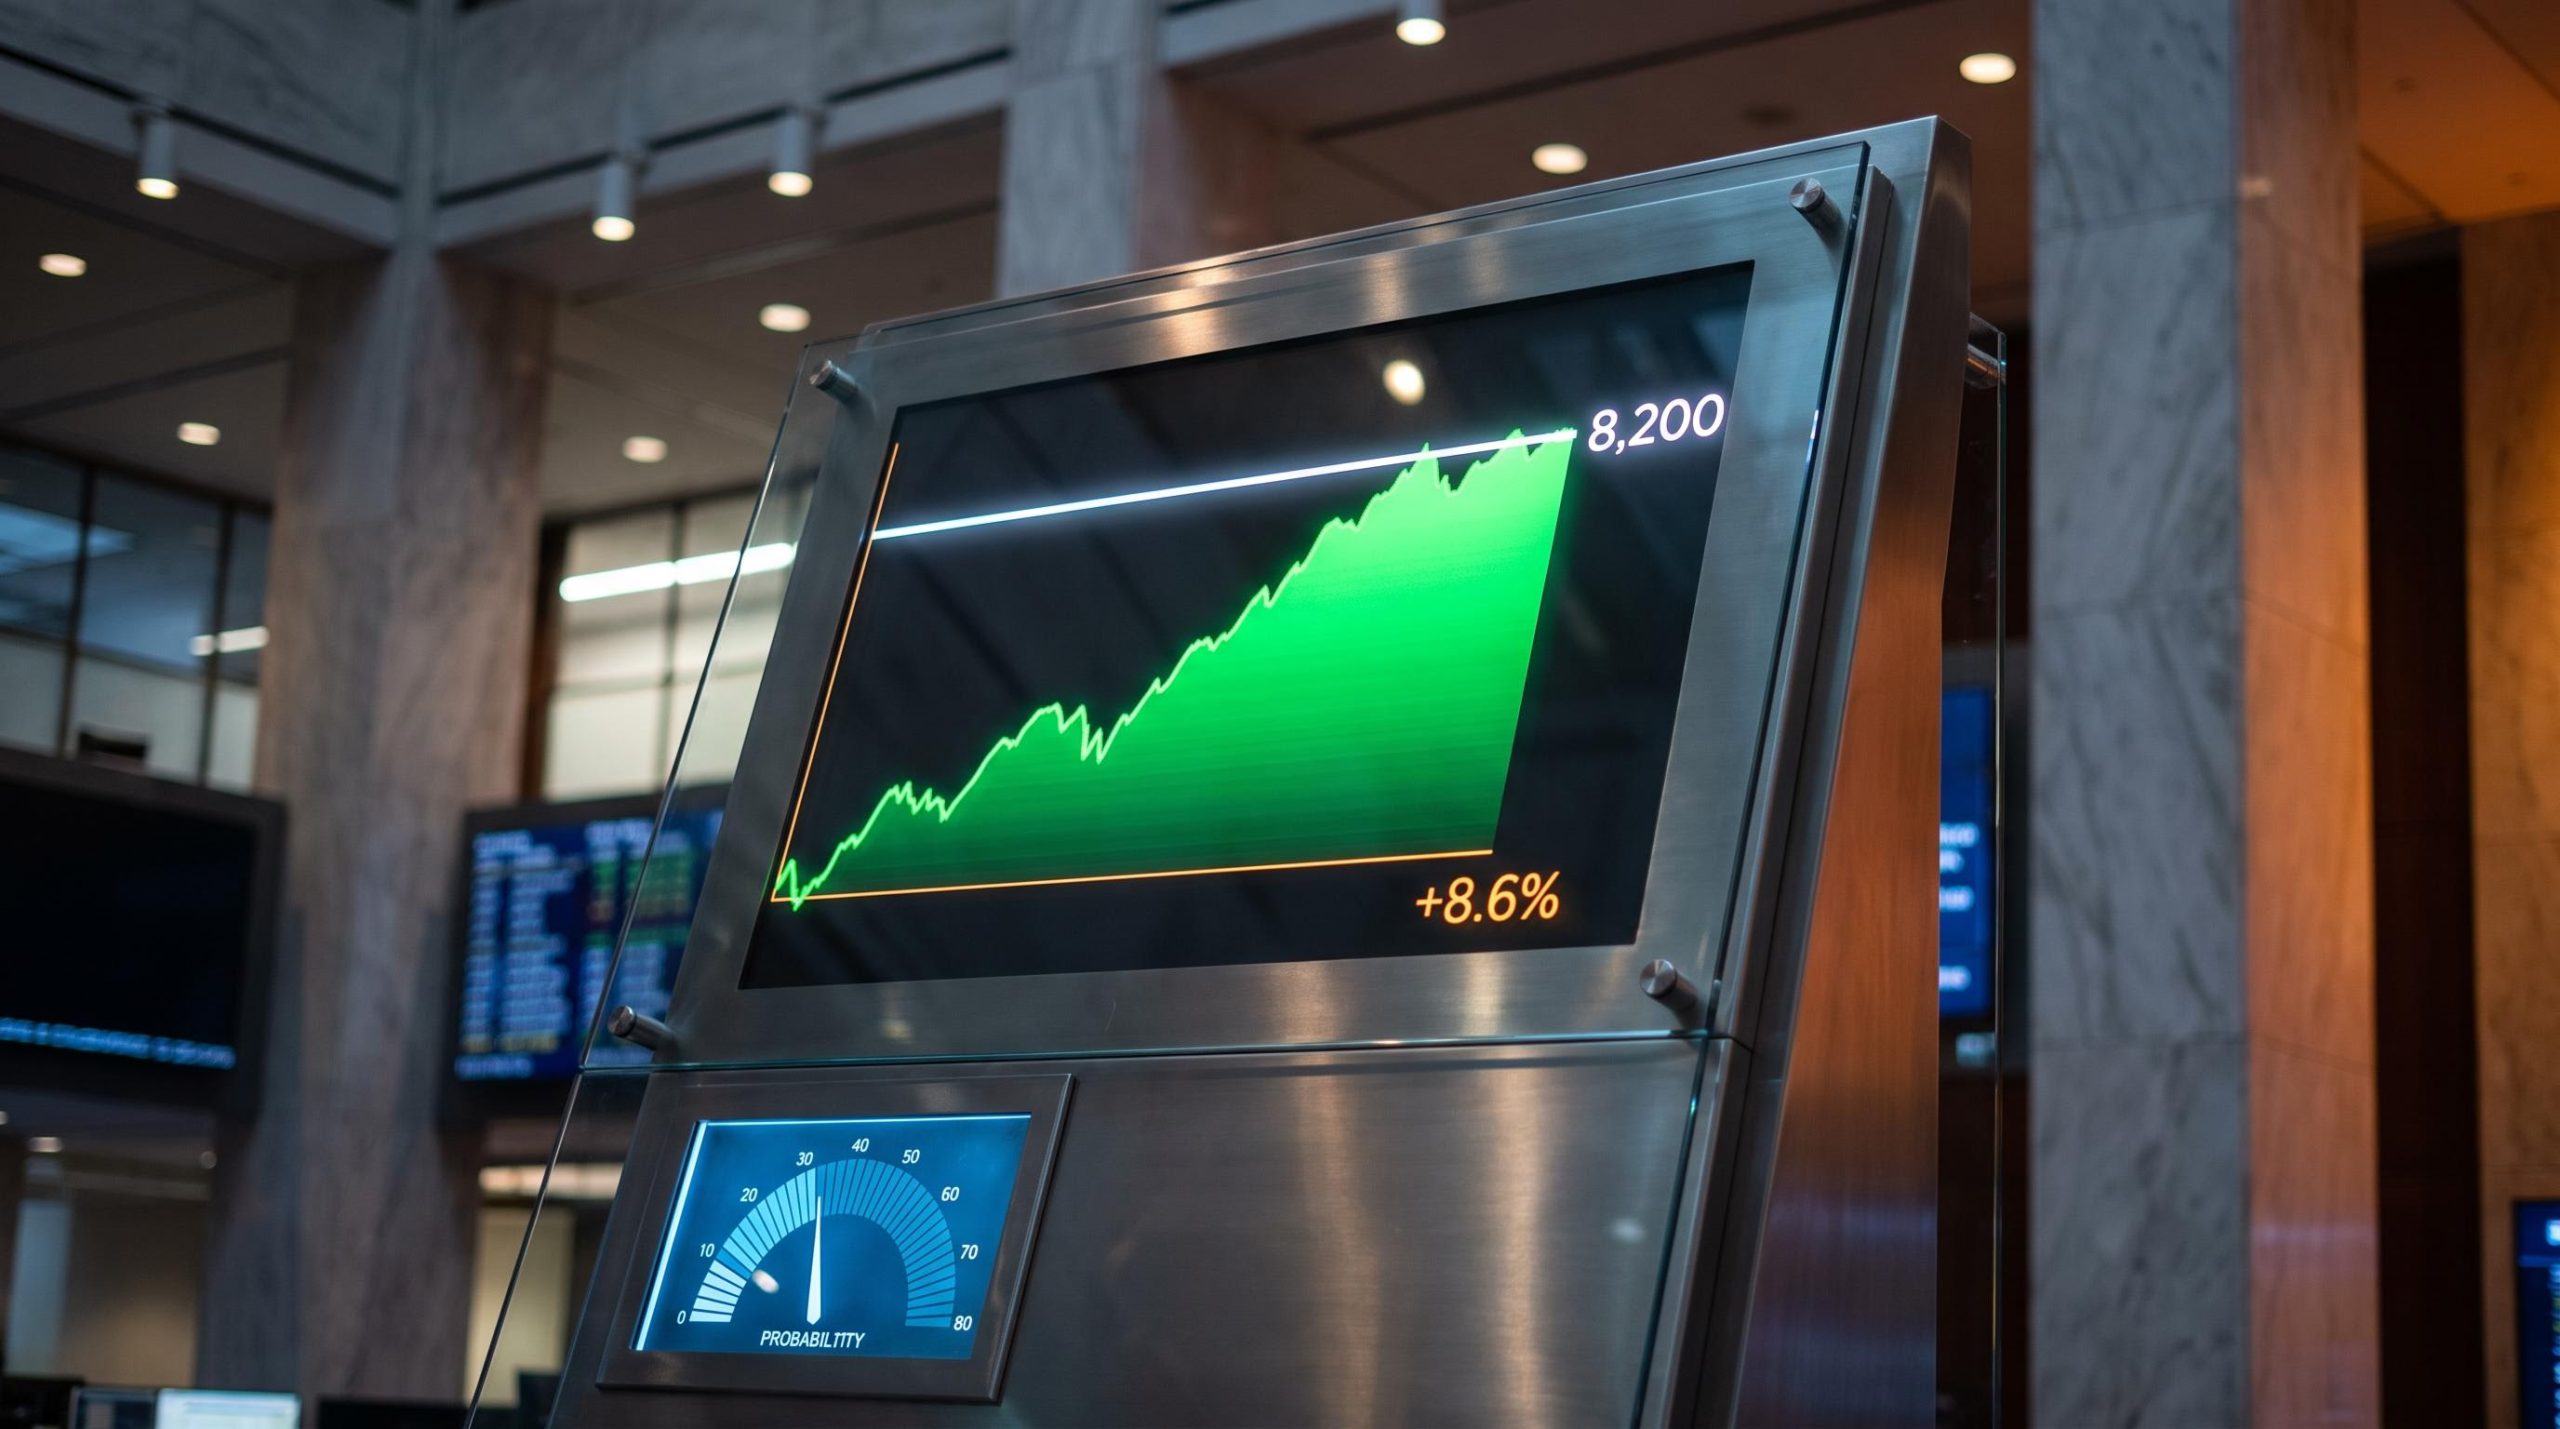
The S&P 500 needs to climb another 8.6% in roughly three and a half months to reach 8,200, and it has to do so from a year in which it has already logged what one analysis calls the best midterm-year performance on record. That is the mathematical gap sitting behind one of Wall Street’s most-watched year-end calls.
Fundstrat’s Tom Lee has treated 8,200 not as a ceiling but as a conservative floor, going so far as to suggest the number may be “too low.” His position is bullish, but it is not isolated: Barclays, J.P. Morgan, HSBC and CFRA all sit within the 7,950-8,100 range. What makes 2026 unusual is that the market’s own starting conditions differ fundamentally from every prior midterm year in the historical record.
This piece gives you the specific tools to evaluate the forecast on its own merits: the historical pattern Lee is relying on, the exact way 2026 breaks from that pattern, what prediction markets currently say the odds are, and which conditions would need to hold for the target to be reached. The aim is to equip you to make your own judgment, not to accept or reject the call.
How Tom Lee gets to 8,200, and why the number keeps moving higher
Lee entered 2026 with a year-end target of 7,700, set in December 2025. On 25 June 2026, he raised his official base case to 8,000, pointing to stronger-than-expected earnings. That 8,000 figure remains his formally published target.
The 8,200 level is a different kind of number. It has appeared in his interviews as an upside floor rather than a base case. In a 31 August 2026 commentary recap, Lee said his “8,200 S&P 500 target may be too low,” citing earnings revisions that could justify higher levels. By his 6 July 2026 CNBC appearance, with the index near 7,537, he was already sketching an upper-bound scenario running to 8,400-8,800 if earnings kept beating.
| Level | Status | Date set |
|---|---|---|
| 7,700 | Original year-end target | December 2025 |
| 8,000 | Raised official base case | 25 June 2026 |
| 8,200 | Interview framing, “potentially too low” | August-September 2026 |
| 8,400-8,800 | Upper-bound scenario under sustained earnings | July 2026 onward |
The escalating structure matters more than any single figure. The gap between his 8,000 official target and his 8,200-plus interview framing tells you Lee views the risk as asymmetrically to the upside. His public stance has moved beyond his own base case.
“Easily above 8,200” In a 16 September 2026 CNBC “Closing Bell” interview, Lee said the S&P 500 could “easily be above 8,200 by the end of the year,” driven by a rally in technology stocks and the “Magnificent Seven.”
Anchor that to reality. The S&P 500 closed at 7,551.81 on 15 September 2026. Reaching 8,200 from there requires roughly 8.58% additional upside in about three and a half months, calculated as (8,200 minus 7,551.81) divided by 7,551.81.
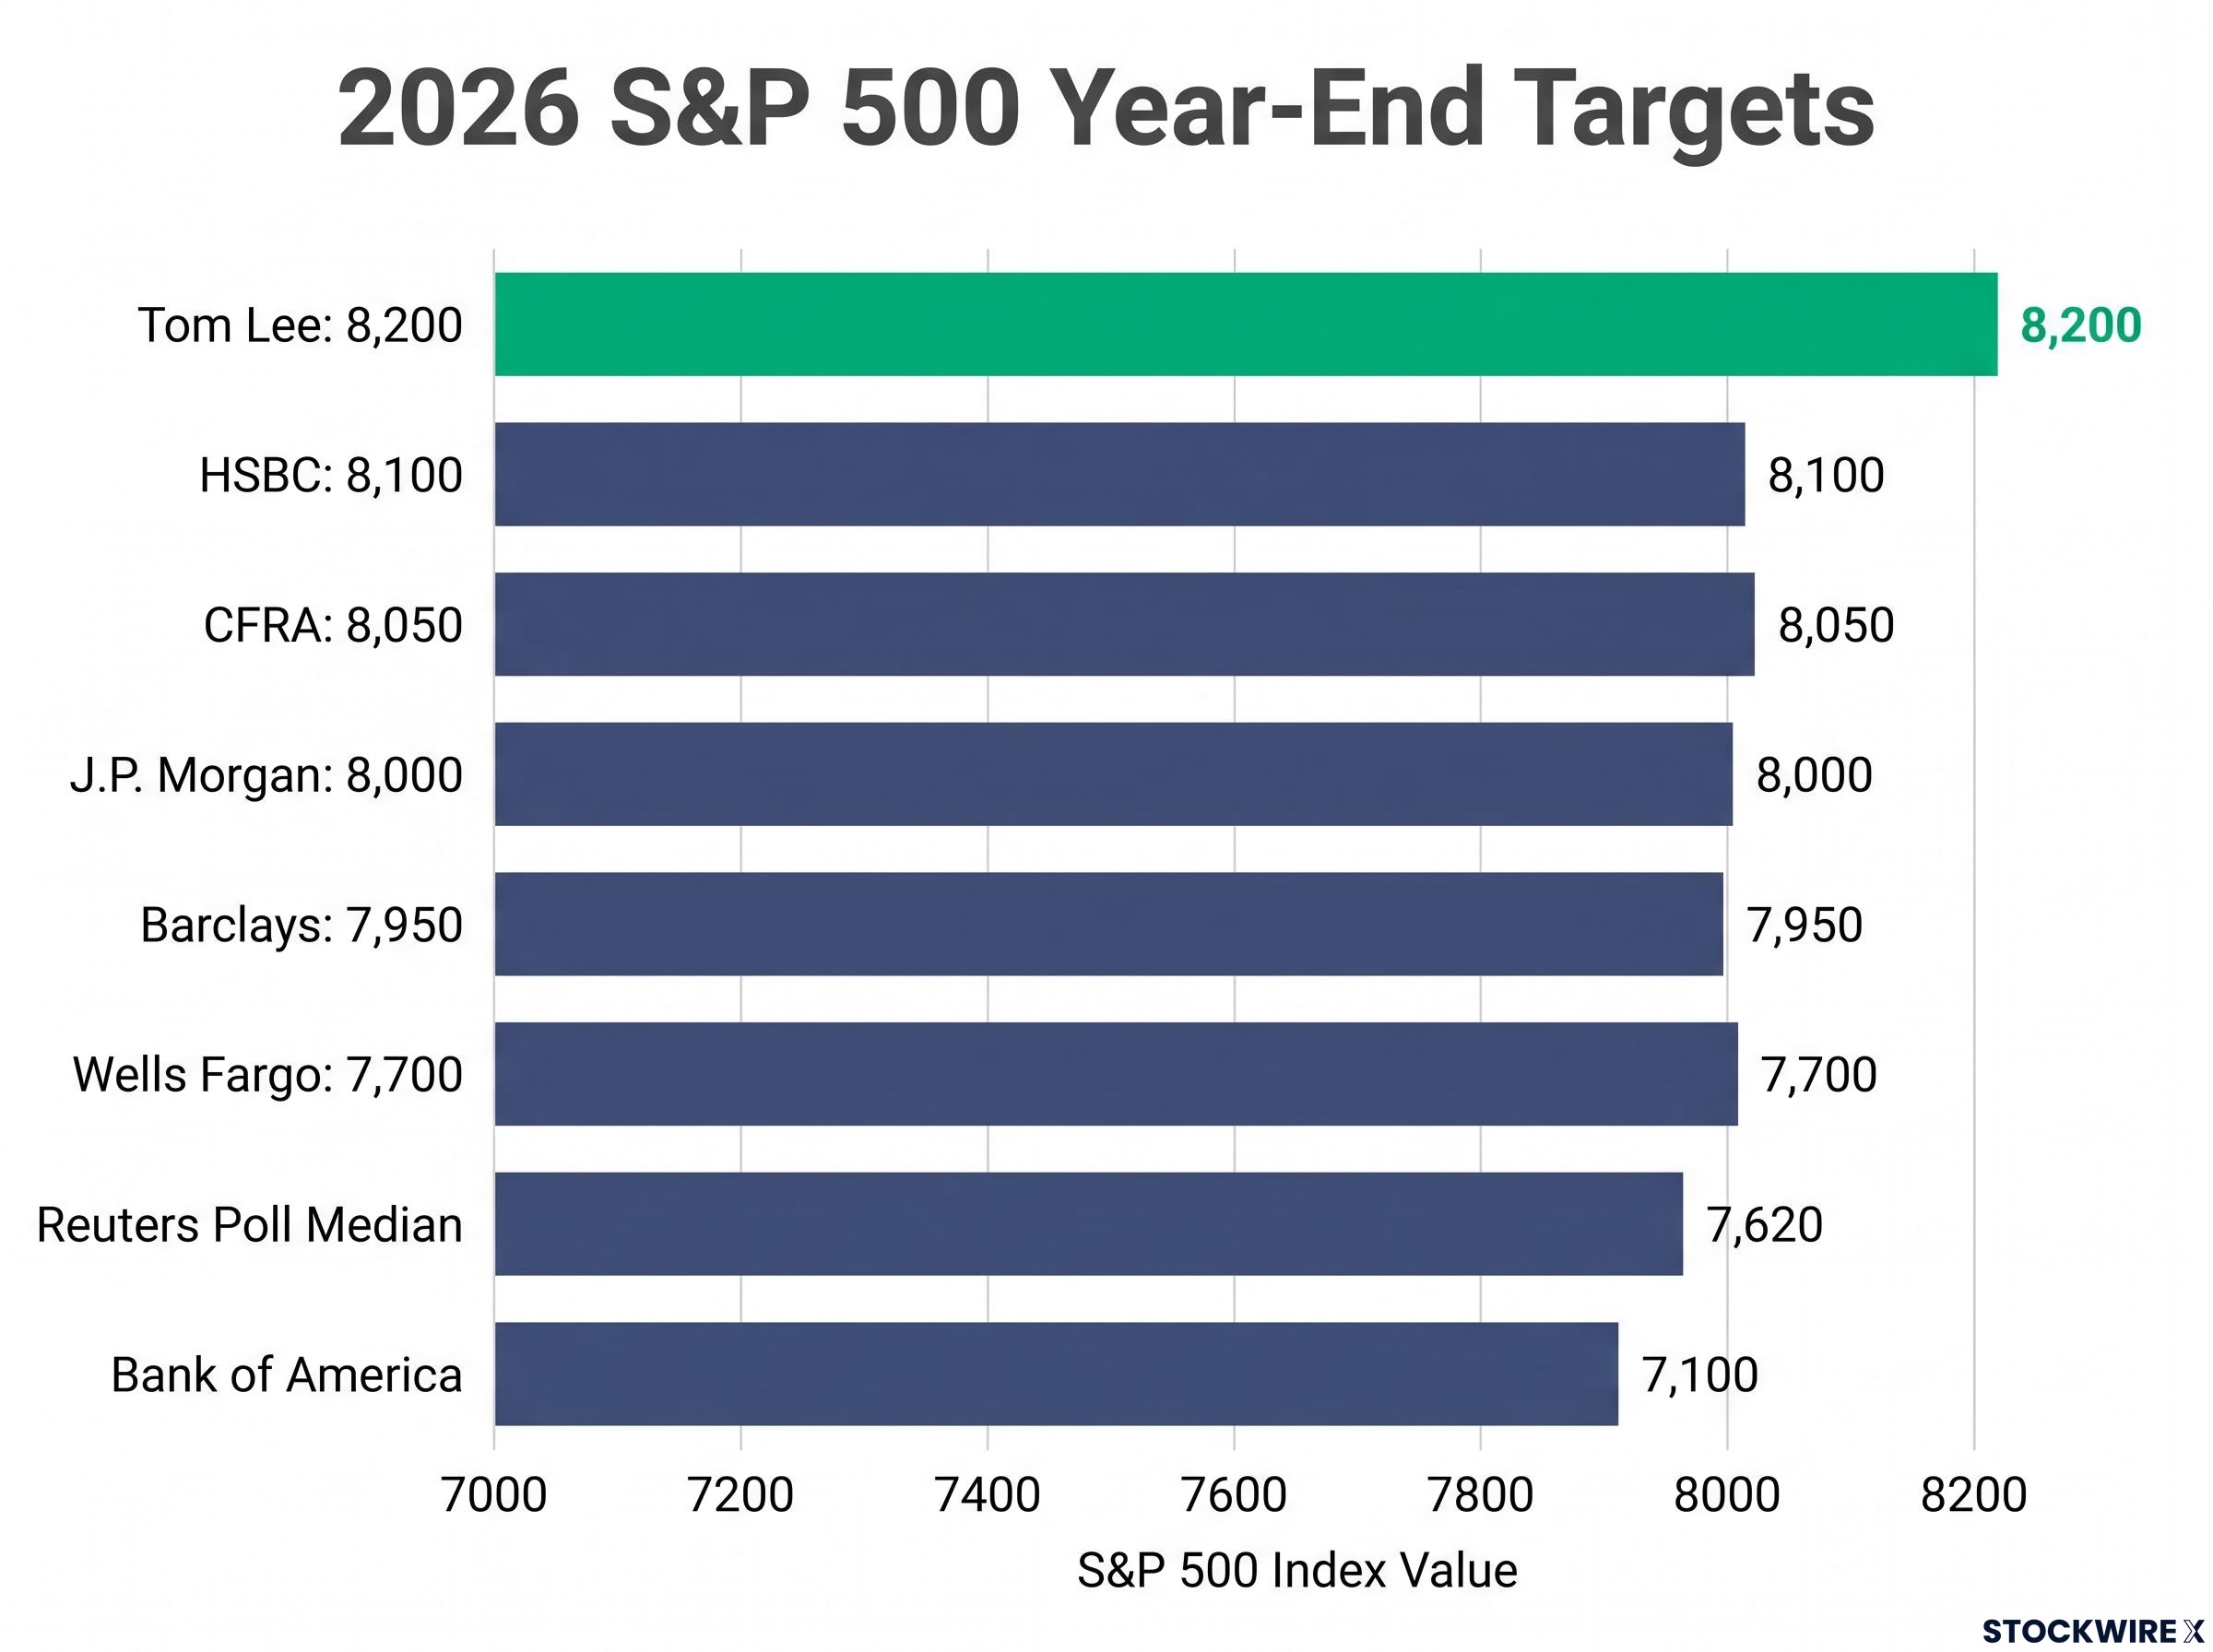
Here is where Lee sits relative to peers, each of whom sees a more modest climb to their own targets:
- Barclays: 7,950 (roughly 4% upside)
- J.P. Morgan: 8,000 (roughly 3% upside)
- CFRA: 8,050 (roughly 4% upside)
- HSBC: 8,100 (mid-single-digit upside)
- Wells Fargo: 7,700 (cut in September, near-flat)
- Bank of America: 7,100 (roughly 6% downside from June levels)
Most major houses see 2-5% upside to their targets. Lee’s 8,200 implies an 8-9% climb. That gap is what the rest of this analysis is built to test.
When big ASX news breaks, our subscribers know first
What the midterm year playbook actually says, and where 2026 breaks from it
The historical case for a Q4 rally is genuinely strong, and it is worth understanding before weighing whether it applies. Since 1950, the S&P 500 has risen in the twelve months following every midterm election. That is a 19-for-19 record.
The post-midterm rally mechanics examined across all 19 cycles since 1950 hinge on uncertainty resolution rather than party outcome, as settled election results historically allow sidelined capital to redeploy into equities from a position of weakness rather than from near record highs.
The seasonal detail is just as compelling. The average Q4 return in midterm election years has run at approximately 6.4-6.6%, and the twelve months after midterms have averaged around 14-14.8%, the strongest stretch of the four-year presidential cycle. That strength is concentrated: midterm years overall post the most muted annual returns of the cycle, averaging roughly 3.3%, with the gains loaded into Q4 and the year that follows.
The 2022 cycle is the cleanest illustration of the pattern in action. The index had fallen roughly 19% by 16 September 2022, troughed near 3,577 in October, then advanced around 14% over the following twelve months. A September-October bottom, then a post-midterm recovery.
The 2026 anomaly The original analysis described the S&P 500’s gain of just over 10% heading into this period as the best midterm-year return on record to that date.
Why the 2026 starting point changes the equation
That characterisation is the whole problem. Every prior post-midterm rally launched from weakness. The 2026 index is launching from near record highs, up approximately 10-12% year-to-date, with the most recent data clustering around 11-12%.
Three structural divergences follow from that single fact:
- No valuation reset. The historical pattern involves weak, volatile returns and deeper intra-year drawdowns ahead of the election, compressing multiples and widening the equity risk premium. With the index at highs, no such compression has happened.
- Positioning is already extended. After a strong first three quarters, investors are already heavily exposed to equities, leaving less fuel from re-risking.
- Catch-up demand has been spent. Much of the demand and valuation normalisation that usually powers the Q4 rebound has already been deployed.
The implication is precise. The 19-for-19 record is not invalidated, but its applicability to 2026 is conditional on a precondition that is absent. Analysts at firms including FDW Capital and Simianx have made exactly this point: applying midterm base rates from a starting point near all-time highs implies a less favourable risk/reward, because the pattern has always started from a low. Treat the statistic as directionally encouraging, not as a base rate you can lift directly onto 2026.
What prediction markets and Wall Street consensus say the odds actually are
If the historical pattern is ambiguous, prediction markets offer a more direct read on how the crowd is pricing the outcome. The answer is a spectrum, not a single number, and the direction of travel is as telling as the range itself.
| Platform / source | Date | Probability | Level |
|---|---|---|---|
| Kalshi | 29 June 2026 | ~11% | Close above 8,200 |
| Polymarket | 29 June 2026 | ~36% | Hit 8,200 by 31 December |
| Polymarket / Octagon | 5 August 2026 | 29.2% | Finish at or above 8,200 |
| Polymarket / Action Network | 4 September 2026 | 40.5% | Finish above 8,000 |
| Kalshi | 14 September 2026 | 9% (8,200-8,400) | Implied median ~7,300 |
The range runs from roughly 11% to roughly 36% for an 8,200 outcome, depending on platform and date. That spread alone tells you the outcome is possible but not the market’s central expectation.
The direction matters more. The most recent Kalshi snapshot, from 14 September 2026, assigned 18% to the 8,000-8,200 range and just 9% to 8,200-8,400, with an implied median near 7,300, well below Lee’s targets. Set against the late-August Polymarket readings, that is a step down in implied bullishness. The market is pricing in more headwind, not building momentum toward 8,200.
What the Wall Street distribution looks like
Professional forecasters are spread across a similar range. Ordered from most bearish to most bullish:
- Bank of America: 7,100 (roughly 6% downside from June levels, citing “too many red flags”)
- Reuters strategist poll: 7,620 median, from 47 strategists on 27 May 2026
- Wells Fargo: 7,700, cut in September on “limited catalysts for further gains”
- Barclays: 7,950, citing a standout technology earnings season
- J.P. Morgan: 8,000, on AI-driven revenue growth at hyperscalers
- CFRA: 8,050, with potential upside toward 8,650 next year
- HSBC: 8,100, on earnings exceeding prior expectations
- Tom Lee: 8,200-plus, framed as potentially conservative
The read for you is straightforward. Lee sits toward the bullish tail of the distribution, not out on his own. A cluster of credible houses has upgraded into the high-7,900s and low-8,000s. His 8,200 is a stretch above that cluster, not a break from it.
The institutional convergence at 8,000 among Goldman Sachs, Morgan Stanley, Deutsche Bank, and Societe Generale rested on an 86% Q2 earnings beat rate, a record low 9% miss rate, and all-time high margins across 10 of 11 sectors, the same earnings breadth narrative that underlies Lee’s move from 7,700 to 8,000 and then toward 8,200.
Three conditions that need to align for Lee’s target to hold
Rather than treat the risks as a generalised cloud of uncertainty, it helps to frame them as three specific tests the market has to pass over the next three and a half months. Each has a clear pass condition and a clear failure trigger.
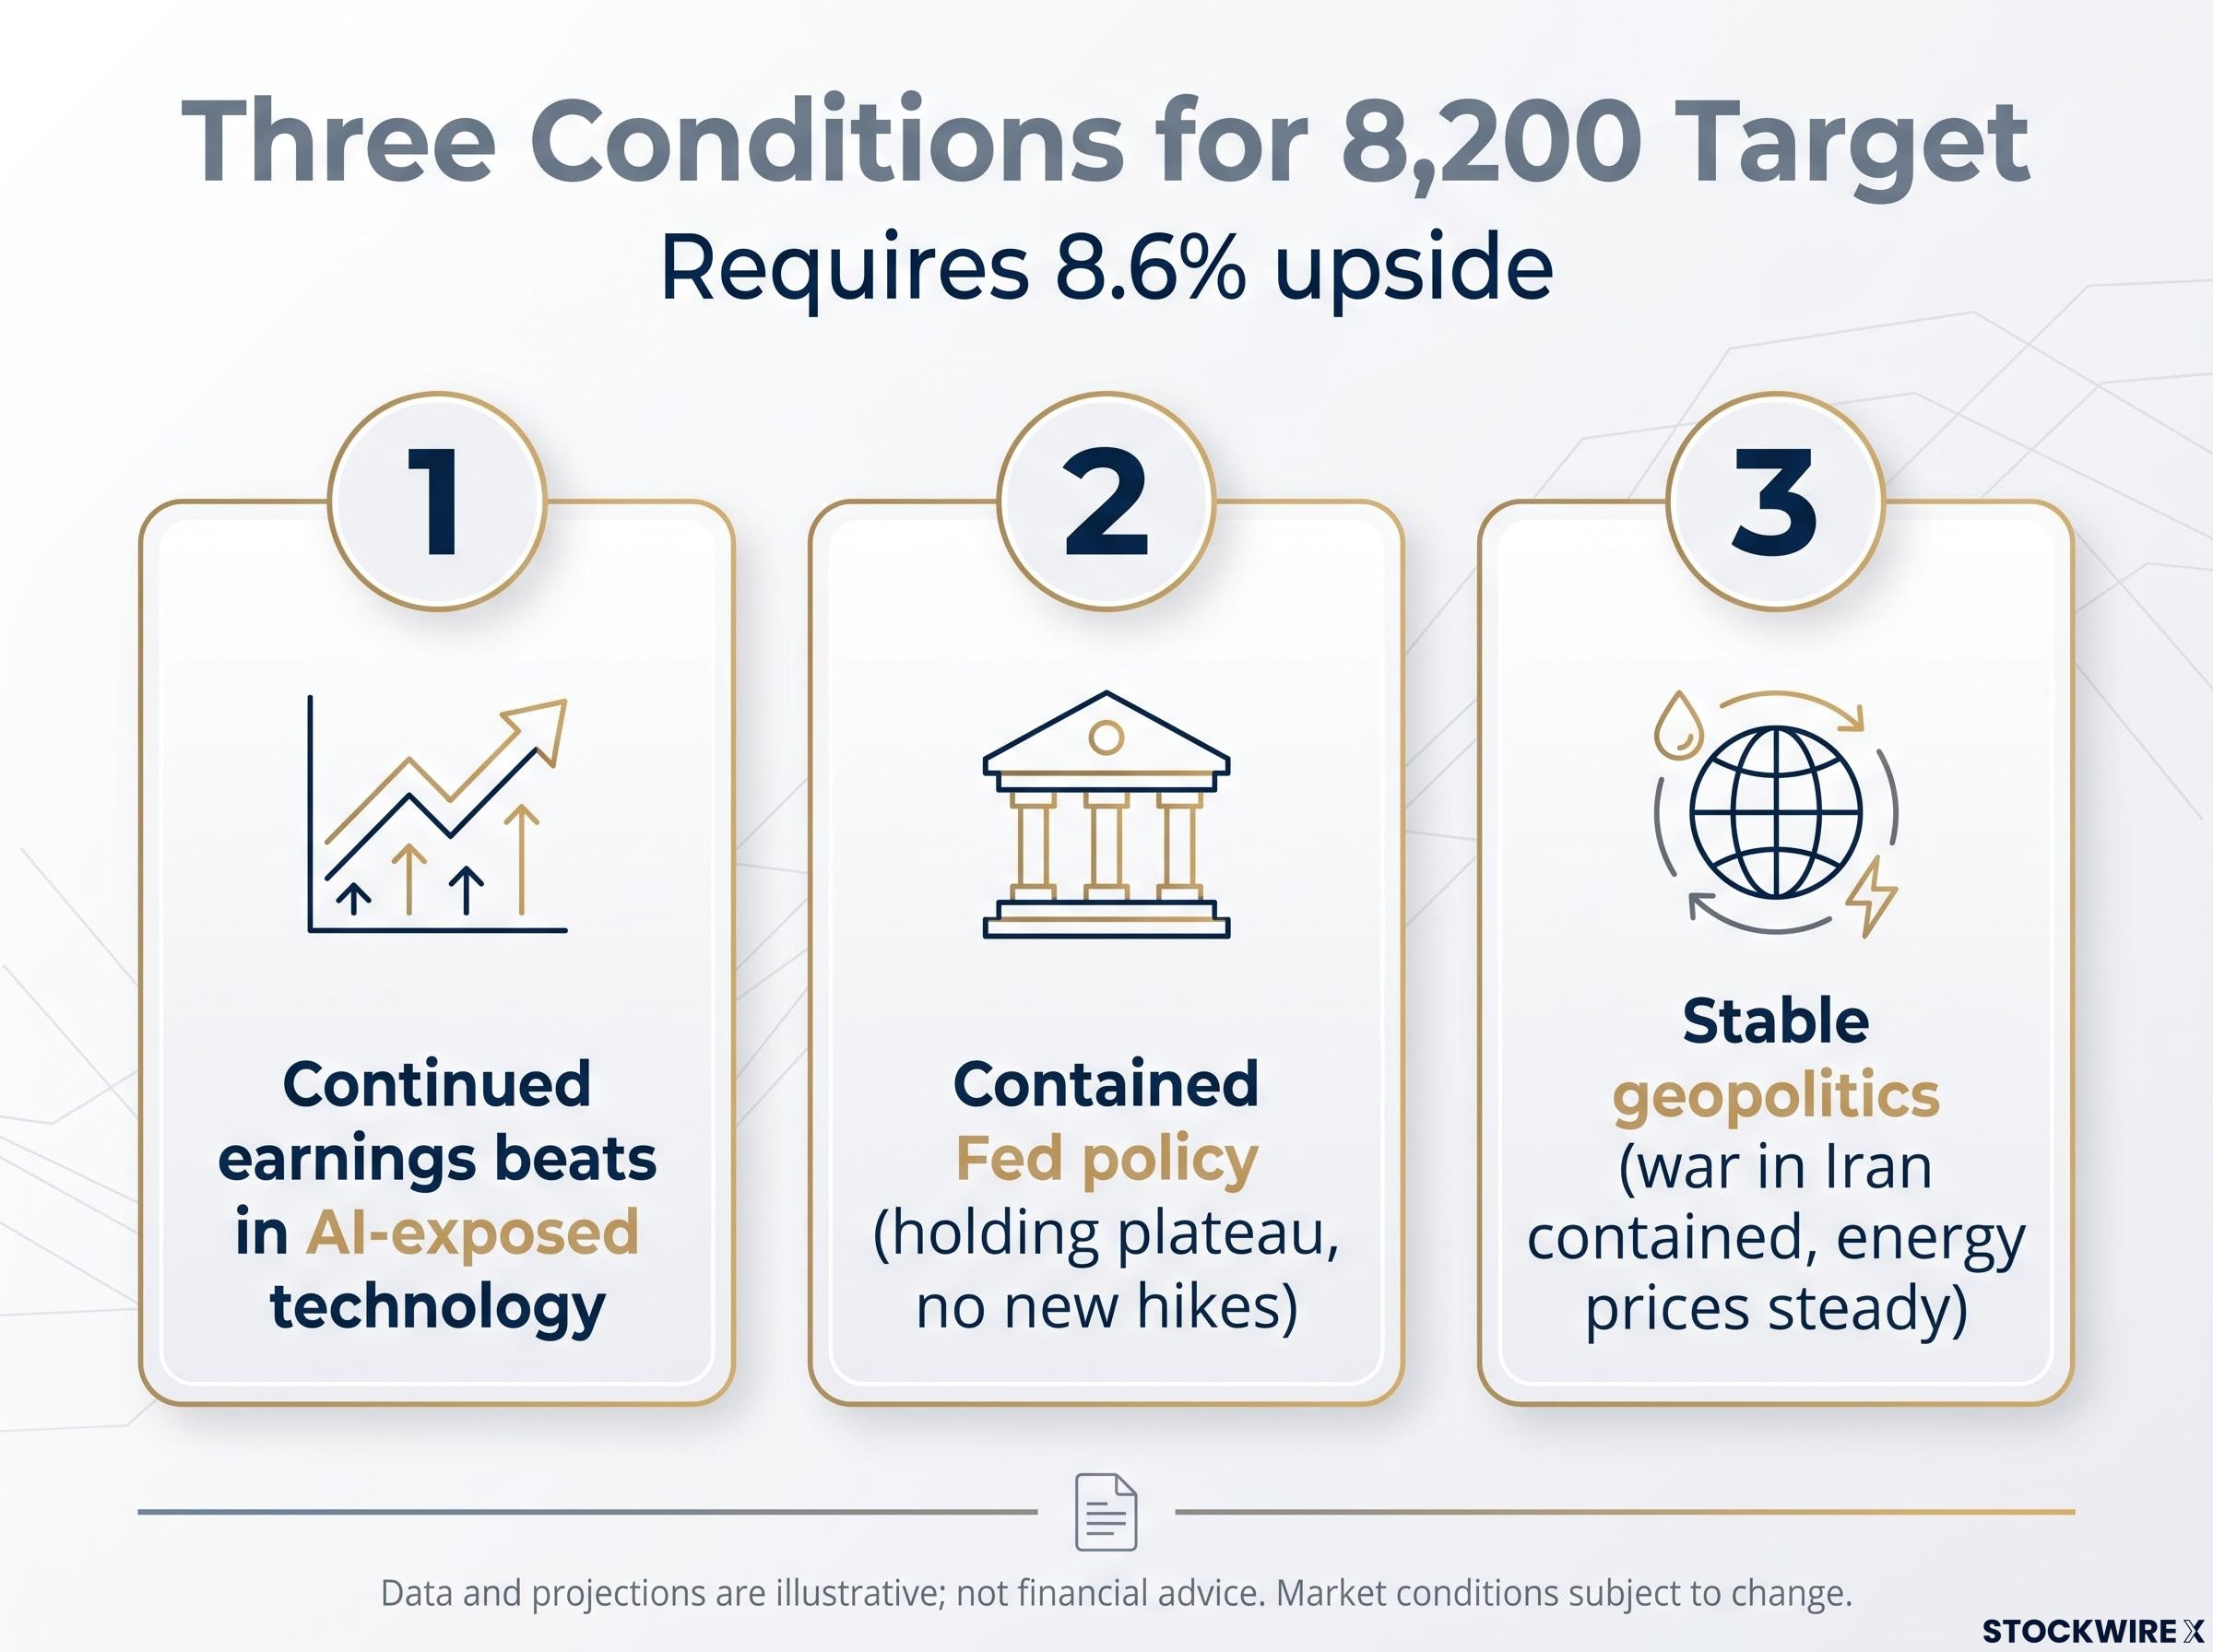
- Continued earnings beats, especially in AI-exposed technology. Passing looks like sustained EPS beats broad enough to justify elevated multiples. The risk: AI-concentration. Morningstar’s January 2026 outlook flagged that “AI stocks require even greater growth to support high valuations,” and Bloomberg’s 2026 outlook named an AI-driven equity correction as one of three key risk scenarios.
- Contained Fed policy. Passing looks like the Fed holding its plateau rather than pivoting to new hikes. The risk: Macro Risk Advisors warned that renewed rate hikes could trigger an 8-10% correction as higher borrowing costs squeeze margins at elevated valuations.
- Stable geopolitics. Passing looks like the war in Iran staying contained and energy prices steady. The risk: the Iranian conflict features in every major brokerage’s risk list and keeps a premium in oil that could drag on risk sentiment.
Narrow market breadth has been a persistent feature of the 2026 rally, with only 23% of S&P 500 constituents outperforming the benchmark in April despite a near 10% monthly gain, a structural condition that leaves the index disproportionately exposed to any reversal in the small cohort of AI and semiconductor mega-caps carrying the headline number.
What institutions are watching A Natixis survey of US institutional investors found that valuations (63%), inflation (55%) and concentration (44%) rank as the top perceived portfolio risks for 2026, pointing to limited tolerance for further multiple expansion.
History shows how these tests resolve. In 2018, the combination of Fed hikes and trade tensions produced exactly this shock pattern: strategists carried an average target of 2,893, and the index instead closed near 2,500 after a sharp Q4 selloff. Ambitious late-year targets missed by hundreds of points.
The framework tells you Lee’s 8,200 is not reckless in isolation. It is contingent. All three conditions need to hold in a benign configuration, and any one of them breaking is enough to keep the target out of reach.
What an 8.6% Q4 rally from here would actually mean in context
Pull the threads together and the picture is not a verdict, it is a decision-point. The midterm pattern is real and well-documented, but its preconditions are absent. Prediction markets assign the 8,200 outcome a low-to-mid double-digit probability. Wall Street consensus clusters 2-5% below the target. And the three key conditions each carry meaningful tail risk.
An 8.6% gain over three and a half months is achievable on its own terms. The historical Q4 midterm average of 6.4-6.6% is not far off, and 2021 showed late-summer upgrades can materialise: Goldman raised to 4,700 in August 2021 and the index closed near 4,766. But 2021 came in a Fed-supportive, low-rate environment, and the absence of the usual starting-point compression makes 2026 a more demanding ask than history alone implies.
The spread that frames the call Lee’s upper-bound scenario runs to 8,400-8,800. The most recent Kalshi data implied a median near 7,300. That distance is the uncertainty you are being asked to price.
The most useful way to hold this is as a probability-weighted range, with a base case somewhere between the Reuters consensus median of 7,620 and Lee’s 8,200, and the specific outcome decided by which of the three conditions holds or breaks first. Three variables to watch through Q4:
- AI earnings beats versus elevated multiples, especially across the mega-caps that have carried the index
- Fed communication on the rate path, where a shift from plateau to hikes is the clearest downside trigger
- Geopolitical developments affecting energy prices and risk sentiment, primarily the war in Iran
Watch those three as they unfold, and you will read the target’s odds in real time rather than in year-end hindsight.
For investors wanting to quantify the downside tail against Lee’s upside call, our deep-dive into S&P 500 drawdown signals covers the RSI and breadth divergence patterns that have preceded corrections of at least 7% in five of the last six comparable instances, including the record tech concentration reading from mid-2026.
This article is for informational purposes only and should not be considered financial advice. Investors should conduct their own research and consult with financial professionals before making investment decisions. Past performance does not guarantee future results. Financial projections are subject to market conditions and various risk factors, and forward-looking statements are speculative and subject to change based on market developments.