When war broke out and oil prices spiked in early 2022, the average American household spent roughly $543 more on gasoline over the following year. That number felt enormous, and there is a simple reason why: drivers watched it update on roadside signs every single day.
But there is another number almost nobody calculated. That same rate environment cost a new buyer on a median-priced home tens of thousands of dollars over the life of their mortgage, a hidden cost that never appeared on any sign.
Geopolitical conflicts set off a chain reaction. Energy markets move first, then inflation expectations, then the bond market, and only at the end of that chain do household borrowing costs shift. The visibility of a price has almost nothing to do with its actual financial weight, and most households badly misjudge where the real damage lands.
Here is what the mechanism actually looks like, from an oil tanker halfway around the world to your monthly mortgage payment and your bond portfolio. By the time you finish, you will understand why rising interest rates matter far more to your long-run finances than the fuel bill you can see.
Why gas prices grab all the attention (even when they are not the biggest hit)
You feel gas prices in a way you feel almost no other cost. The number changes daily, it is posted in giant digits on every corner, and you pay it directly, watching the total climb on the pump display. No other consumer price works this way.
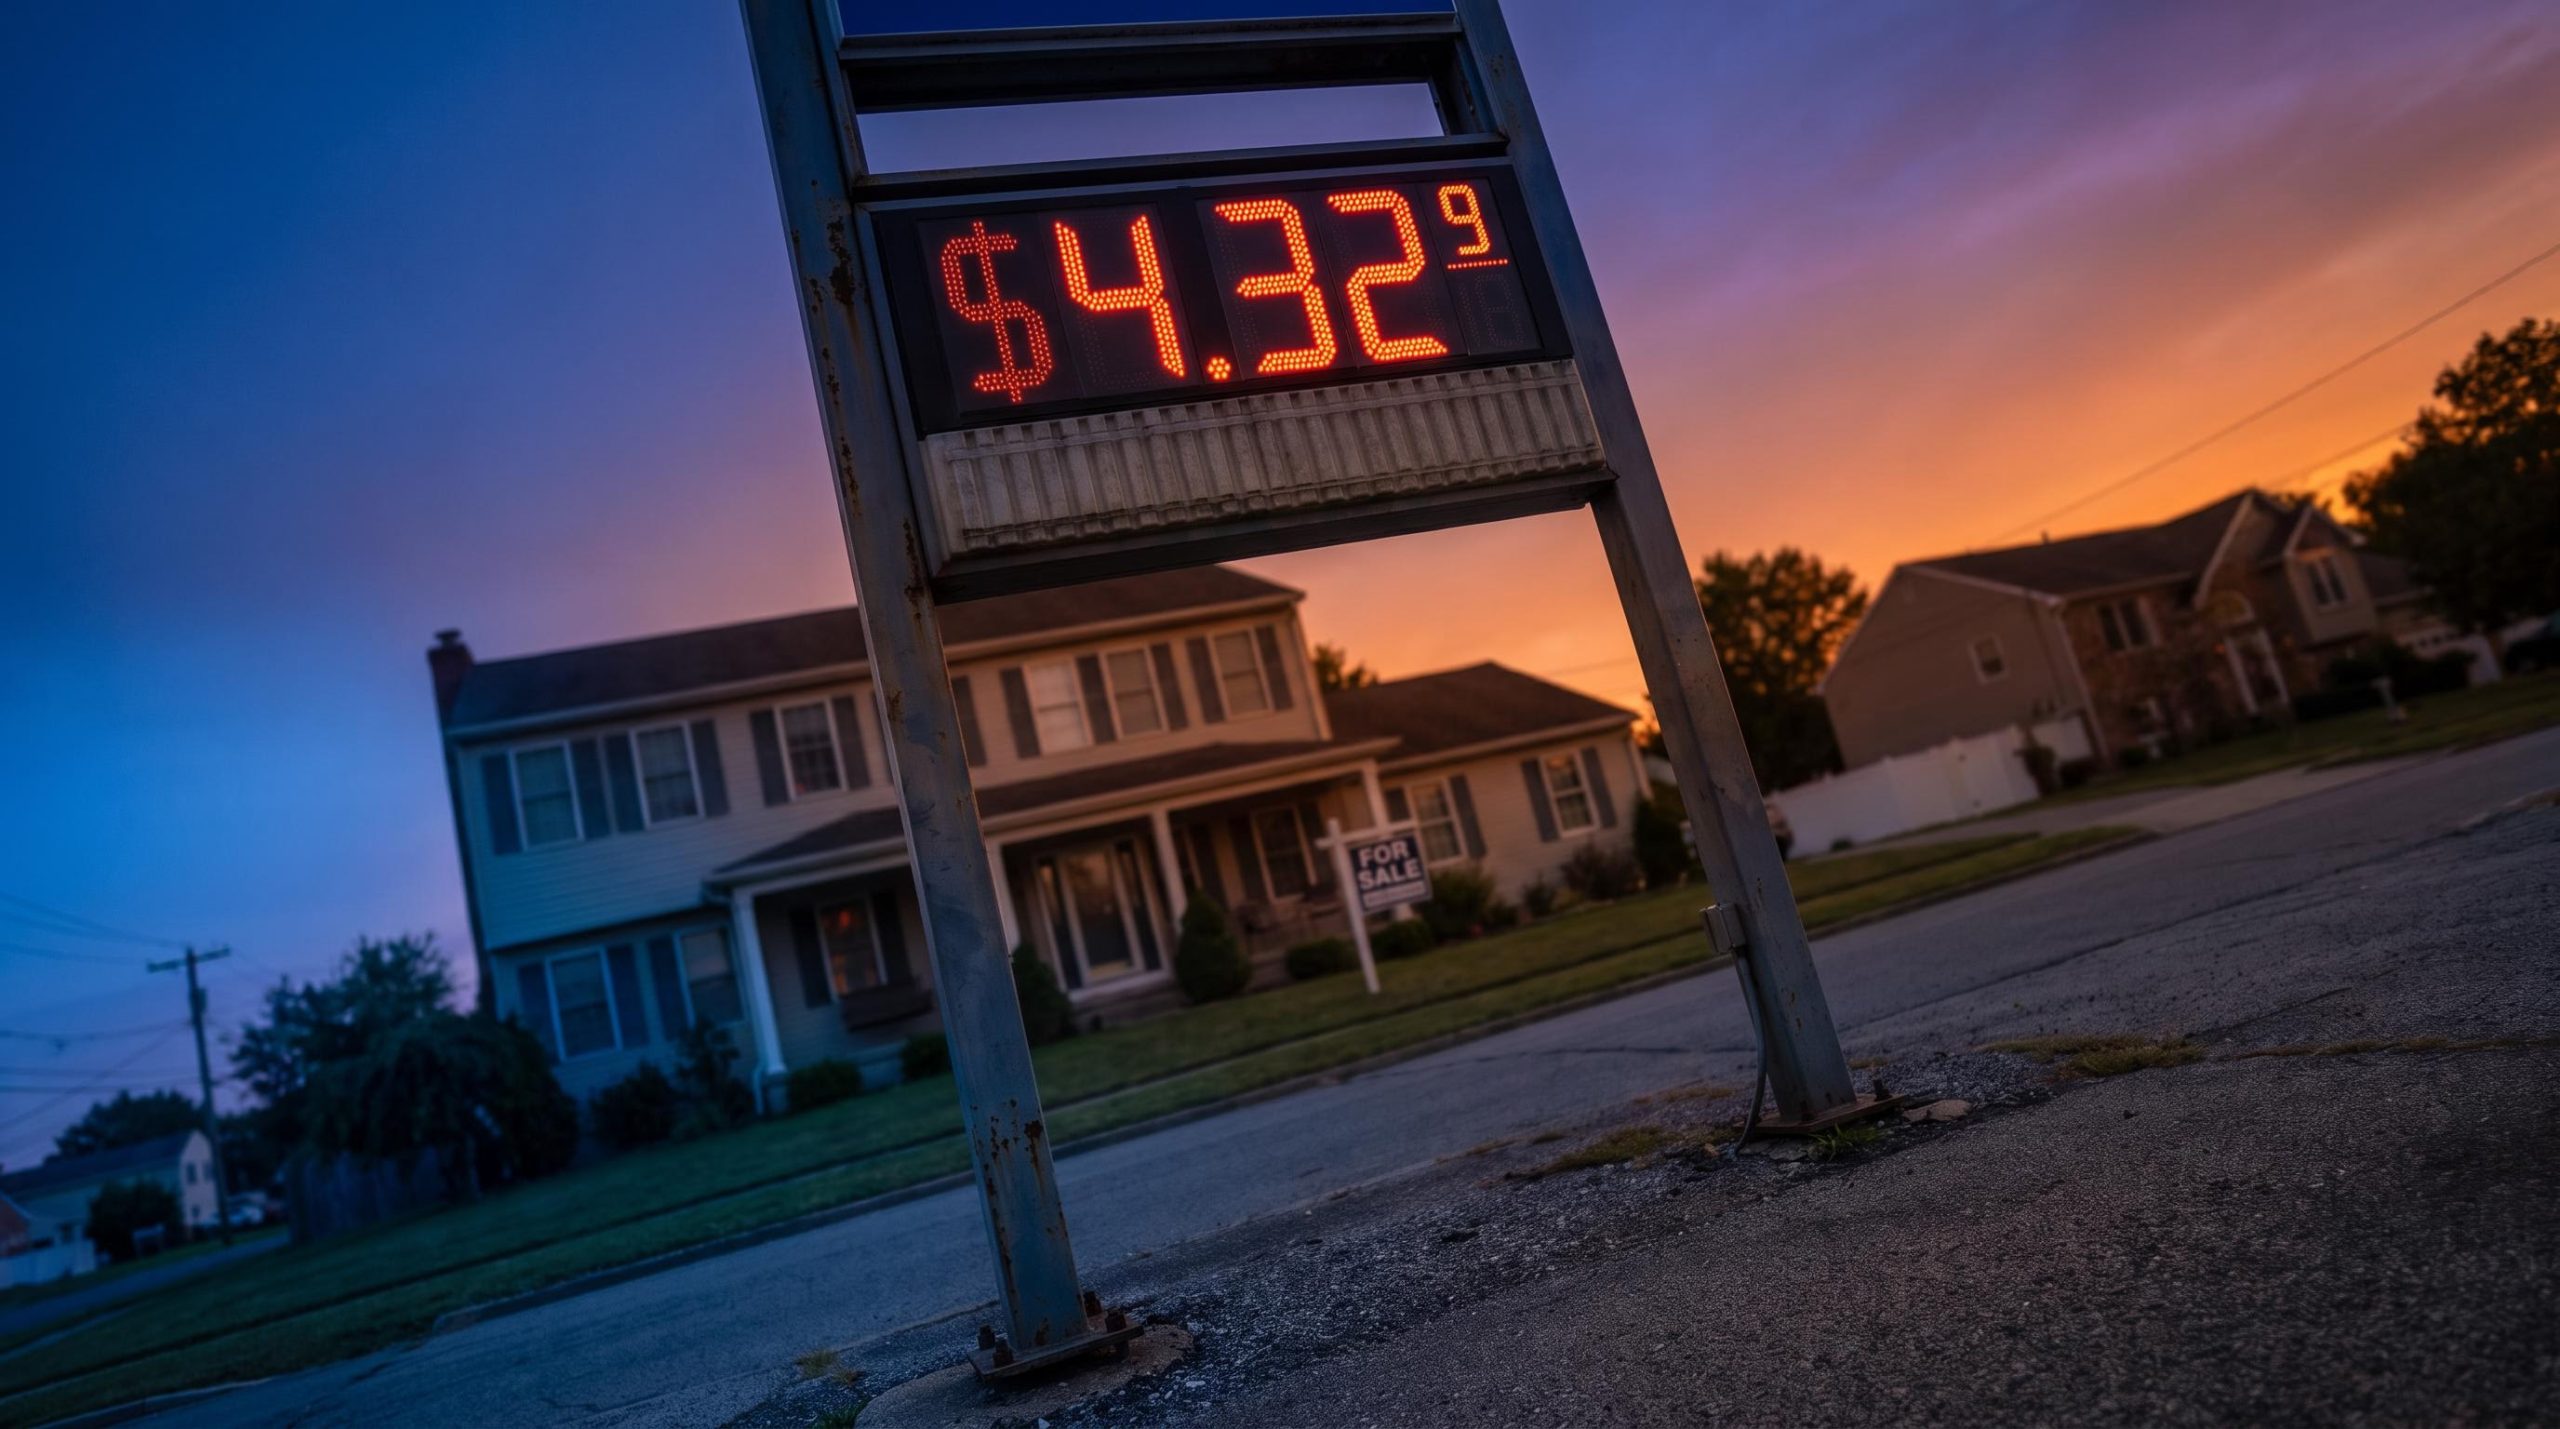
That constant visibility is exactly why fuel dominates how people think about the financial cost of a conflict. And the 2022 price jump was genuinely sharp. Before the war escalated in late February, the national average for regular unleaded sat at roughly $3.44 per gallon. By early March it had climbed to around $4.32, a jump of about 26% in a matter of weeks.
Here is what that actually meant for a typical household budget:
- Pre-war national average: $3.44 per gallon
- Early March 2022 peak: $4.32 per gallon
- Monthly fuel spend before the war: approximately $139
- Additional monthly cost: roughly $45
- Additional annual cost: approximately $543
So the war-related fuel increase came to about $543 a year. That is real money. But notice what it is not: it is not the kind of cost that dominates your exposure to this shock. It registers because it is visible, not because it is large.
$543 a year in extra fuel. Hold that number. The rate environment triggered by the same shock cost a new homebuyer several hundred dollars a month, every month, for up to 30 years.
There is one more thing gas prices have going for them. They can reverse fast. If a conflict resolves and shipping lanes reopen, pump prices can fall back within weeks. A mortgage rate you lock in does no such thing. It stays with you for three decades.
When big ASX news breaks, our subscribers know first
How a conflict in another country raises your mortgage rate
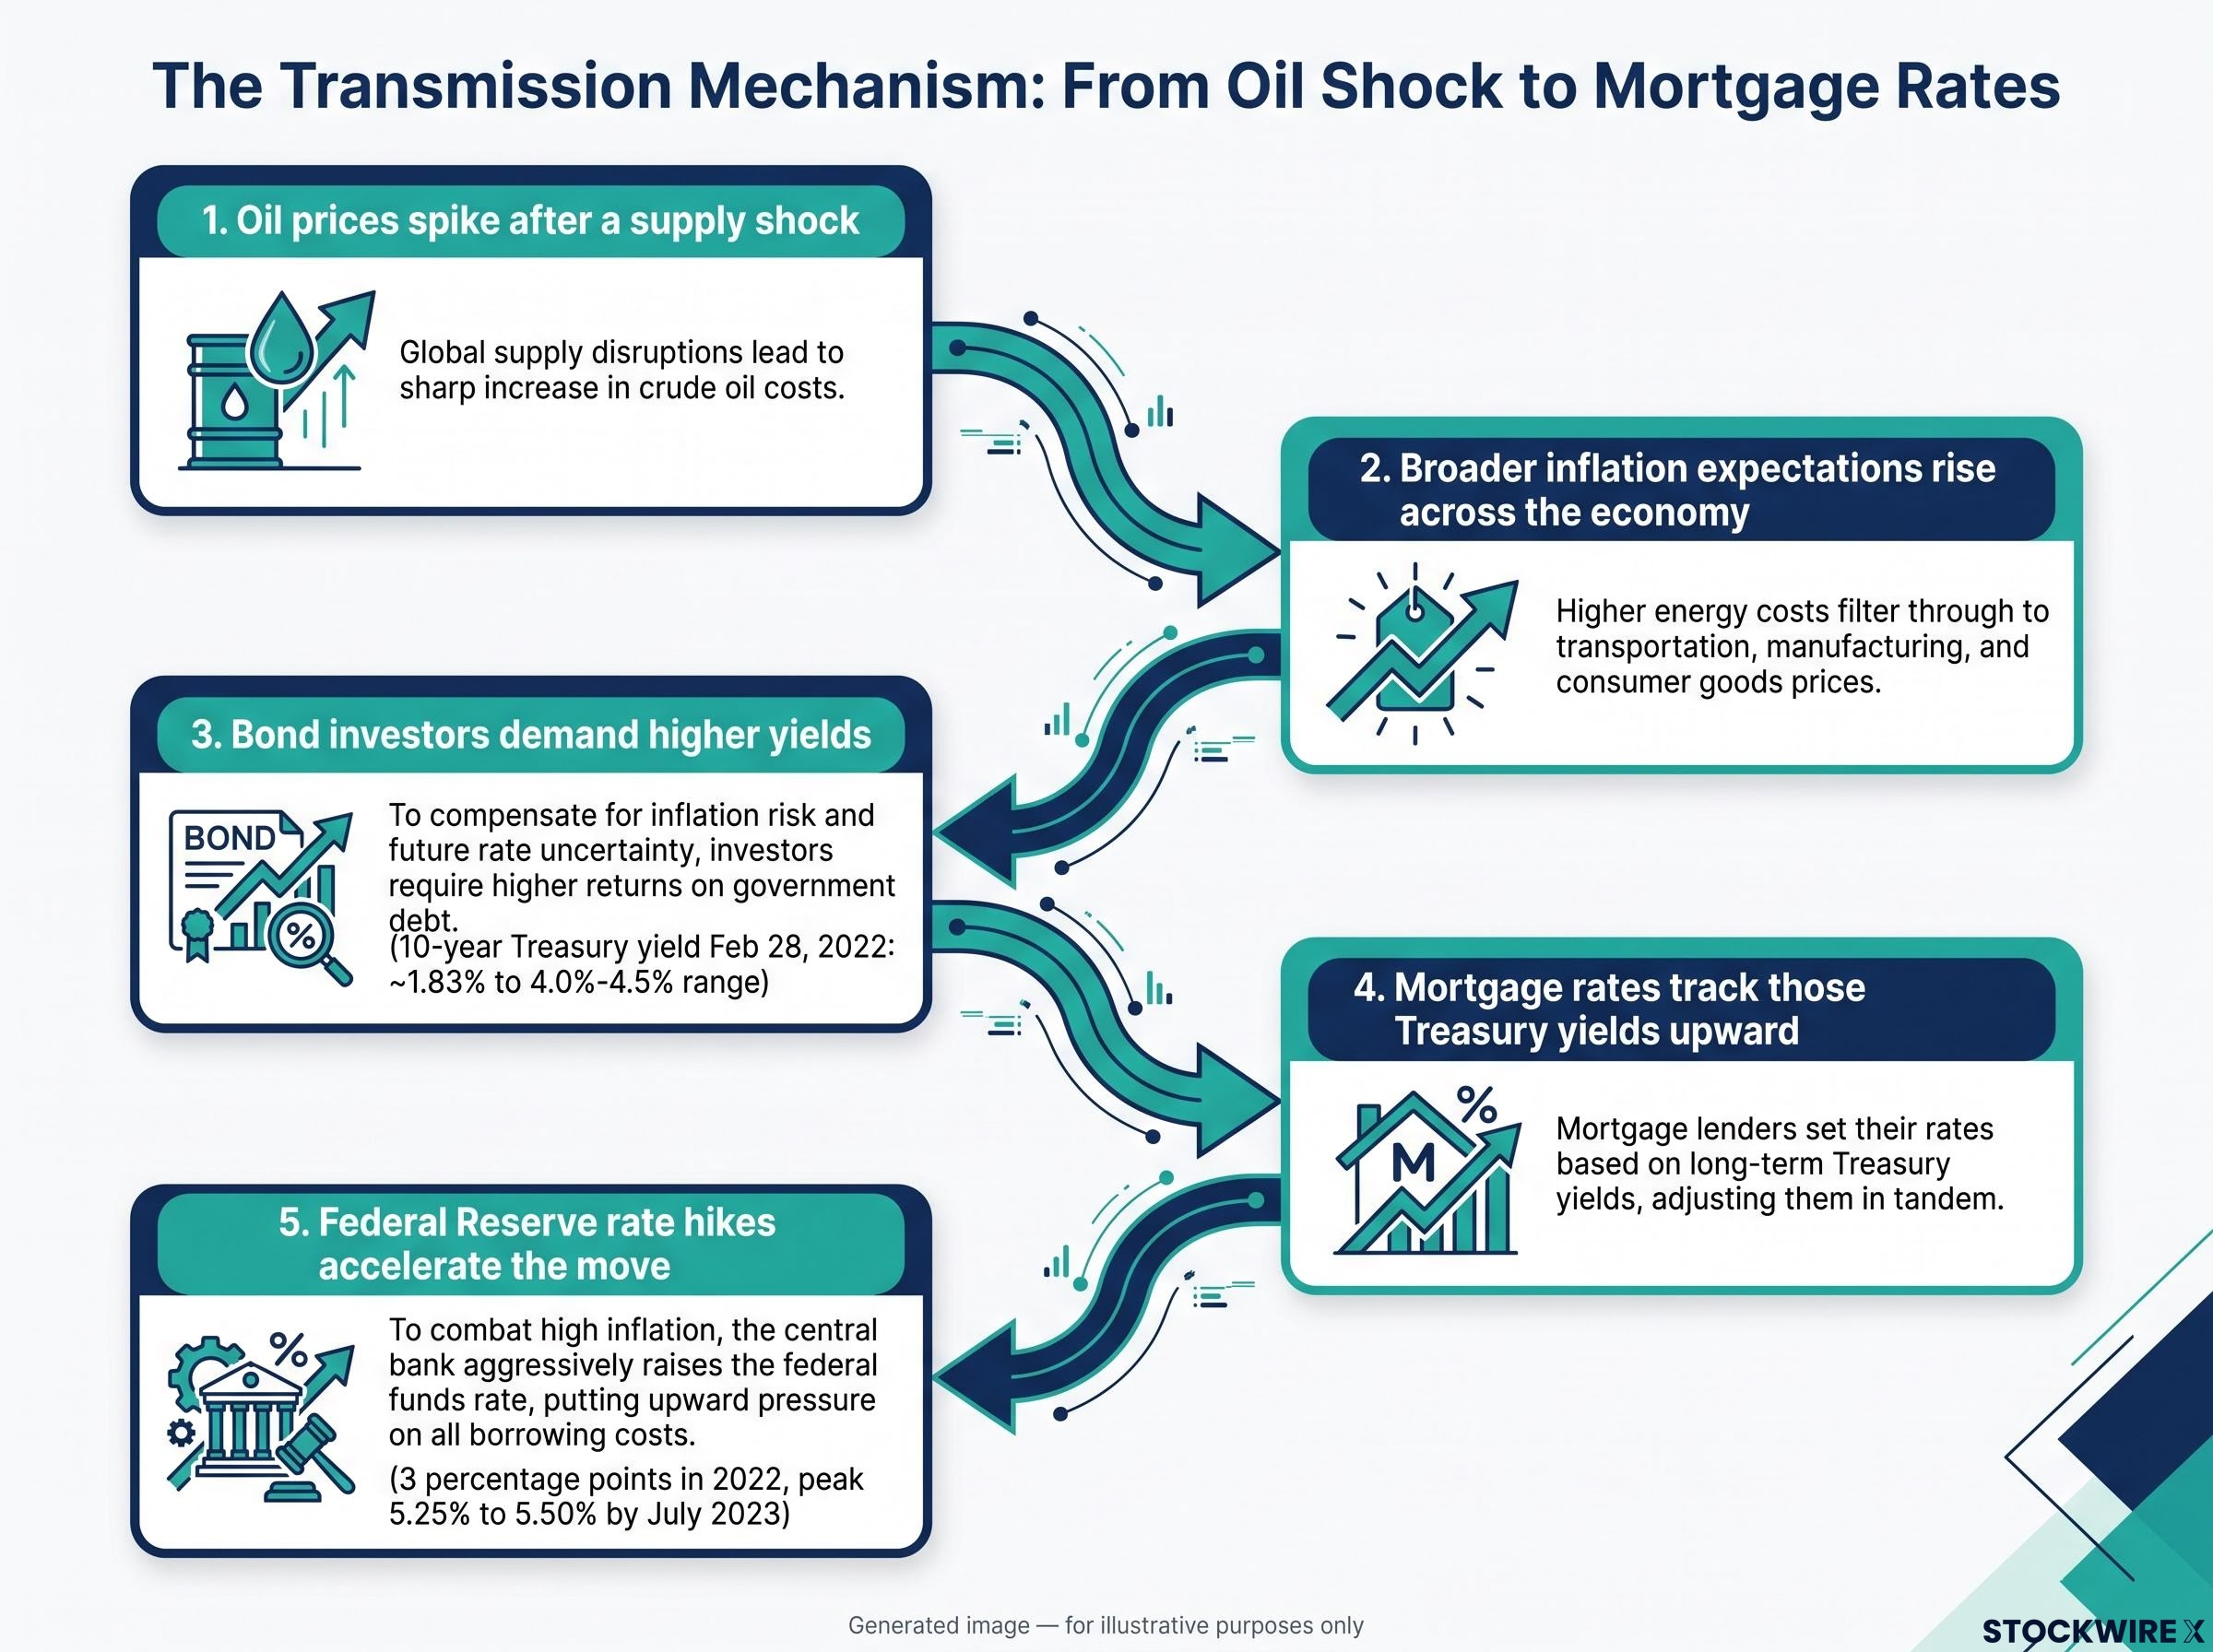
Your mortgage rate is not really set at a bank branch. It is the output of a global chain that starts with oil and ends with bond traders, and a shock anywhere along that chain can lift your monthly payment. Walk through it one link at a time and the connection stops feeling abstract.
Here is the full sequence:
- Oil prices spike after a supply shock.
- Broader inflation expectations rise across the economy.
- Bond investors demand higher yields on U.S. Treasuries.
- Mortgage rates track those Treasury yields upward.
- Federal Reserve rate hikes accelerate the whole move.
From the oil patch to the bond market
Oil is not just what goes in your tank. It is a raw input for transportation, manufacturing, plastics, and fertilisers, so when crude prices surge, the cost of nearly everything shipped, wrapped, or grown rises with it. Lenders and investors see that coming.
Research shows the scale of the effect. A shock that raises the real price of oil by 6% lifts the broader price level by roughly 0.2 percentage points. And gasoline price shocks alone explain about 28% of the variation in one-year inflation expectations.
That matters because inflation expectations drive investor behaviour. When markets expect higher near-term inflation, investors demand higher yields on the money they lend, to protect their purchasing power from being eroded. That demand shows up first in the market for U.S. Treasuries, the government bonds that anchor almost every other interest rate in the economy.
From the bond market to your front door
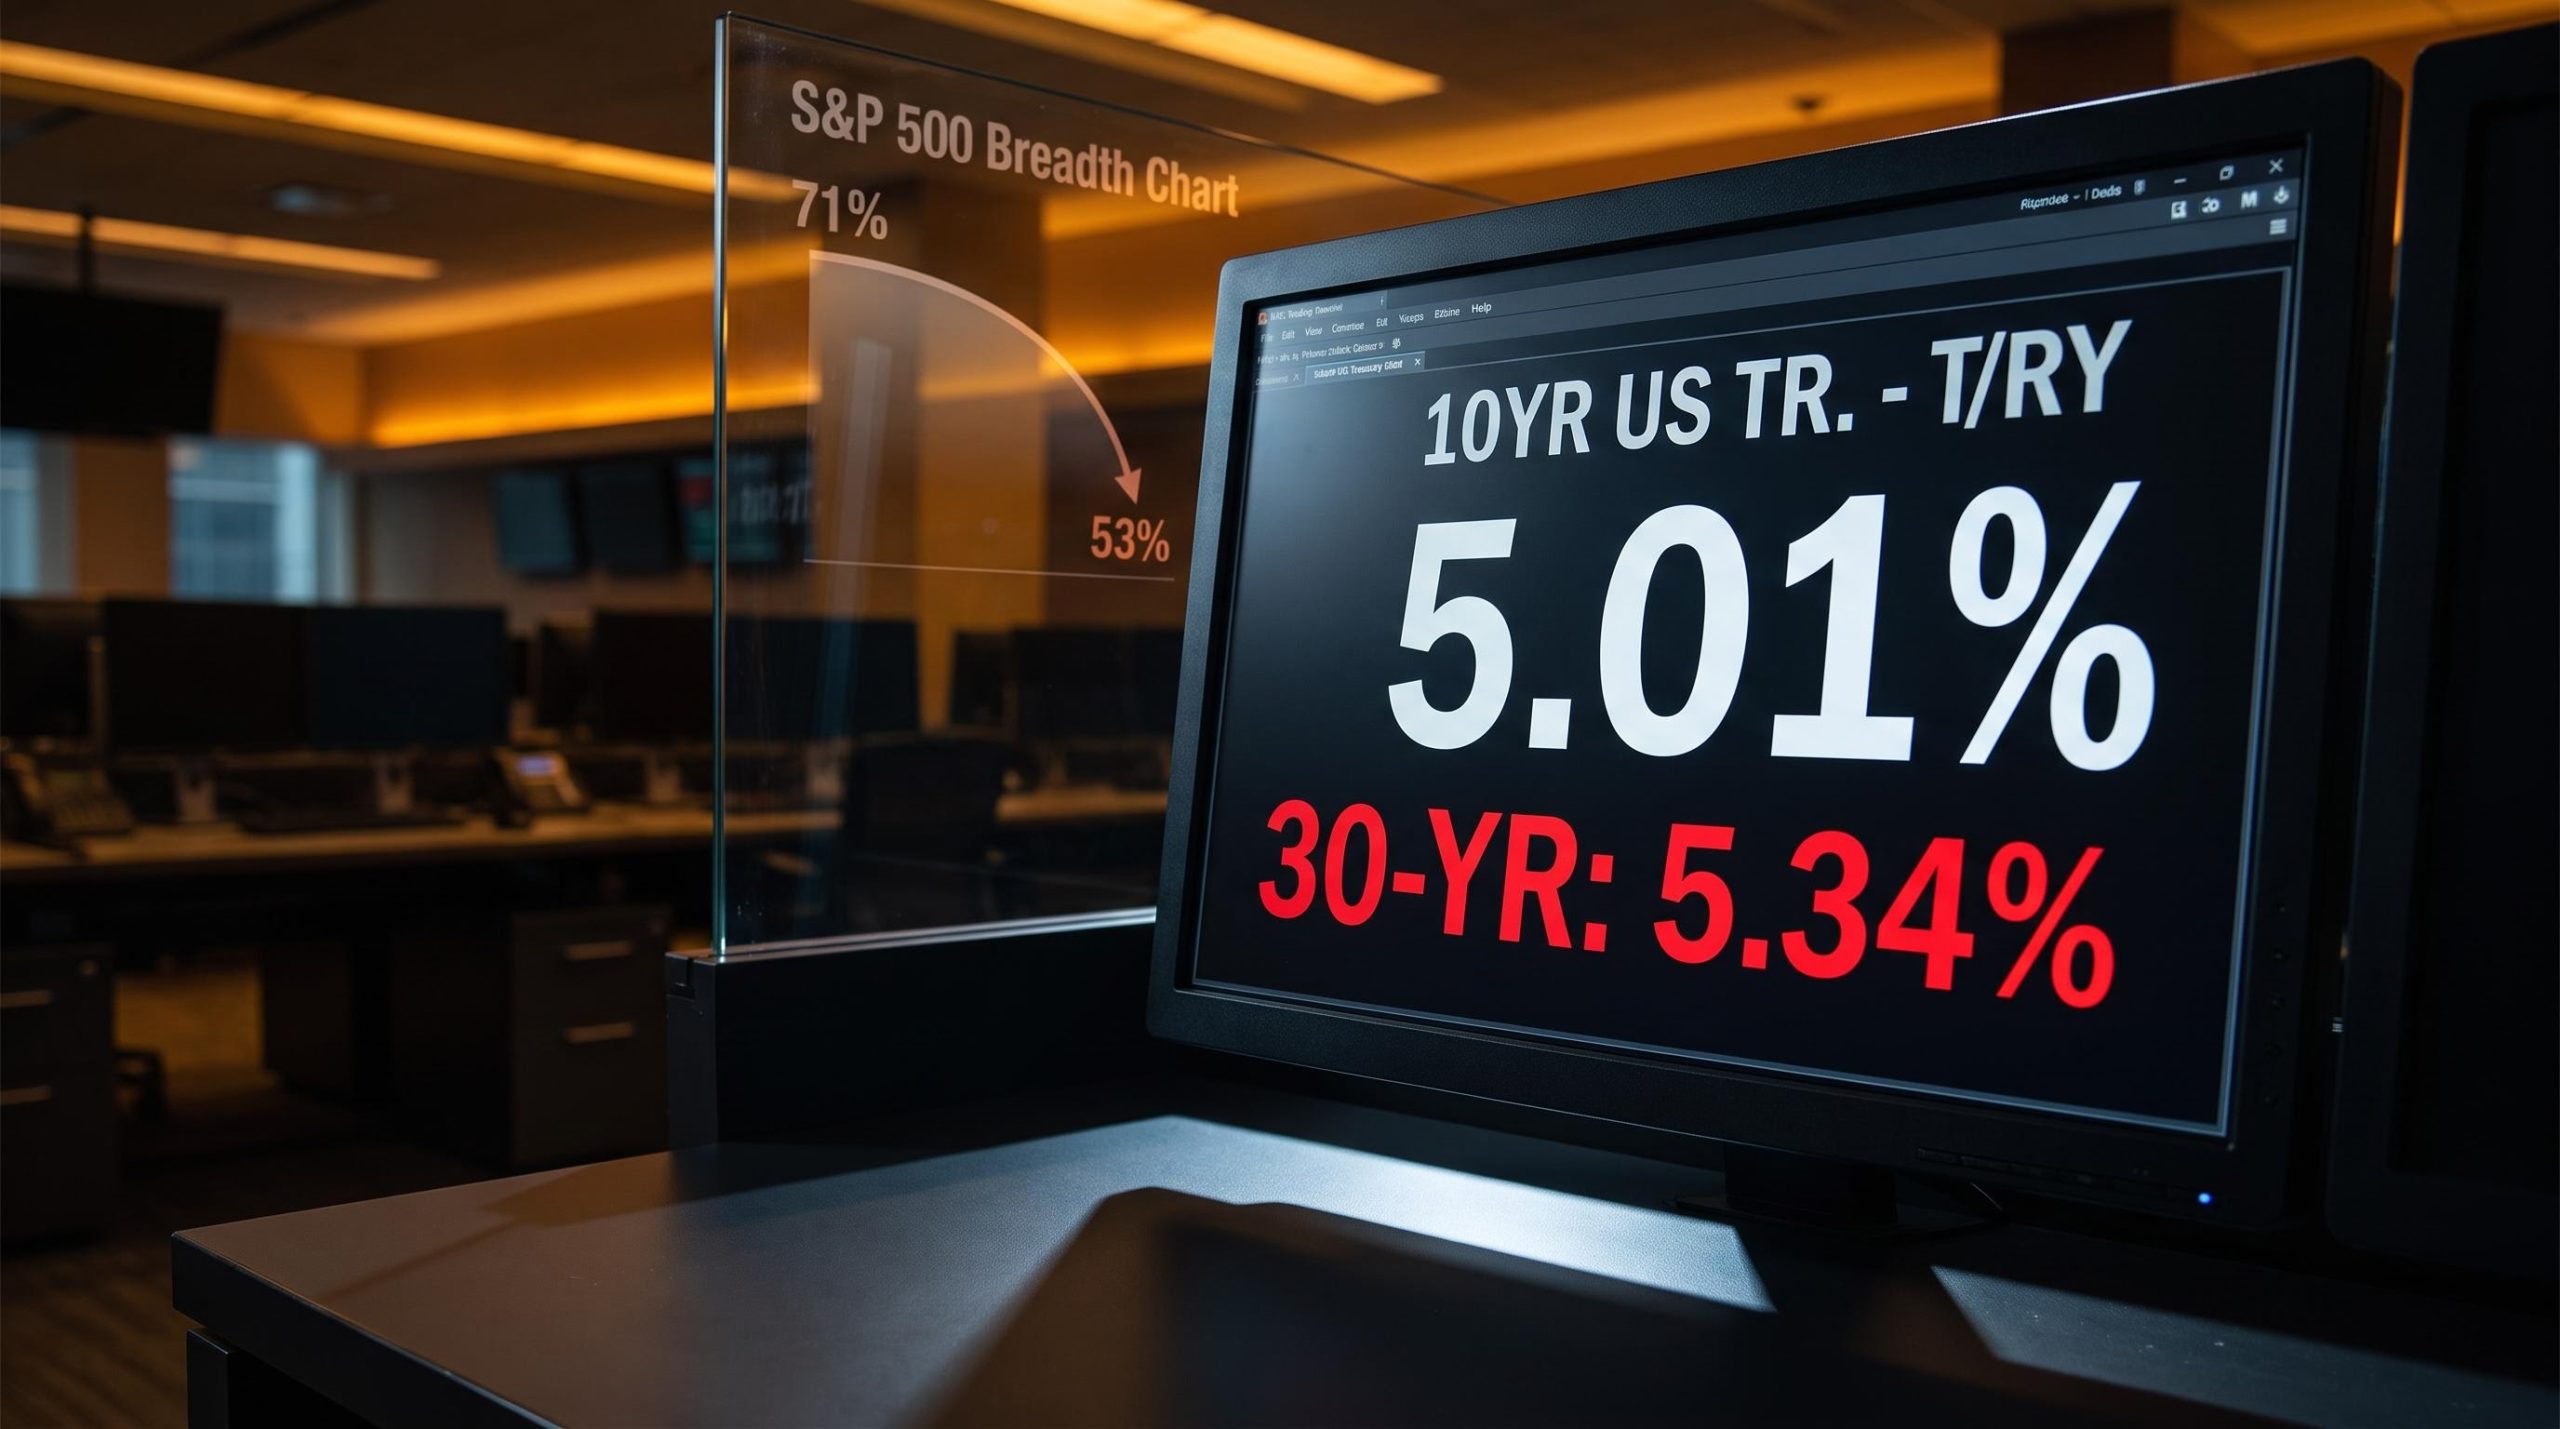
The 10-year U.S. Treasury yield closed near 1.83% on 28 February 2022, the day after hostilities began. By early March it had climbed to around 2.0%, and it eventually pushed into a 4.0% to 4.5% range, at times threatening to breach 5% during oil spikes.
The 10-year Treasury yield is the mechanical anchor for every 30-year fixed mortgage rate, with lenders historically pricing in a spread of roughly 2 percentage points above it, meaning bond market moves translate directly and quickly into what you will pay on a home loan.
U.S. mortgage rates track that 10-year yield closely. As investors sold Treasuries and yields rose, mortgage rates followed almost in lockstep. The gap widened further as mortgage-backed securities spreads grew, tied to the Fed winding down its bond purchases.
Then the Fed itself piled on. Fighting 40-year-high inflation, the central bank raised its policy rate by 3 percentage points in 2022 alone, part of 11 hikes over two years that carried the target range to a peak of 5.25% to 5.50% by July 2023. Economists overwhelmingly attribute the bulk of the mortgage surge to that domestic tightening, with the conflict acting as an amplifier on energy and food prices rather than the sole cause. Either way, the result reached your front door: a higher rate on any loan you signed.
What rising rates actually cost a homebuyer in dollar terms
Now the arithmetic, because this is where the fuel comparison lands with force. Take the 2022 median existing-home price of $429,100 with a standard 20% down payment. That leaves a loan of $343,280.
At the pre-war rate of roughly 3.9%, the monthly principal-and-interest payment on that loan runs about $1,630. Push the rate into the 6.5% to 7% range that prevailed later in the cycle, and the same loan costs several hundred dollars more every month. The difference is many times larger than the fuel increase.
Remember the fuel number: about $45 a month. A move from a 3.9% mortgage to a 6.5% one adds several hundred dollars a month, and it does not reverse in a few weeks when a conflict cools.
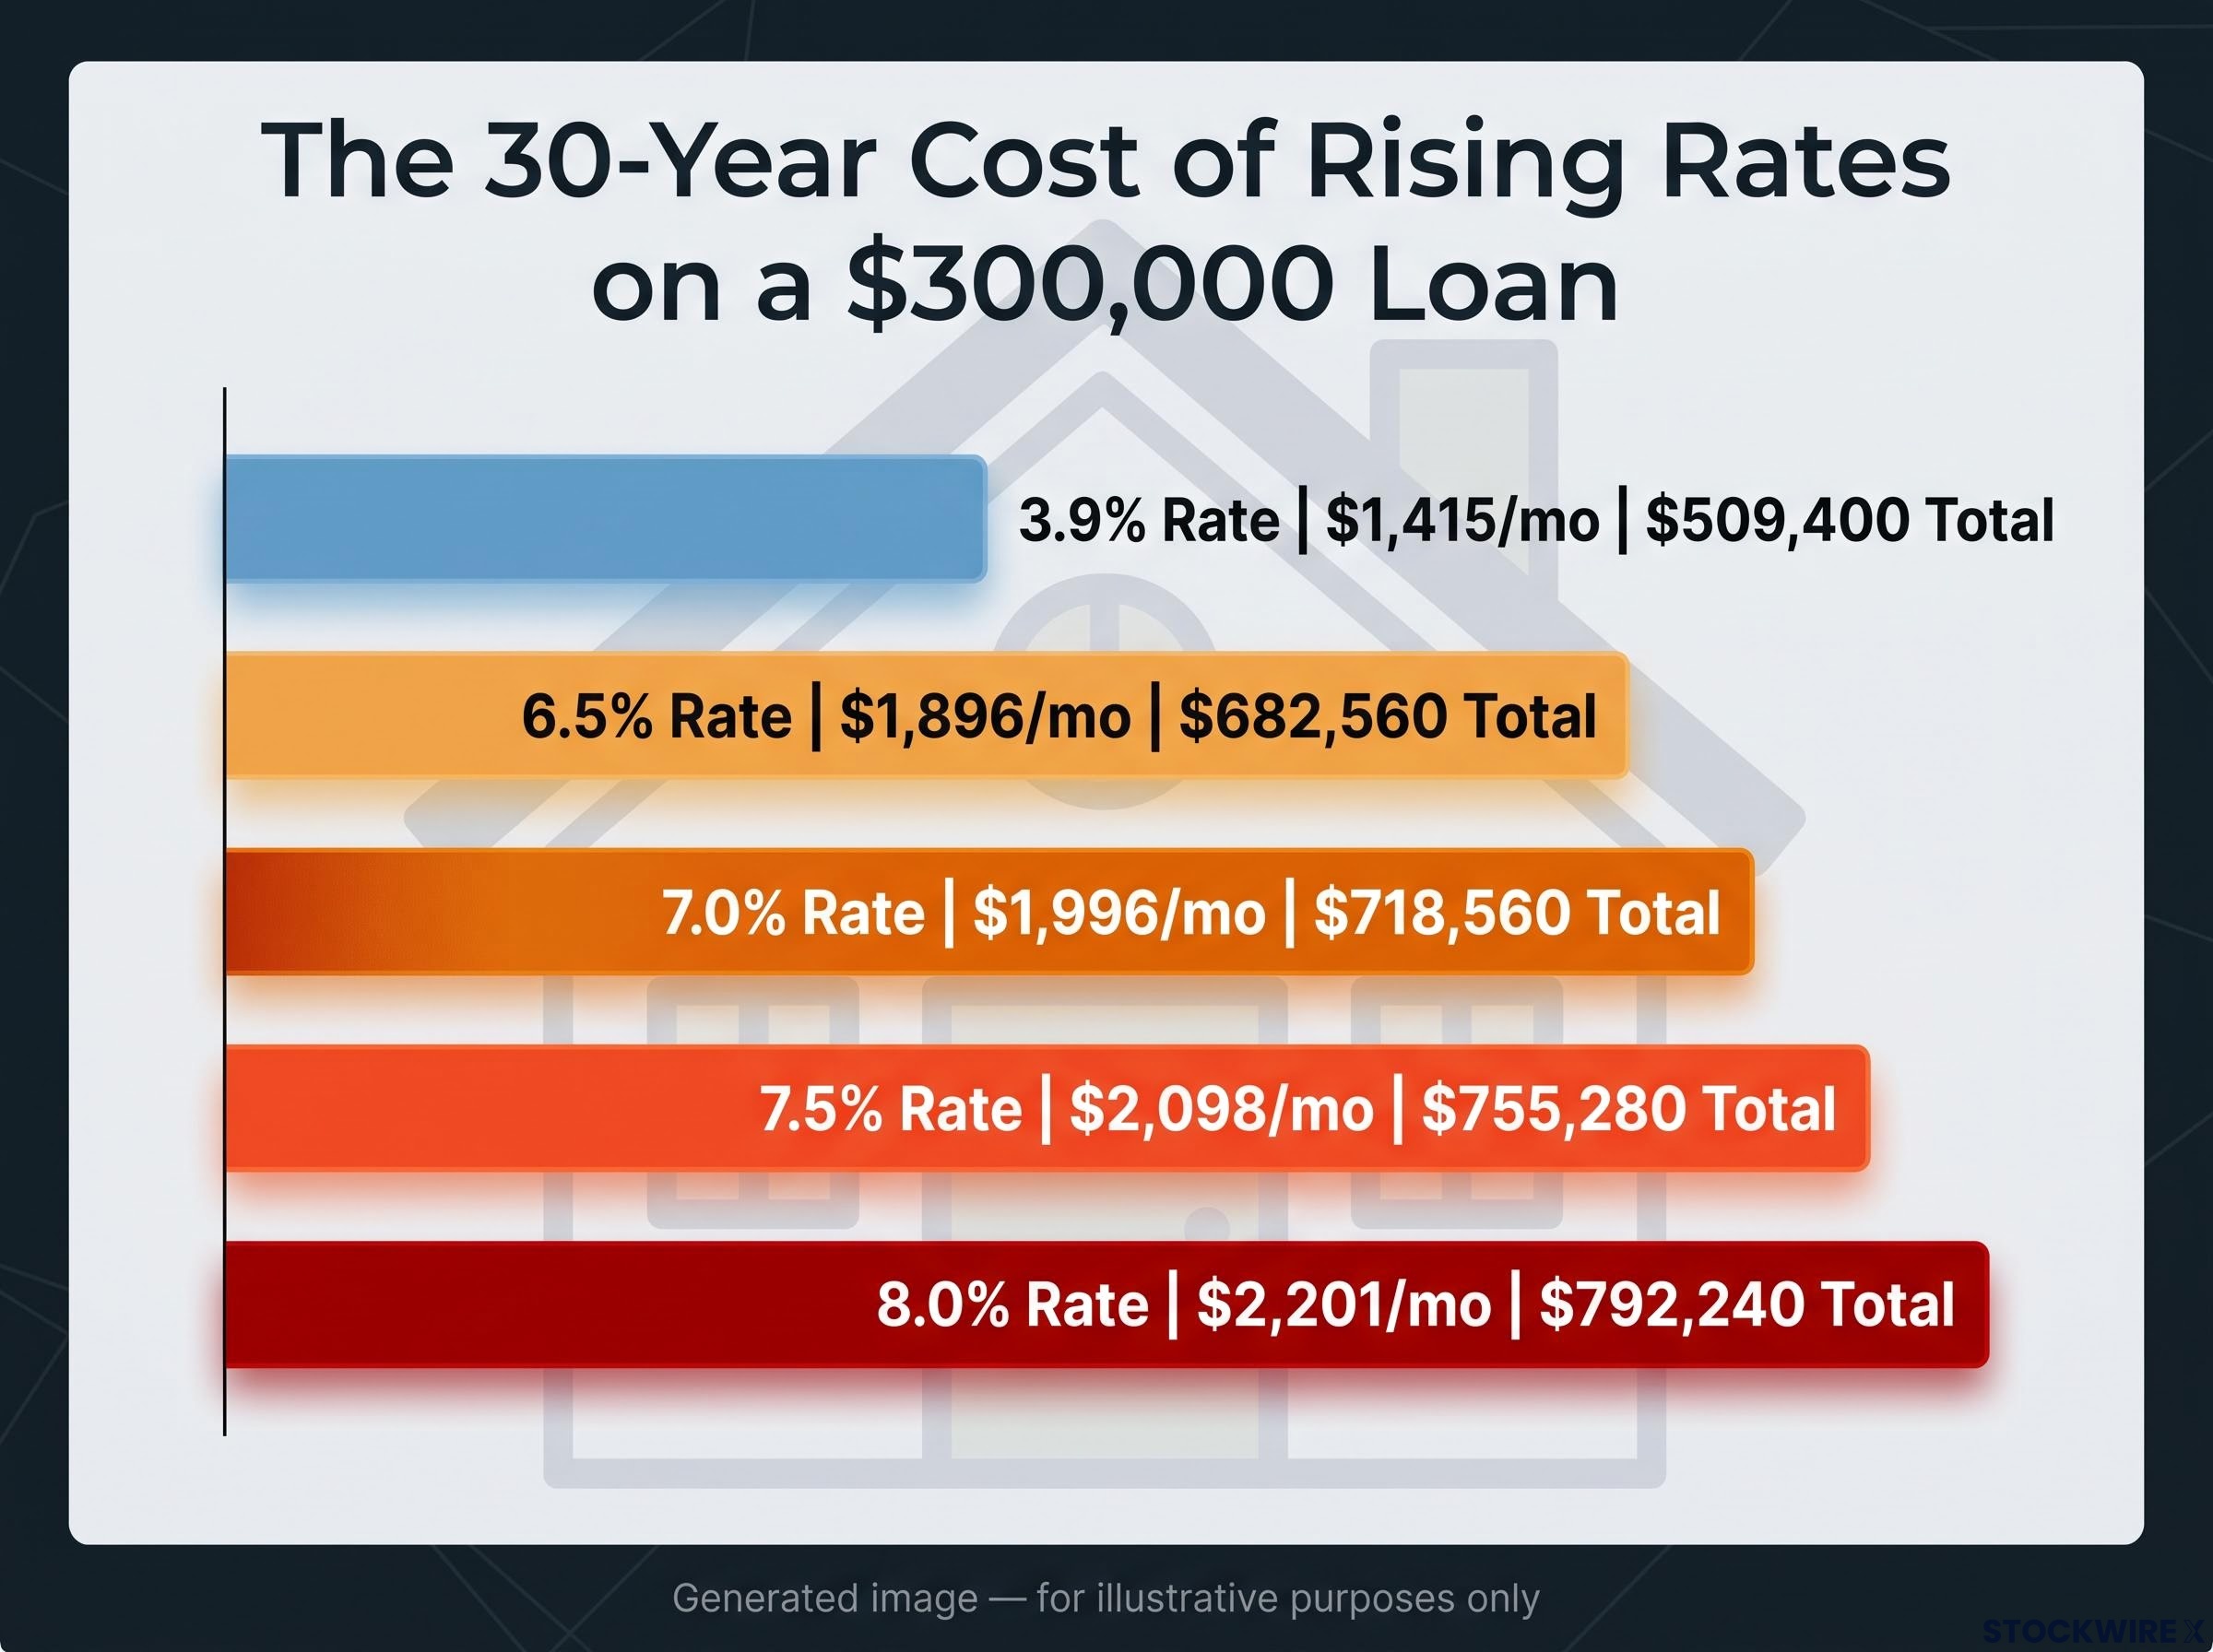
To see how sensitive this is, use a rounder $300,000 loan. Roughly every 0.5 percentage point of rate adds about $100 to the monthly payment. The table below shows the payment at each rate, the annual cost, and the full 30-year total.
| Mortgage Rate | Monthly Payment ($300,000 loan) | Annual Cost | 30-Year Total Cost |
|---|---|---|---|
| 3.9% | $1,415 | $16,980 | $509,400 |
| 6.5% | $1,896 | $22,752 | $682,560 |
| 7.0% | $1,996 | $23,952 | $718,560 |
| 7.5% | $2,098 | $25,176 | $755,280 |
| 8.0% | $2,201 | $26,412 | $792,240 |
Look at the far-right column. Moving from a 3.9% world to a 7% world adds more than $200,000 in interest over the full term of a $300,000 loan. That is not a rounding error against a $543 fuel bill. It is a different order of magnitude entirely.
If you are renting or weighing a move right now, this is the number that should shape your decision. As of the week of 10 September 2026, the 30-year fixed rate averaged 6.76%, so this is not a history lesson. It is the environment you would be borrowing into today, and it commits you to a cost that compounds across three decades.
The Freddie Mac 30-year fixed rate mortgage data, published through the Federal Reserve Bank of St. Louis, shows the historical progression of rates from the pre-war low near 3.9% through the 2022-2023 peak range and into the current 6.76% environment, making the full trajectory visible in a single series.
The lock-in trap: why rising rates do not hurt all homeowners equally
Rising rates do not fall on everyone the same way. Where you sit in the housing market decides whether they are a background nuisance or a life-altering event, and that unevenness is the whole story of this cycle.
Start with the mechanism. A fixed-rate mortgage does not reset. If you signed at 3% and market rates climb to 7%, your payment stays put. That protects existing owners from any payment shock, but it also traps them, because selling means giving up the cheap rate and buying again at the expensive one. This is the lock-in effect, sometimes called golden handcuffs.
The numbers show how widespread it is. Roughly 85% to 86% of U.S. homeowners with a mortgage hold a rate below 6%, and nearly half, about 49.9%, carry a rate at or below 4%. Around 82% of homeowners report feeling locked in by these low rates.
Three groups feel the rate cycle very differently:
- Existing owners with sub-4% mortgages: Largely insulated on their monthly payments, but effectively stuck, because moving means repricing their entire loan at today’s rates.
- New buyers entering at 6-7% rates: Fully exposed, paying the higher cost from day one with no legacy rate to fall back on.
- Must-move households: Bearing the full transition cost regardless of their old rate. One such household could see payments jump from roughly $1,400 to over $2,600, purely from the rate difference.
Find yourself in that list. If you already own at a low rate and mobility is optional, rising rates barely touch your monthly budget. If you must buy or must move, they hit you at full force.
What lock-in means for the broader housing market
The lock-in effect does not stay contained to individual households. When millions of owners refuse to sell, supply dries up. Research indicates that for every percentage point current rates exceed a borrower’s locked-in rate, the probability of that owner selling falls by 18.1%.
Multiply that across the market and the consequences are large. The lock-in effect is estimated to have reduced national home sales by over one million transactions and propped up prices by an estimated 5% to 6% by choking off supply. That price support reaches even renters and non-movers, who face a more expensive market than they otherwise would.
There is a sign of easing, though. By early 2026, the share of homeowners with mortgages at 6% and higher finally exceeded the share below 3%, a signal that the bottleneck is slowly loosening. Legacy low-rate loans will still constrain mobility for years, but the grip is beginning to relax.
The housing market lock-in effect has compressed supply so severely that new single-family sales fell 17.6% in January 2026 to their lowest level since 2013, yet broader GDP growth held, because residential construction’s direct contribution to the economy has shrunk to the low single digits from its pre-crisis peak.
The bond portfolio hit that most investors never saw coming
If you hold a bond fund because you consider yourself a conservative investor, 2022 may have delivered a nasty surprise you never quite explained to yourself. Your bonds fell, and it was not a stock market problem. It was the same rate cycle, hitting a different part of your balance sheet.
Here is why it happens. When interest rates rise, newly issued bonds pay higher yields, which makes the older, lower-yielding bonds you already own less attractive. To sell them, you would have to accept a lower price. That price drop is immediate, and it happens even though the bond’s default risk is effectively zero.
The size of the hit depends on one variable: duration. Duration is a measure of how sensitive a bond or bond fund is to rate changes, expressed in years. The general principle is that for each full percentage point rates increase, a fund’s value falls by approximately the same number as its duration in years. A fund with a duration of six years loses roughly 6% when rates climb by one point.
Bond duration is the variable that separates a fund losing 5% in a rate spike from one losing 30%; it measures how many years of cash flows are at risk, and it explains why two funds both labelled ‘investment grade’ can produce dramatically different results in the same rate cycle.
That single variable explains why “safe” bonds were not uniformly safe. The table below shows how different categories fared in 2022, and what that meant for a $50,000 holding.
| Category | Approximate Duration | 2022 Price Loss | Dollar Impact on $50,000 Position |
|---|---|---|---|
| Broad U.S. Aggregate | ~6.4 years | 5-6% (initial) | $2,500-$3,000 |
| Long-Term U.S. Treasuries | Long | 20-25% | $10,000-$12,500 |
| Long-Duration Treasury ETF | Very long | ~31% | ~$15,500 |
| Short-Term Bonds (1-5 year) | Short | Under 5% | Under $2,500 |
The Bloomberg U.S. Aggregate Index carried a duration of about 6.41 years as of 21 June 2022, down from an all-time high of 6.78 years at the end of 2021. That sensitivity fed directly into its return.
The Bloomberg U.S. Aggregate Bond Index posted a total return of -13.01% in 2022. That was the worst calendar year for U.S. bonds in modern history, and it hit portfolios many investors believed were their safe money.
One important caveat: these are price losses, not permanent ones. The bonds keep paying interest, and if rates later fall, the lost value can recover. Major asset managers now consistently point to duration, not credit quality, as the most misunderstood driver of 2022’s losses. If you know your fund’s duration, you can judge whether your fixed-income allocation is positioned for the rate environment you actually expect, rather than one you assumed.
What the hidden cost framework means for the next inflationary shock
Put the three numbers side by side. The visible cost of the 2022 shock was about $543 a year in fuel. The hidden costs were a mortgage payment differential worth tens of thousands of dollars over 30 years, and a -13.01% loss on the U.S. bond benchmark. The costs you could see were the smallest ones.
That gap is the whole lesson. The most financially consequential effects of a geopolitical inflationary shock are not posted on roadside signs. They are embedded in fixed-rate commitments and in the market value of your portfolio, and they arrive quietly.
The transmission mechanism repeats. Oil moves inflation expectations, inflation expectations move Treasury yields, and Treasury yields move mortgage rates and bond prices. That pattern is not unique to the 2022 Russia-Ukraine context. It applies to the next supply shock, and the one after that.
A geopolitical risk premium embedded in crude prices is particularly volatile because it can collapse within hours of a diplomatic signal, as Goldman Sachs has estimated that $10-$20 of a given oil price spike may reflect conflict probability rather than any confirmed physical supply disruption.
So when the next conflict or oil spike hits the headlines, run through a short checklist:
- How is this likely to move inflation expectations, and therefore bond yields?
- What is the duration of my bond holdings, and how much price risk does that carry?
- Where does my housing position sit: am I a locked-in owner, a new buyer, or a must-move household?
By September 2026, 30-year fixed rates were still around 6.76%, so this environment is not history for anyone buying now. The households and investors who read 2022 correctly were not the ones watching the pump most closely. They were the ones who understood how inflationary shocks travel through markets, and positioned for it.
This article is for informational purposes only and should not be considered financial advice. Investors should conduct their own research and consult with financial professionals before making investment decisions. Past performance does not guarantee future results, and financial projections are subject to market conditions and various risk factors.