
Commonwealth Bank of Australia (ASX: CBA) just posted the kind of result most banks would frame and hang on the wall. Cash profit up, statutory profit up, dividend lifted, and for the first time on record it grew at or above system across all five of its main domestic product lines. Yet the shares have fallen roughly 12% since those numbers landed, and 14 of 16 analysts now rate the stock a sell or strong sell.
That is the tension worth sitting with. A strong operational result met with a sustained sell-off, and a professional consensus pointing to a further 16-19% decline from here.
The timing sharpens the question. The Reserve Bank of Australia lifted the cash rate to 4.35% on 5 May 2026 and, at its August meeting, explicitly kept the door open to more. By mid-September, markets were pricing roughly a 66% chance of another move. In that environment, the premium attached to Australia’s largest bank is being re-examined: is it a durable quality signal, or a structural vulnerability?
What follows sets out the four variables driving the bearish case, valuation multiples, margin trajectory, macro conditions, and analyst consensus, and identifies exactly what would need to change for that thesis to be wrong.
What the FY26 numbers actually showed, and why the market sold anyway
Take the FY26 result on its own terms first. In its full-year numbers released in mid-August 2026, CBA reported the following:
- Cash net profit after tax (NPAT) rose 7%, with statutory NPAT up 8%
- Operating income grew 6.2%
- Group net interest margin (NIM) came in at 2.05%, down 3 basis points from 2.08% in FY25
- A fully franked final dividend of $2.70 per share, taking the annual payout to $5.05, a 20-cent lift on the prior year
CBA also disclosed something it had never achieved before: growth at or above system across all five of its primary domestic segments, spanning home lending, business lending, consumer finance, household deposits, and business deposits.
On any reasonable reading, that is competent execution. So why the sell-off?
Part of the answer sits in what management said next. The bank paired its result with a restrained forward view, flagging subdued consumer spending and a slower pace of economic growth.
Management signalled that consumer spending remains subdued and economic expansion is slowing, a note of caution that weighed more heavily than the headline numbers suggested it should.
The deeper answer is about price. CBA trades on a forward price-to-earnings (P/E) multiple of around 24.6x, a level that prices in something exceptional. The FY26 result confirmed competence, not exceptionalism.
That distinction is what the reader needs to hold onto. 7% earnings growth is creditable in isolation, but the market was not selling the result. It was selling the gap between what the price implied and what the numbers actually delivered. When a stock is priced for the extraordinary, a merely solid outcome becomes a disappointment.
When big ASX news breaks, our subscribers know first
A valuation built for a different bank than the one reporting
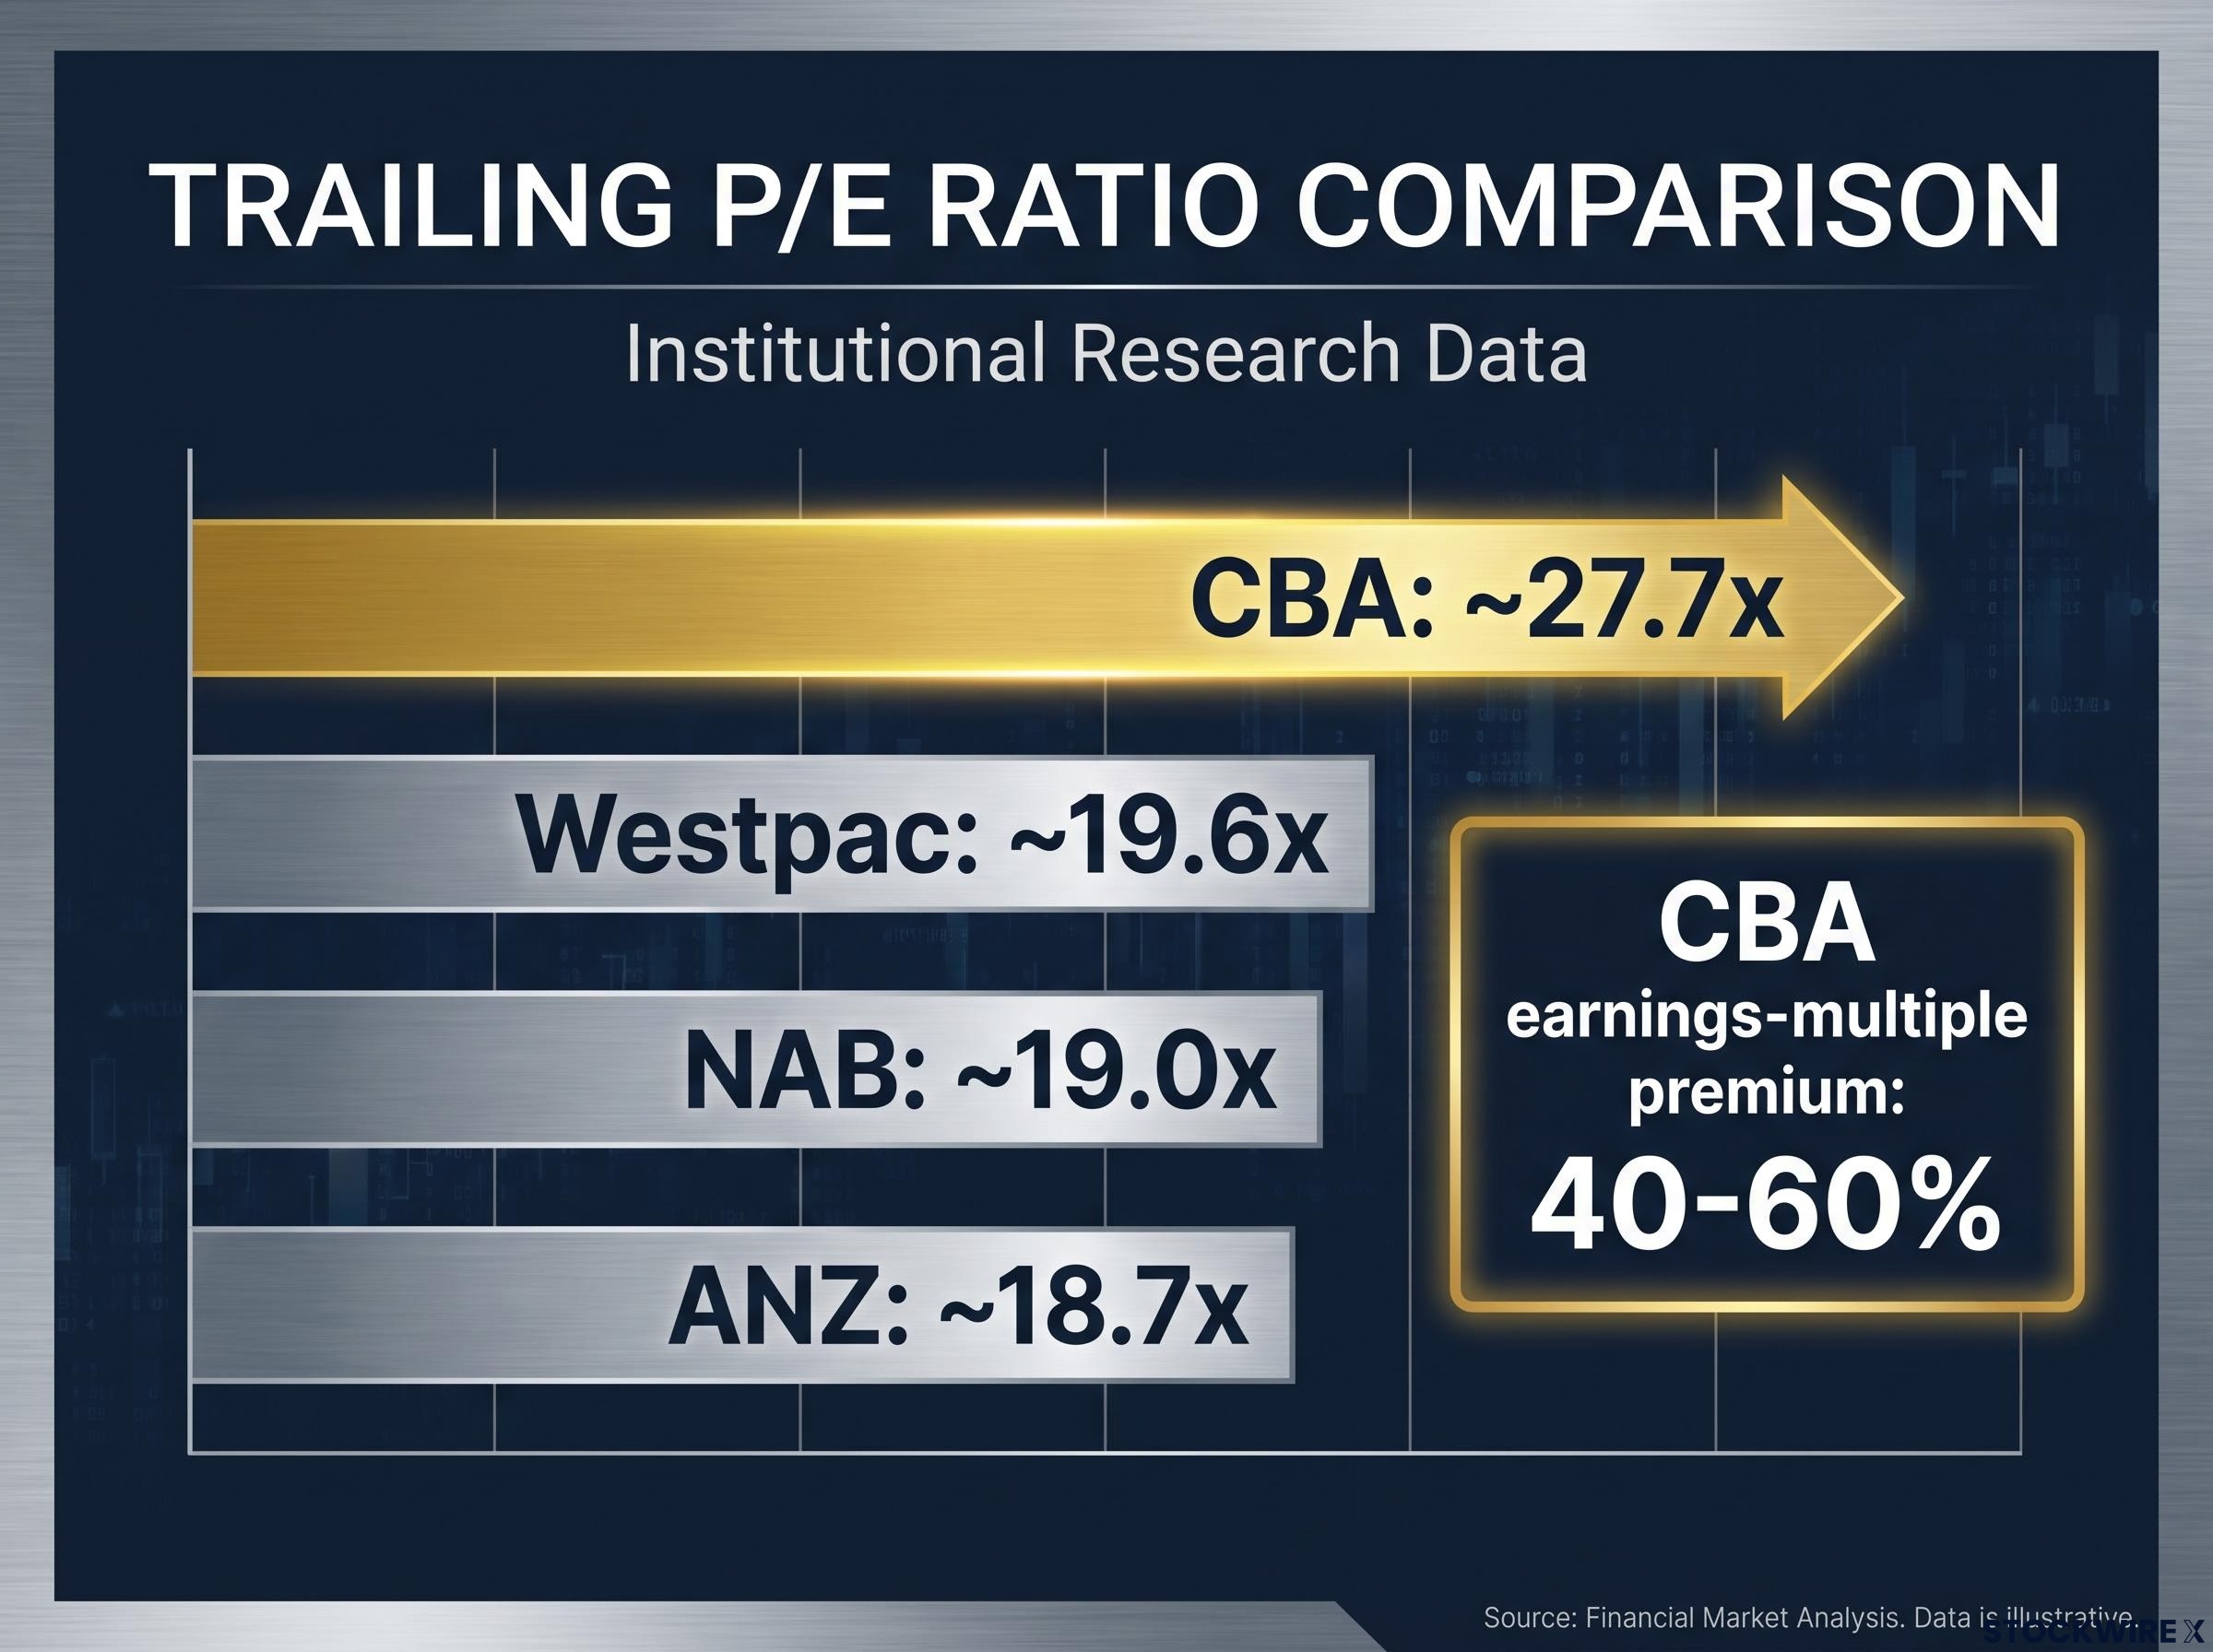
The valuation gap is best understood by letting the numbers stack up. CBA’s trailing P/E sits around 27.7x, with a price-to-book (P/B) ratio, which measures the share price against the accounting value of the bank’s net assets, of roughly 3.5x to 3.73x.
Now place that beside the other majors.
| Bank | Trailing P/E | Price-to-book | Consensus rating |
|---|---|---|---|
| CBA | ~27.7x | ~3.5x-3.73x | Sell / strong sell |
| Westpac | ~19.6x | Below CBA | Preferred on valuation |
| NAB | ~19.0x | Below CBA | Preferred on valuation |
| ANZ | ~18.7x | Below CBA | Preferred on valuation |
Market Index puts CBA’s earnings-multiple premium at 40-60% over its peers. That is not a rounding difference. It is a structural gap that requires CBA to be a fundamentally different, better business to justify.
What history says about that level
The historical comparison is where the bear case sharpens. At its pre-GFC peak in 2007, CBA traded at a P/B of around 3.5x, roughly where it sits today. The difference is what the bank was earning on that book.
In 2007, CBA carried a P/B near 3.5x while generating a return on equity (ROE) close to 20%. Today it trades at a similar multiple while producing an ROE of roughly 12.9%. The price is the same. The engine behind it is materially weaker.
That is the key signal. CBA is being valued like a high-return compounding machine at a moment when its returns no longer support that framing. Analysis by i3-invest notes that no bank has historically sustained a 3.5x P/B multiple indefinitely, and that valuation booms in banking typically precede multi-year de-ratings as growth normalises.
What brokers’ price targets are actually implying
The analyst consensus makes the magnitude legible. Market Index’s tracked brokers hold a consensus target of $125.20, implying roughly 19% downside over the following 12 months. TradingView data as of 15 September 2026 put the average target at $127.86, with the lowest individual call at $90, a 41% decline from recent levels.
Individual calls reinforce the picture. Morgans rates the stock a sell with a $99.81 target and a discounted cash flow (DCF) valuation of $96.07. Morgan Stanley and Macquarie both sit underweight, preferring NAB and ANZ on valuation grounds.
The breadth matters as much as any single number. CommSec data from June 2026 showed 14 sell ratings, two holds, and zero buys. This is not a contrarian outlier. It is the professional community’s settled position.
The sector-wide valuation gap between analyst price targets and market prices is not unique to CBA; Westpac, NAB, and ANZ all carry consensus targets below current prices, though the magnitude of the disconnect is most extreme at CBA given its 40-60% premium to peer multiples.
The margin and macro pressures that make the bear case durable
A stretched multiple can compress on its own. What makes the bear case durable rather than merely plausible is that the pressures behind CBA’s margins look structural, not cyclical.
Group NIM slipped to 2.05% in FY26, down 3 basis points on the year. The forces behind that compression are working together and are unlikely to reverse quickly:
The NIM, ROE, and CET1 bank valuation metrics form a sequential diagnostic framework: NIM reveals earnings quality, ROE tested against the cost of equity signals whether a bank is genuinely creating value, and CET1 gauges capital efficiency, each layer exposing a different dimension of CBA’s structural position.
- Intense mortgage competition. The spread between the average new variable mortgage rate and the cash rate has narrowed by about 65 basis points since December 2019, driven by cashback offers and heavy discounting.
- Shifting funding costs. Total funding costs for the major banks sat at roughly 3.76% as of March 2026, down 47 basis points since January 2025. Crucially, deposit costs move less than the cash rate in both directions, which limits how much rate changes help the margin.
- Deposit repricing. Customers are steadily shifting cash into higher-yielding term deposits. RBA analysis shows at-call deposits yielding 3.24% against term deposits at 4.15%, a mix shift that quietly drags on margins.
APRA’s quarterly ADI performance statistics for the March 2026 period confirm the sector-wide deposit mix shift the article describes, with term deposit balances growing at a materially faster rate than at-call accounts as customers respond to the sustained gap between the two yield levels.
Then there is the rate environment itself. With the cash rate at 4.35% and markets pricing a 66% chance of a further hike (NAB explicitly forecasts 4.60%), it might seem that more increases would help.
They no longer do, at least not cleanly. Earlier in a hiking cycle, rising rates widened bank margins. Now, competitive repricing on the lending side and the pass-through of higher deposit costs cap the upside. The tailwind has largely blown itself out.
Morningstar expects ongoing margin contraction of 9-10 basis points, while PwC analysis points to NIM falling 1-3 basis points per half under what it describes as a “commodity trap” of price-based competition.
Here is what that means for the investor. Margin recovery is not simply waiting on rate cuts to arrive. The competitive dynamics inside Australian banking are eroding CBA’s spread independently of the RBA cycle, which is why analysts do not expect the premium to quietly recover once policy eases.
Why the bull case still has supporters, and what would have to go right
None of this makes CBA a broken business, and the bull case deserves genuine weight rather than a dismissive nod.
Supporters lean on three specific pillars:
The qualitative factors standard models miss, including Australia’s oligopolistic banking structure, CBA’s management quality premium under CEO Matt Comyn, and early-stage digital revenue diversification, partially explain why the market has sustained a premium that earnings-based valuation frameworks consistently flag as unjustifiable.
- ROE trajectory. Morningstar projects CBA’s ROE will climb from 13.5% in FY25 to around 16% by FY30, driven by a dominant retail deposit franchise, superior organic capital generation, and strong asset quality.
- Index mechanics. As a core holding with a large passive ownership base, CBA is difficult to short at scale, and pullbacks have historically drawn in buyers.
- Income defensiveness. The $5.05 fully franked annual dividend attracts income-focused investors who value the payout independent of growth expectations.
That second point carries a real market lesson.
Bulls describe aggressively shorting CBA as a “widow-maker” trade: a bet that keeps punishing sceptics because the stock’s index weight and income appeal generate mechanical demand on any meaningful dip.
So what would have to go right for the premium to hold? Broadly, three things: ROE recovering toward 16% on Morningstar’s timeline, NIM stabilising or improving, and rate cuts arriving in a way that eases deposit cost pressure without triggering a deterioration in credit quality.
It is worth being precise about the nature of the disagreement. This is not really an argument about whether CBA is a good business. Wilsons Advisory notes CBA has historically traded at a 15-20% premium to peers; the current 40-60% premium is a significant expansion beyond that baseline. The debate is whether any price is too high, even for quality.
The read for the investor is this. The bull case depends on CBA closing the gap between its current ROE and the ROE its multiple already implies, on Morningstar’s schedule. If that trajectory slips or simply takes longer to arrive, the multiple has nowhere to go but down. And with 14 sells, two holds, and zero buys, the professional community has largely made up its mind on which way that resolves.
What the valuation gap tells investors before acting on CBA
Pull the four threads together and a coherent picture emerges. The FY26 result was solid but not exceptional. The valuation prices in exceptional. The margin dynamics are structural and working against a quick recovery. And the bull case, while real, hinges on an ROE improvement that is a forecast, not a fact.
At the 14 September 2026 close of roughly $154.97, the shares are down about 12% since results and around 5% year-to-date. The consensus target range runs from $125.20 to $127.86.
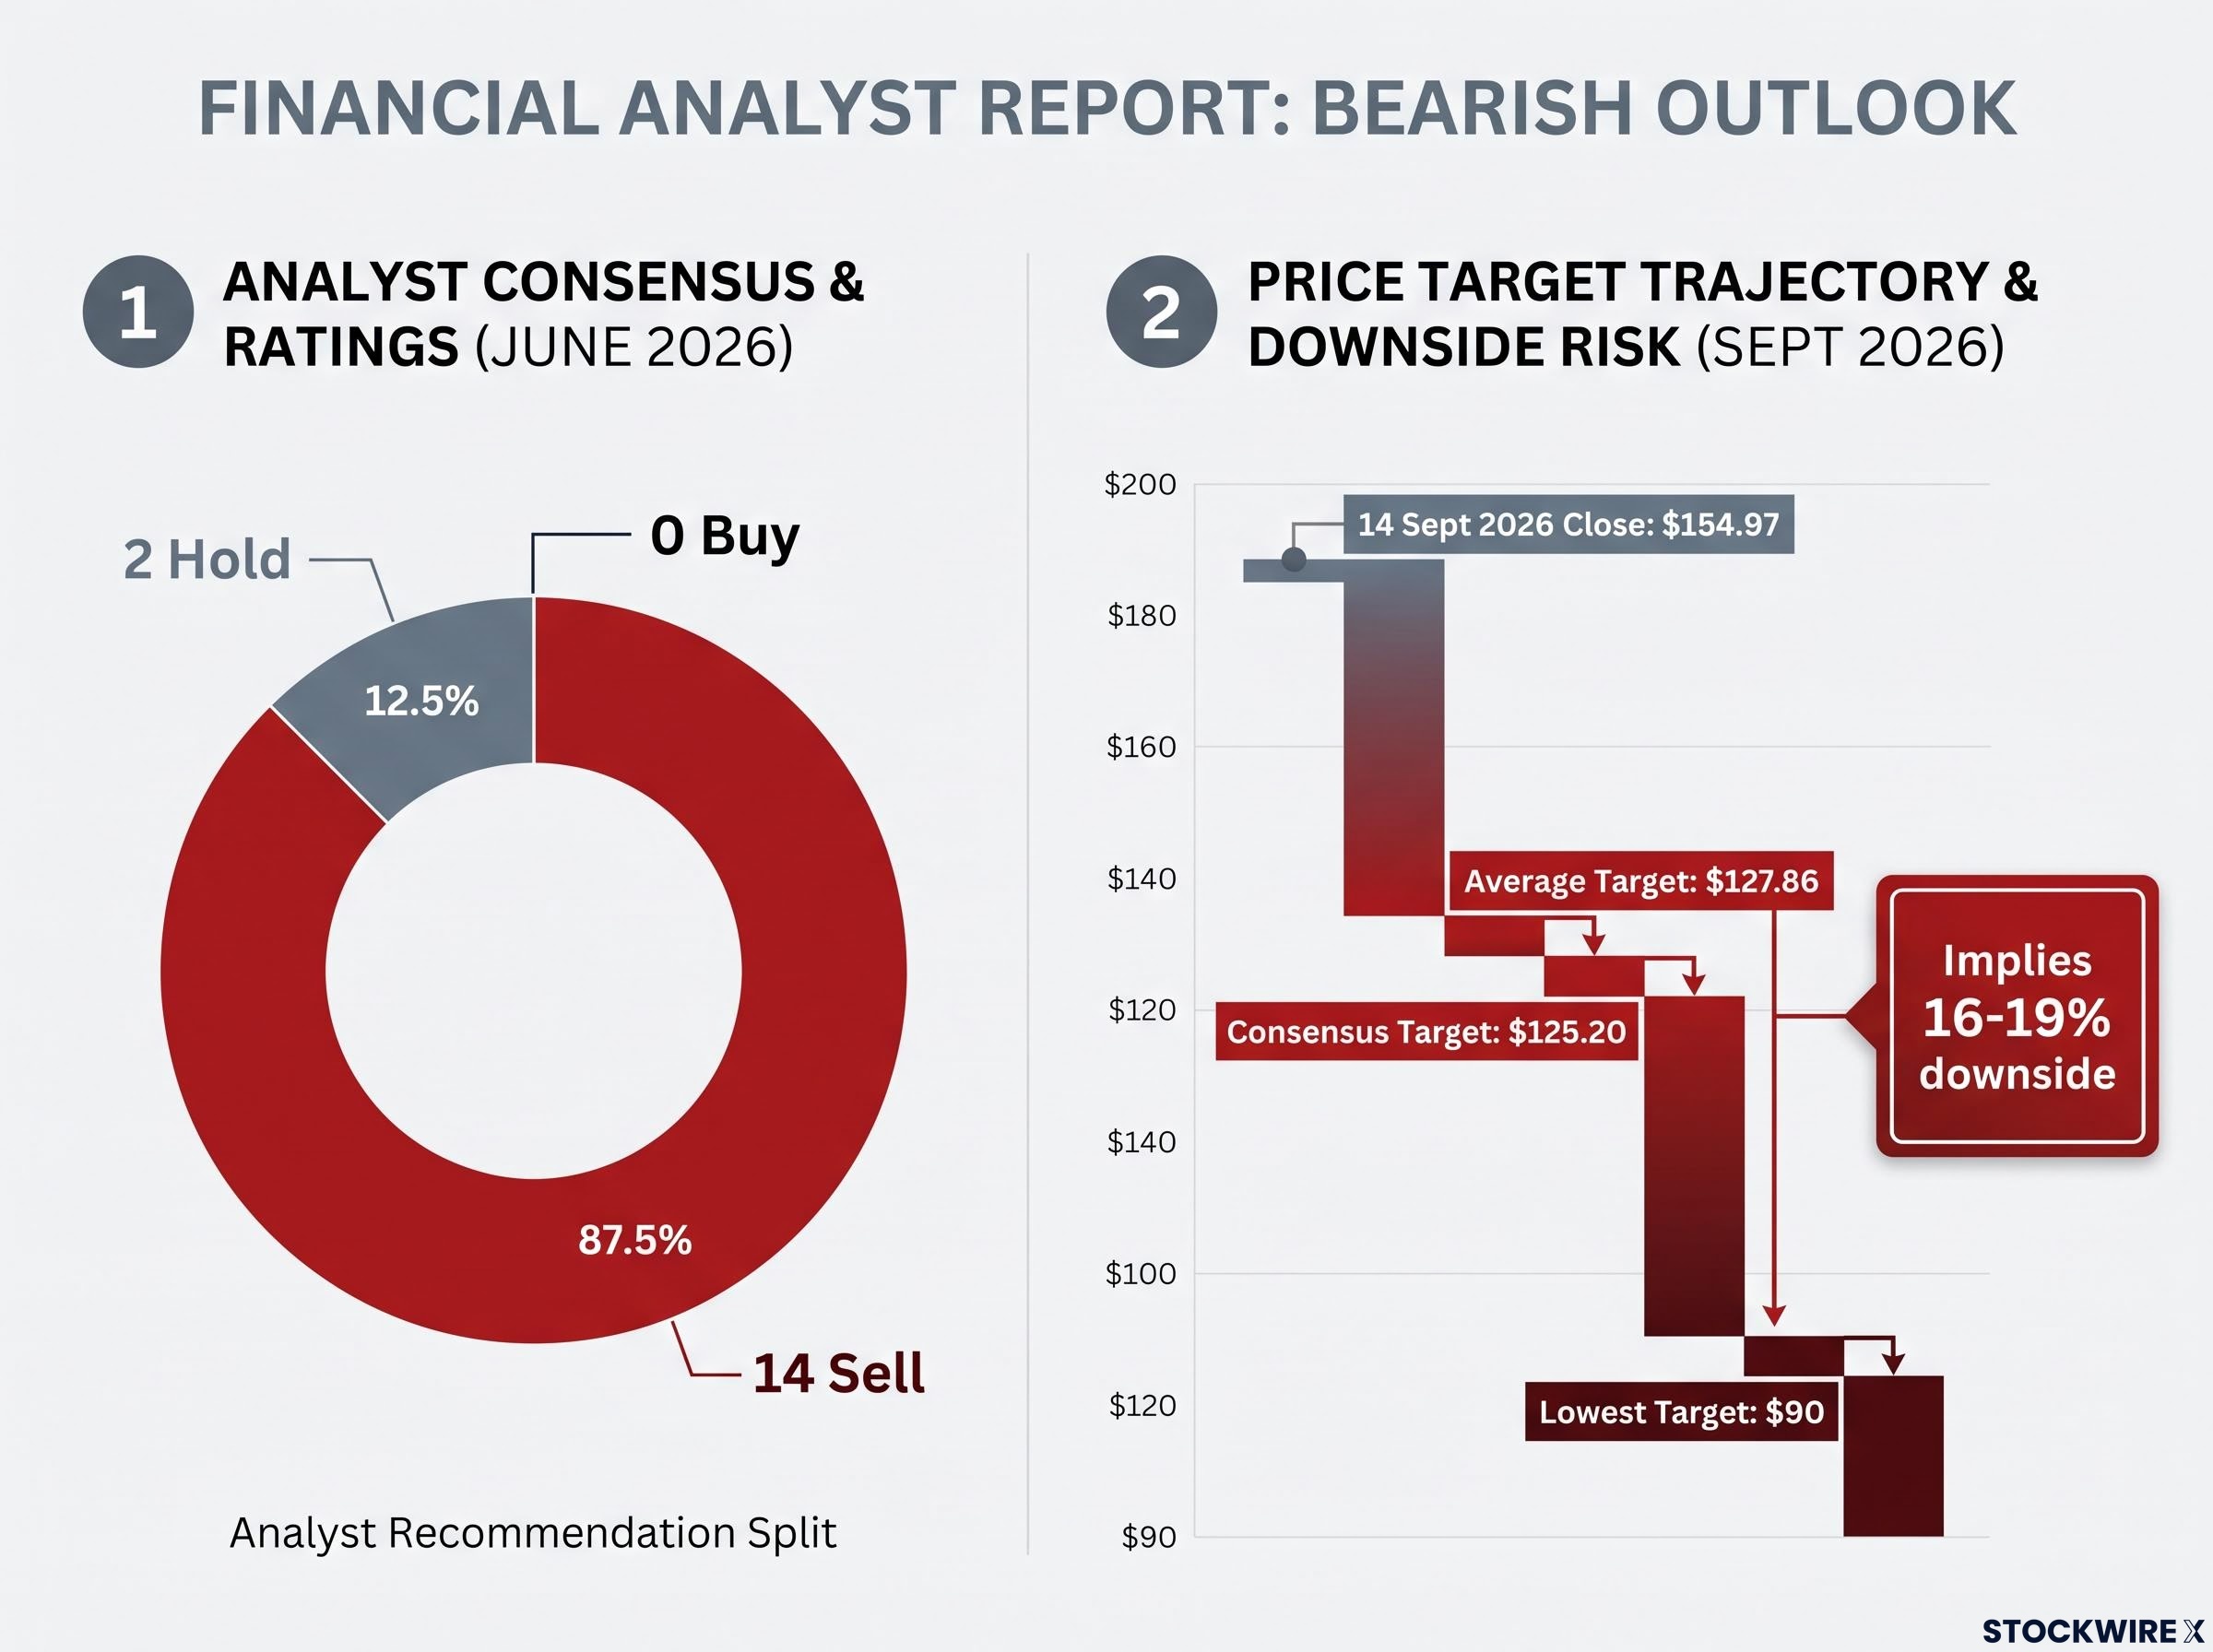
The consensus range of $125.20 to $127.86 implies a further 16-19% downside. Treat it not as a price prediction but as a signal of where analysts believe the premium will normalise if earnings growth does not re-accelerate.
Rather than reacting to the price alone, the sharper approach is to watch the specific variables that would confirm or falsify the bear case:
- The 1H27 NIM outcome. Stabilisation would challenge the structural compression thesis; further contraction would confirm it.
- The RBA rate path through late 2026. Whether the cash rate moves to 4.60% and how deposit costs respond will shape the margin picture.
- ROE progression against Morningstar’s FY30 target. Movement toward 16% supports the premium; stagnation near 12.9%-13.5% undermines it.
The analyst consensus is not a recommendation to act. It is a read on where professional capital is positioned, and it would take a genuine re-acceleration in earnings, not just another solid-but-unexceptional result, to move it.
For investors wanting to apply a structured due diligence process to the variables identified here, our comprehensive walkthrough of ASX bank stock stress-testing covers how to combine quantitative models with qualitative checks on capital adequacy, arrears trends, and macro sensitivity before reaching a position.
This article is for informational purposes only and should not be considered financial advice. Investors should conduct their own research and consult with financial professionals before making investment decisions. Past performance does not guarantee future results. Financial projections are subject to market conditions and various risk factors, and forward-looking statements are speculative and subject to change based on market developments and company performance.