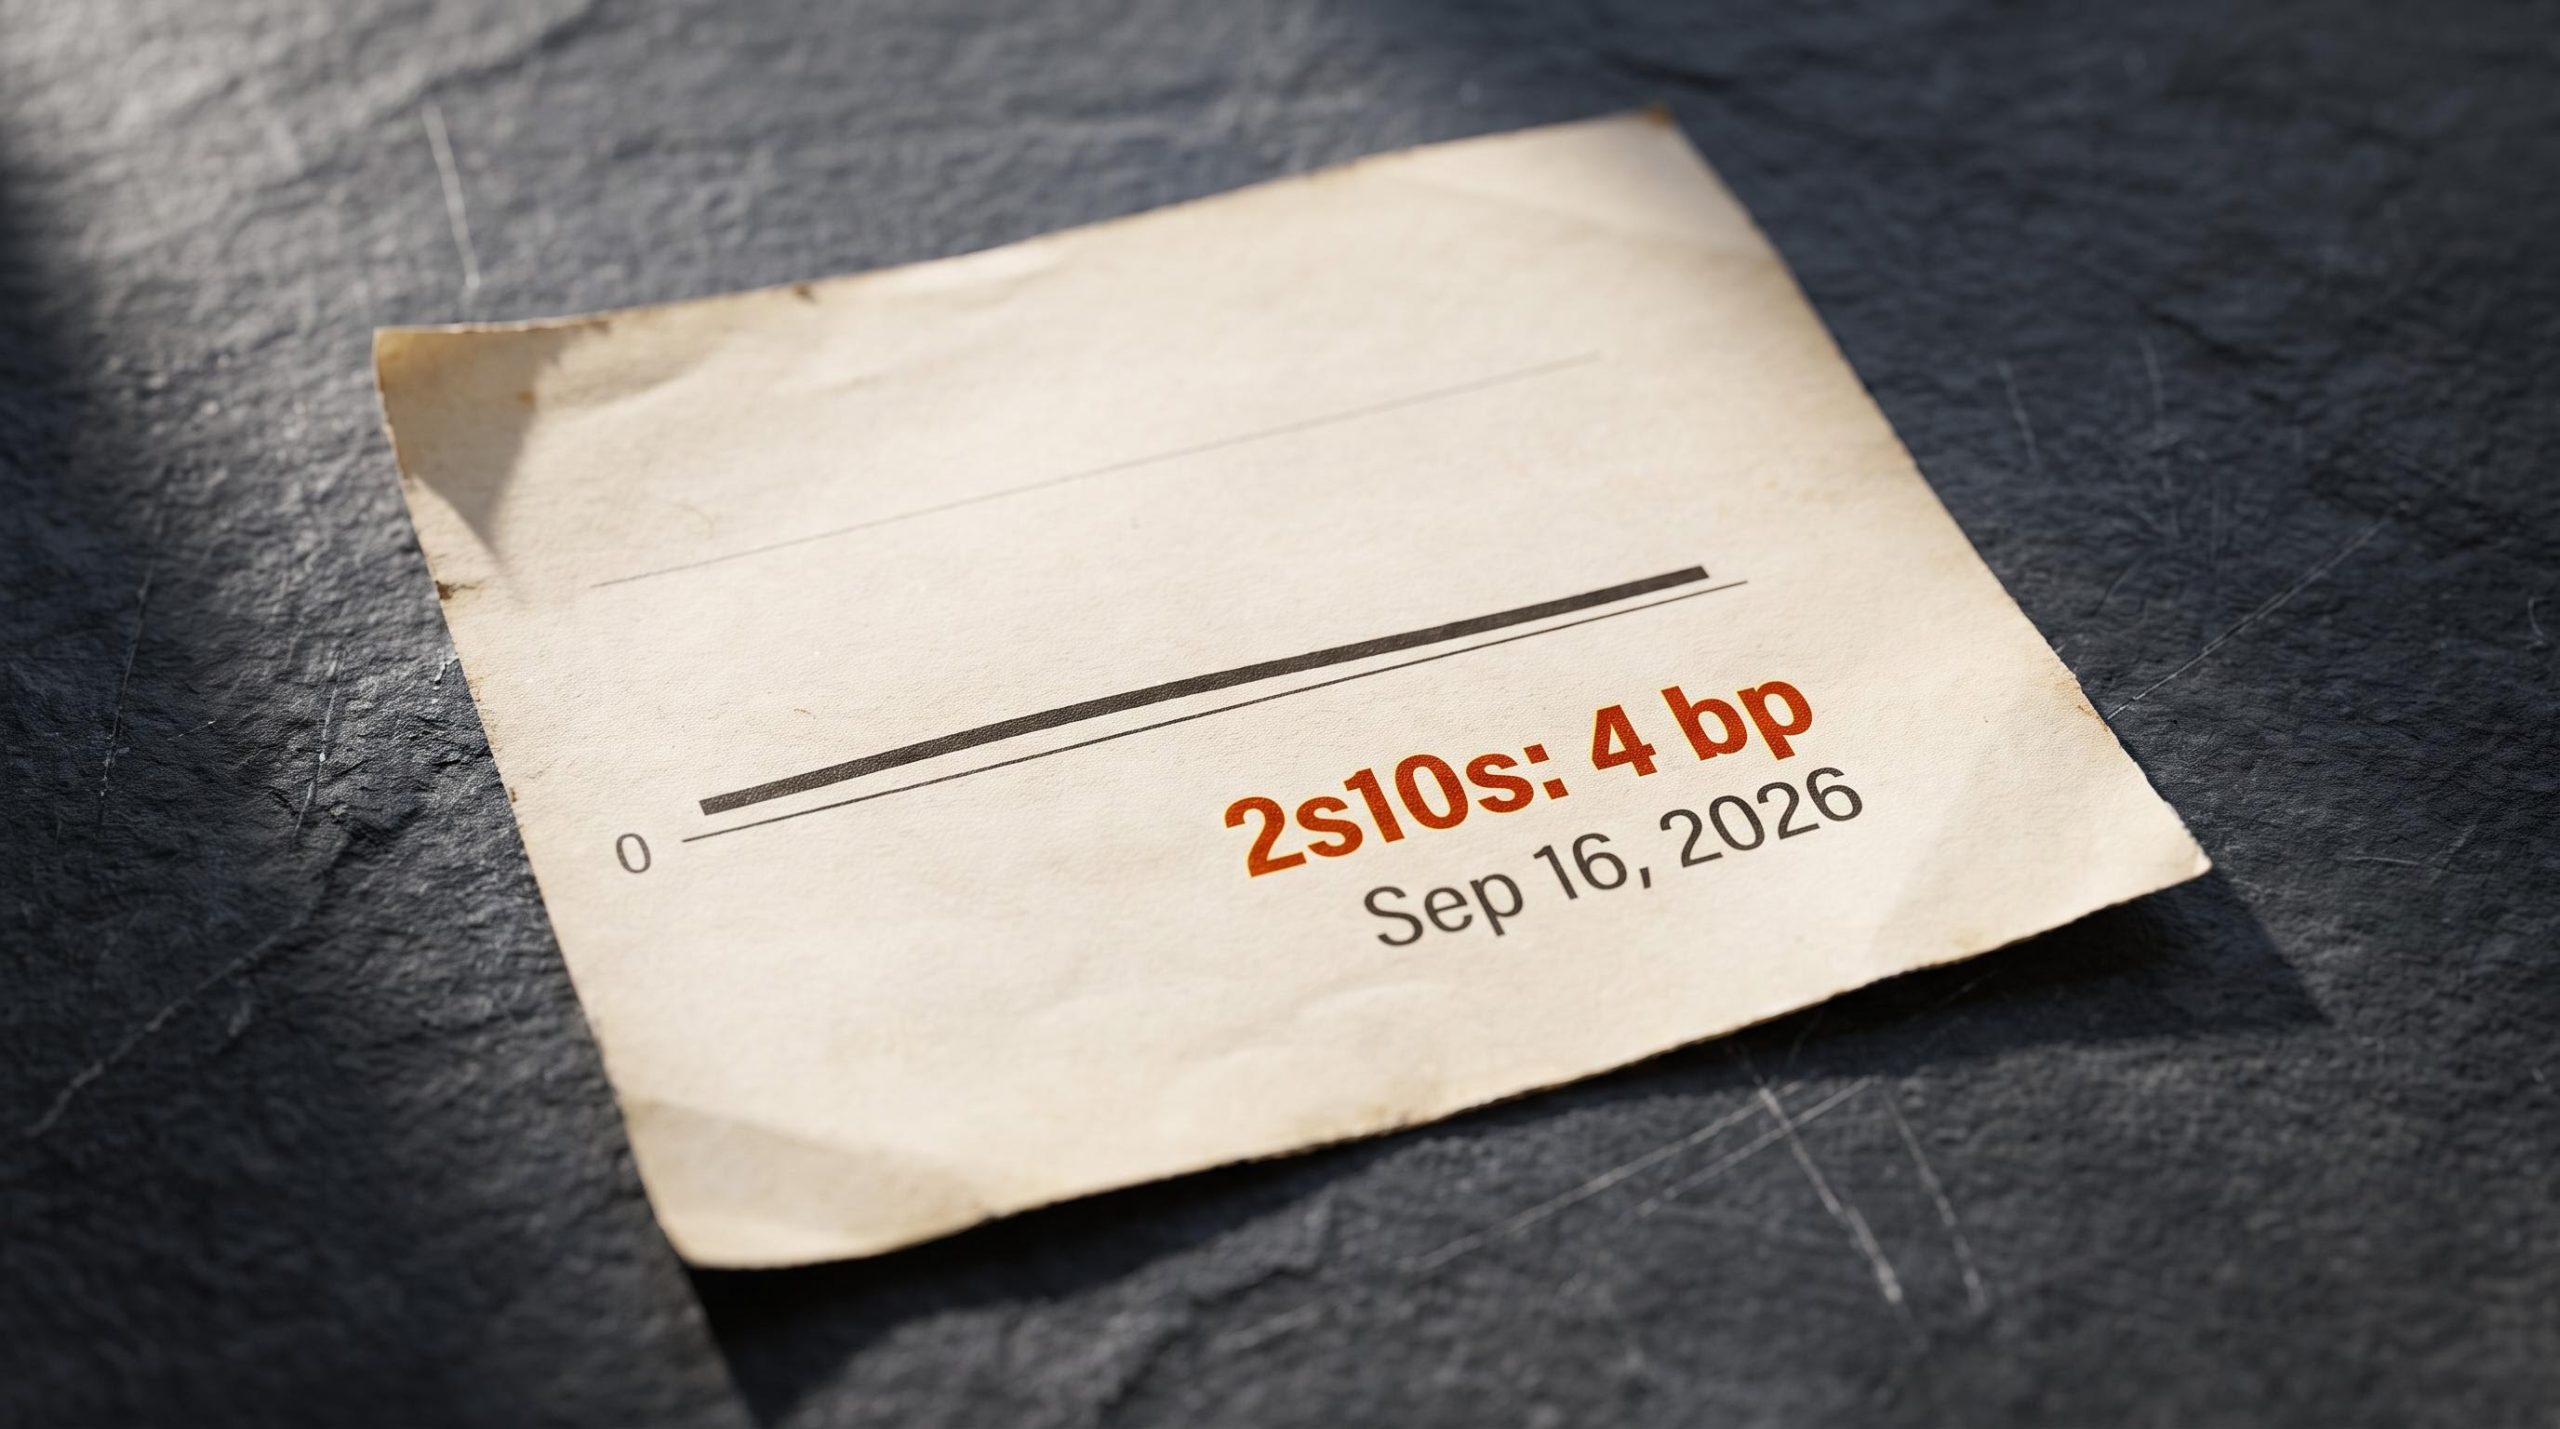
The 2-year and 10-year Treasury spread has compressed from roughly 49 basis points to about 4 basis points on a spot basis, and the 6-month forward version of that spread has slipped into negative territory at approximately -1 basis point. A gap that narrow is unusual. It means the bond market is pricing the difference between short-term and long-term borrowing costs down toward nothing.
That compression is happening at an awkward moment. Futures markets are pricing an 83-90% probability of a 25 basis point rate hike at the Federal Reserve’s meeting on 16 September 2026, yet the majority of professional economists surveyed expect the Fed to hold through the end of the year and cut only gradually starting in 2027.
So the bond market is not sending one clean message. It is sending several, and they do not fully agree.
What follows here is a working framework for reading three signals at once: the yield curve, the inflation gauges, and the rate futures. The goal is to help you position your fixed income exposure without anchoring to any single indicator that could turn out to be misleading.
What rate futures are actually telling you right now
Start with what the market is pricing, because it looks decisive. According to CentralBankWatch, using CME FedWatch data, futures assign an 83% probability to a 25 basis point hike at the 16 September 2026 meeting. The fact-checked original source puts the figure closer to 90%, so treat the read as a narrow band rather than a contradiction.
The forward path stacks up further from there. Futures currently imply two 25 basis point hikes by the end of 2026, plus an additional 39 basis points of tightening across 2027. The 3-month SR3 futures contract points to a forward rate of roughly 4%.
Equity markets are bracing too. S&P 500 e-mini futures imply a plus-or-minus 70-point move around the Fed decision itself, and roughly 100 points of total implied movement through the end of the week once options expiration is included.
Here is the pricing at a glance:
- 83-90% probability of a 25 basis point hike on 16 September 2026
- Two 25 basis point hikes priced by end-2026
- A further 39 basis points of tightening implied for 2027
- 3-month SR3 forward rate near 4%
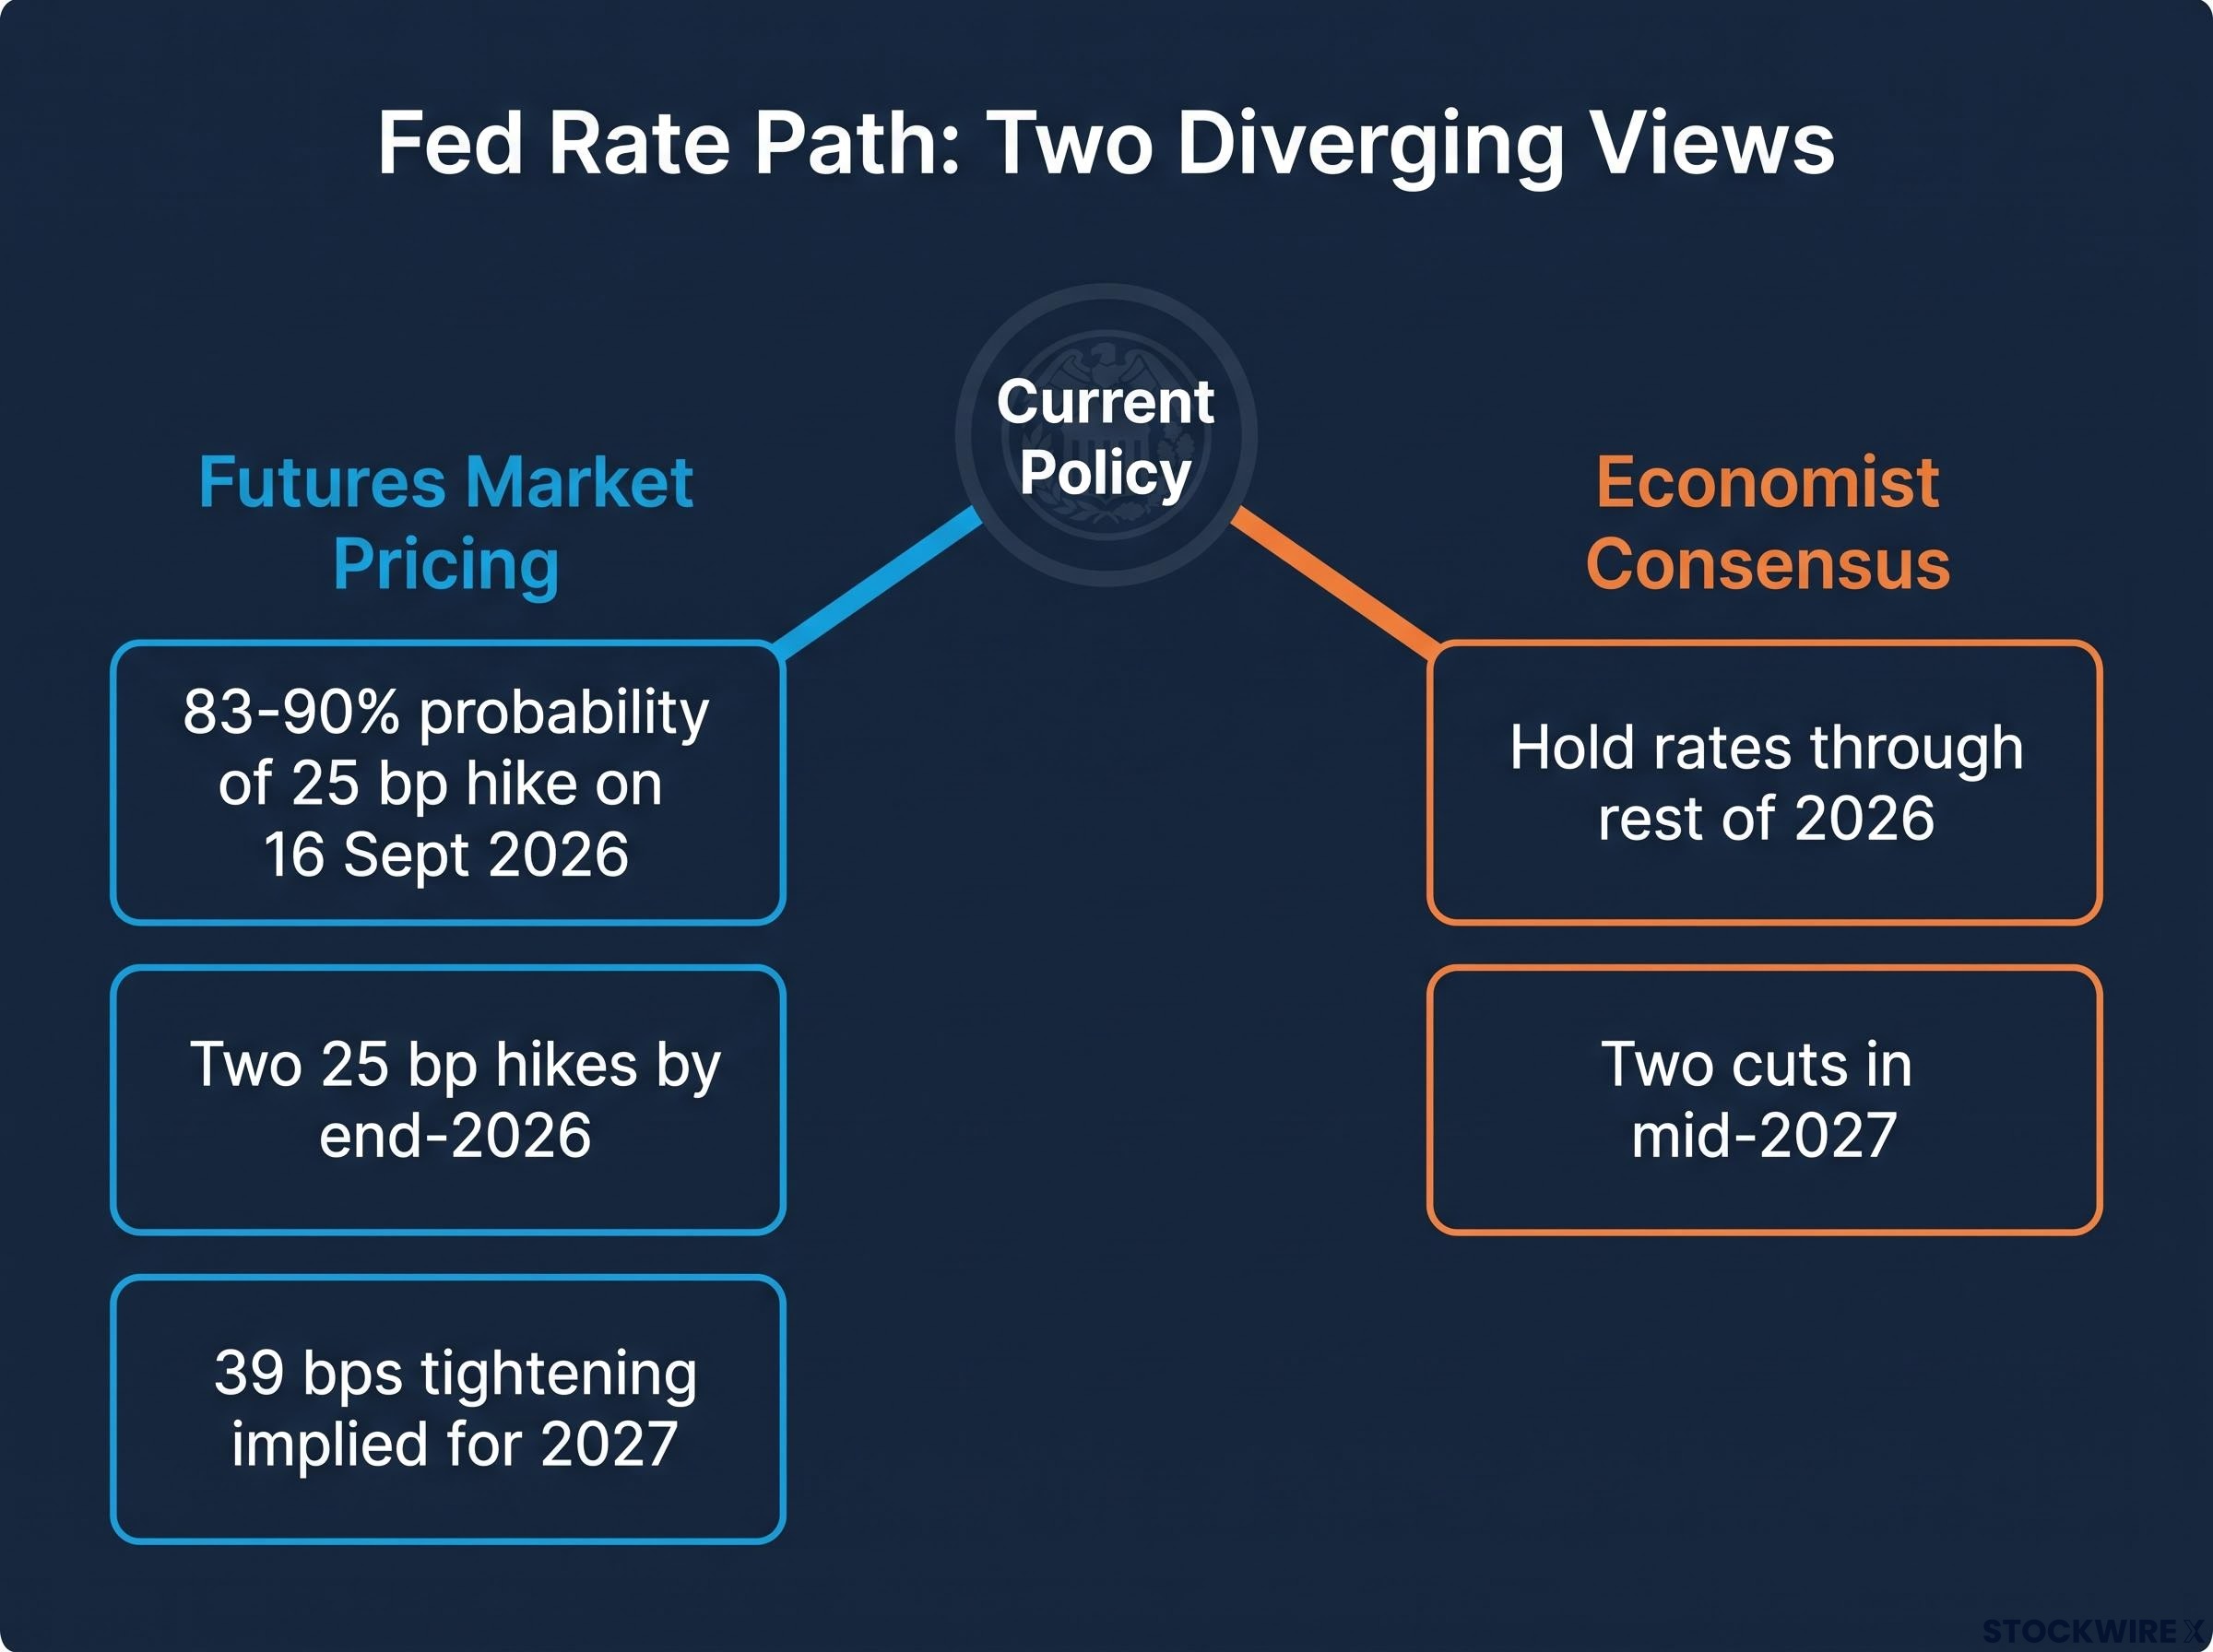
Now the complication. A Reuters poll from June 2026 found economists overwhelmingly expecting no further hikes this year. BofA Global Research’s base case is that the Fed stays on hold for the rest of 2026, then delivers two cuts in mid-2027. The professionals whose job is forecasting policy are not endorsing the path the futures curve implies.
The July 2026 FOMC vote split, with three regional Fed presidents preferring an immediate hike while the majority held, is itself a forward signal: unified same-direction dissent clusters have historically preceded cyclical turning points in the rate cycle, which matters when reading tomorrow’s decision against futures pricing.
Why futures curves routinely overshoot
The reason the two disagree is structural. CME FedWatch probabilities are not clean readouts of the Fed’s intentions. As Scotiabank has pointed out, futures prices absorb hedging flows, risk premia, and technical positioning alongside genuine policy expectations, which means the headline number reflects market mechanics as much as forecasting.
History shows how far this can drift. In 2019, two days of tariff threats against Mexico pushed fed-funds futures to price in an extra 25 basis points of cuts before the repricing reversed as the risk faded.
CME Group analysis of prior easing cycles between 1990 and 2009 found that fixed-income markets underestimated the eventual depth of Fed rate cuts by 400-625 basis points.
The lesson for you is not that futures are useless. It is that the gap between what they price and what economists project is itself a signal. The market is hedging against a scenario most professionals think is unlikely, and positioning as if the futures curve is a reliable roadmap carries real portfolio risk.
When big ASX news breaks, our subscribers know first
The yield curve at near-zero: what compression this sharp has historically signaled
Watch the compression unfold in sequence. The 2s10s spread stood near 49 basis points not long ago. It has since tightened to roughly 4 basis points on a spot basis, a decline of close to 95%. Push the measurement six months forward and it turns negative, sitting at approximately -1 basis point.
The underlying yields tell the same story from the other direction. The 10-year Treasury has been trading near 4.972-4.987%, just under the 5% threshold, while the 2-year has held around 4.645-4.651% as of 14 September 2026. When the short end climbs toward the long end like that, the curve flattens.
One data caveat matters here, and it is worth being transparent about. Official FRED data showed the 2s10s spread at a wider +33 basis points as of 11 September 2026, so the range depends on the source and the moment of measurement.
| Metric | Source | Date | Value |
|---|---|---|---|
| 2s10s spread | FRED (official) | 11 Sep 2026 | +33 bp |
| 2s10s spread (spot) | Market intraday | 14 Sep 2026 | ~4 bp |
| 10-year yield | Market / TradingEconomics | 14 Sep 2026 | 4.972-4.987% |
| 2-year yield | CNBC | 14 Sep 2026 | 4.645-4.651% |
Why does a flat curve unsettle investors? Because of its record.
The Cleveland Fed notes that an inverted yield curve has preceded each of the last eight U.S. recessions, with an average lag of around 14 months from inversion to recession onset.
Current models are not screaming, though. An IJFMR paper from February 2026 put the market-implied probability of a technical recession in the 18-35% range. That is elevated, not extreme.
When the curve’s recession signal gets distorted
The catch is that the curve may mean less today than its history suggests. Nordea has warned that the recent flattening partly reflects a collapse in term premia, the extra yield investors normally demand for holding longer-dated bonds, rather than a genuine shift in growth or inflation expectations.
Term premium dynamics complicate the yield curve’s recession signal further: the Fed’s share of outstanding public debt has shrunk from roughly 26% in 2021 to approximately 14% in mid-2026, meaning the central bank’s direct leverage over long-term borrowing costs has roughly halved, and the long end is increasingly priced by fiscal supply and foreign demand rather than policy expectation.
The Philadelphia Fed has found that inflation compensation drawn from TIPS is affected by liquidity conditions, meaning curve compression can reflect technical pricing rather than pure expectations. Fed staff research adds that 10-year inflation risk premia can be small or even negative.
Put together, heavy Treasury supply, global demand for safe assets, and central bank intervention can all compress long-end yields independently of what the economy is doing. So treat a curve this flat as a risk flag to monitor, not a recession verdict.
CPI, PCE, and the structural wedge that fixed income investors routinely miss
Here is the fact that trips up more investors than any other in this dataset: TIPS reset their value against CPI, but the Fed targets PCE. Those are two different inflation measures, and the tools you may already hold for inflation protection are calibrated to the one the Fed does not use.
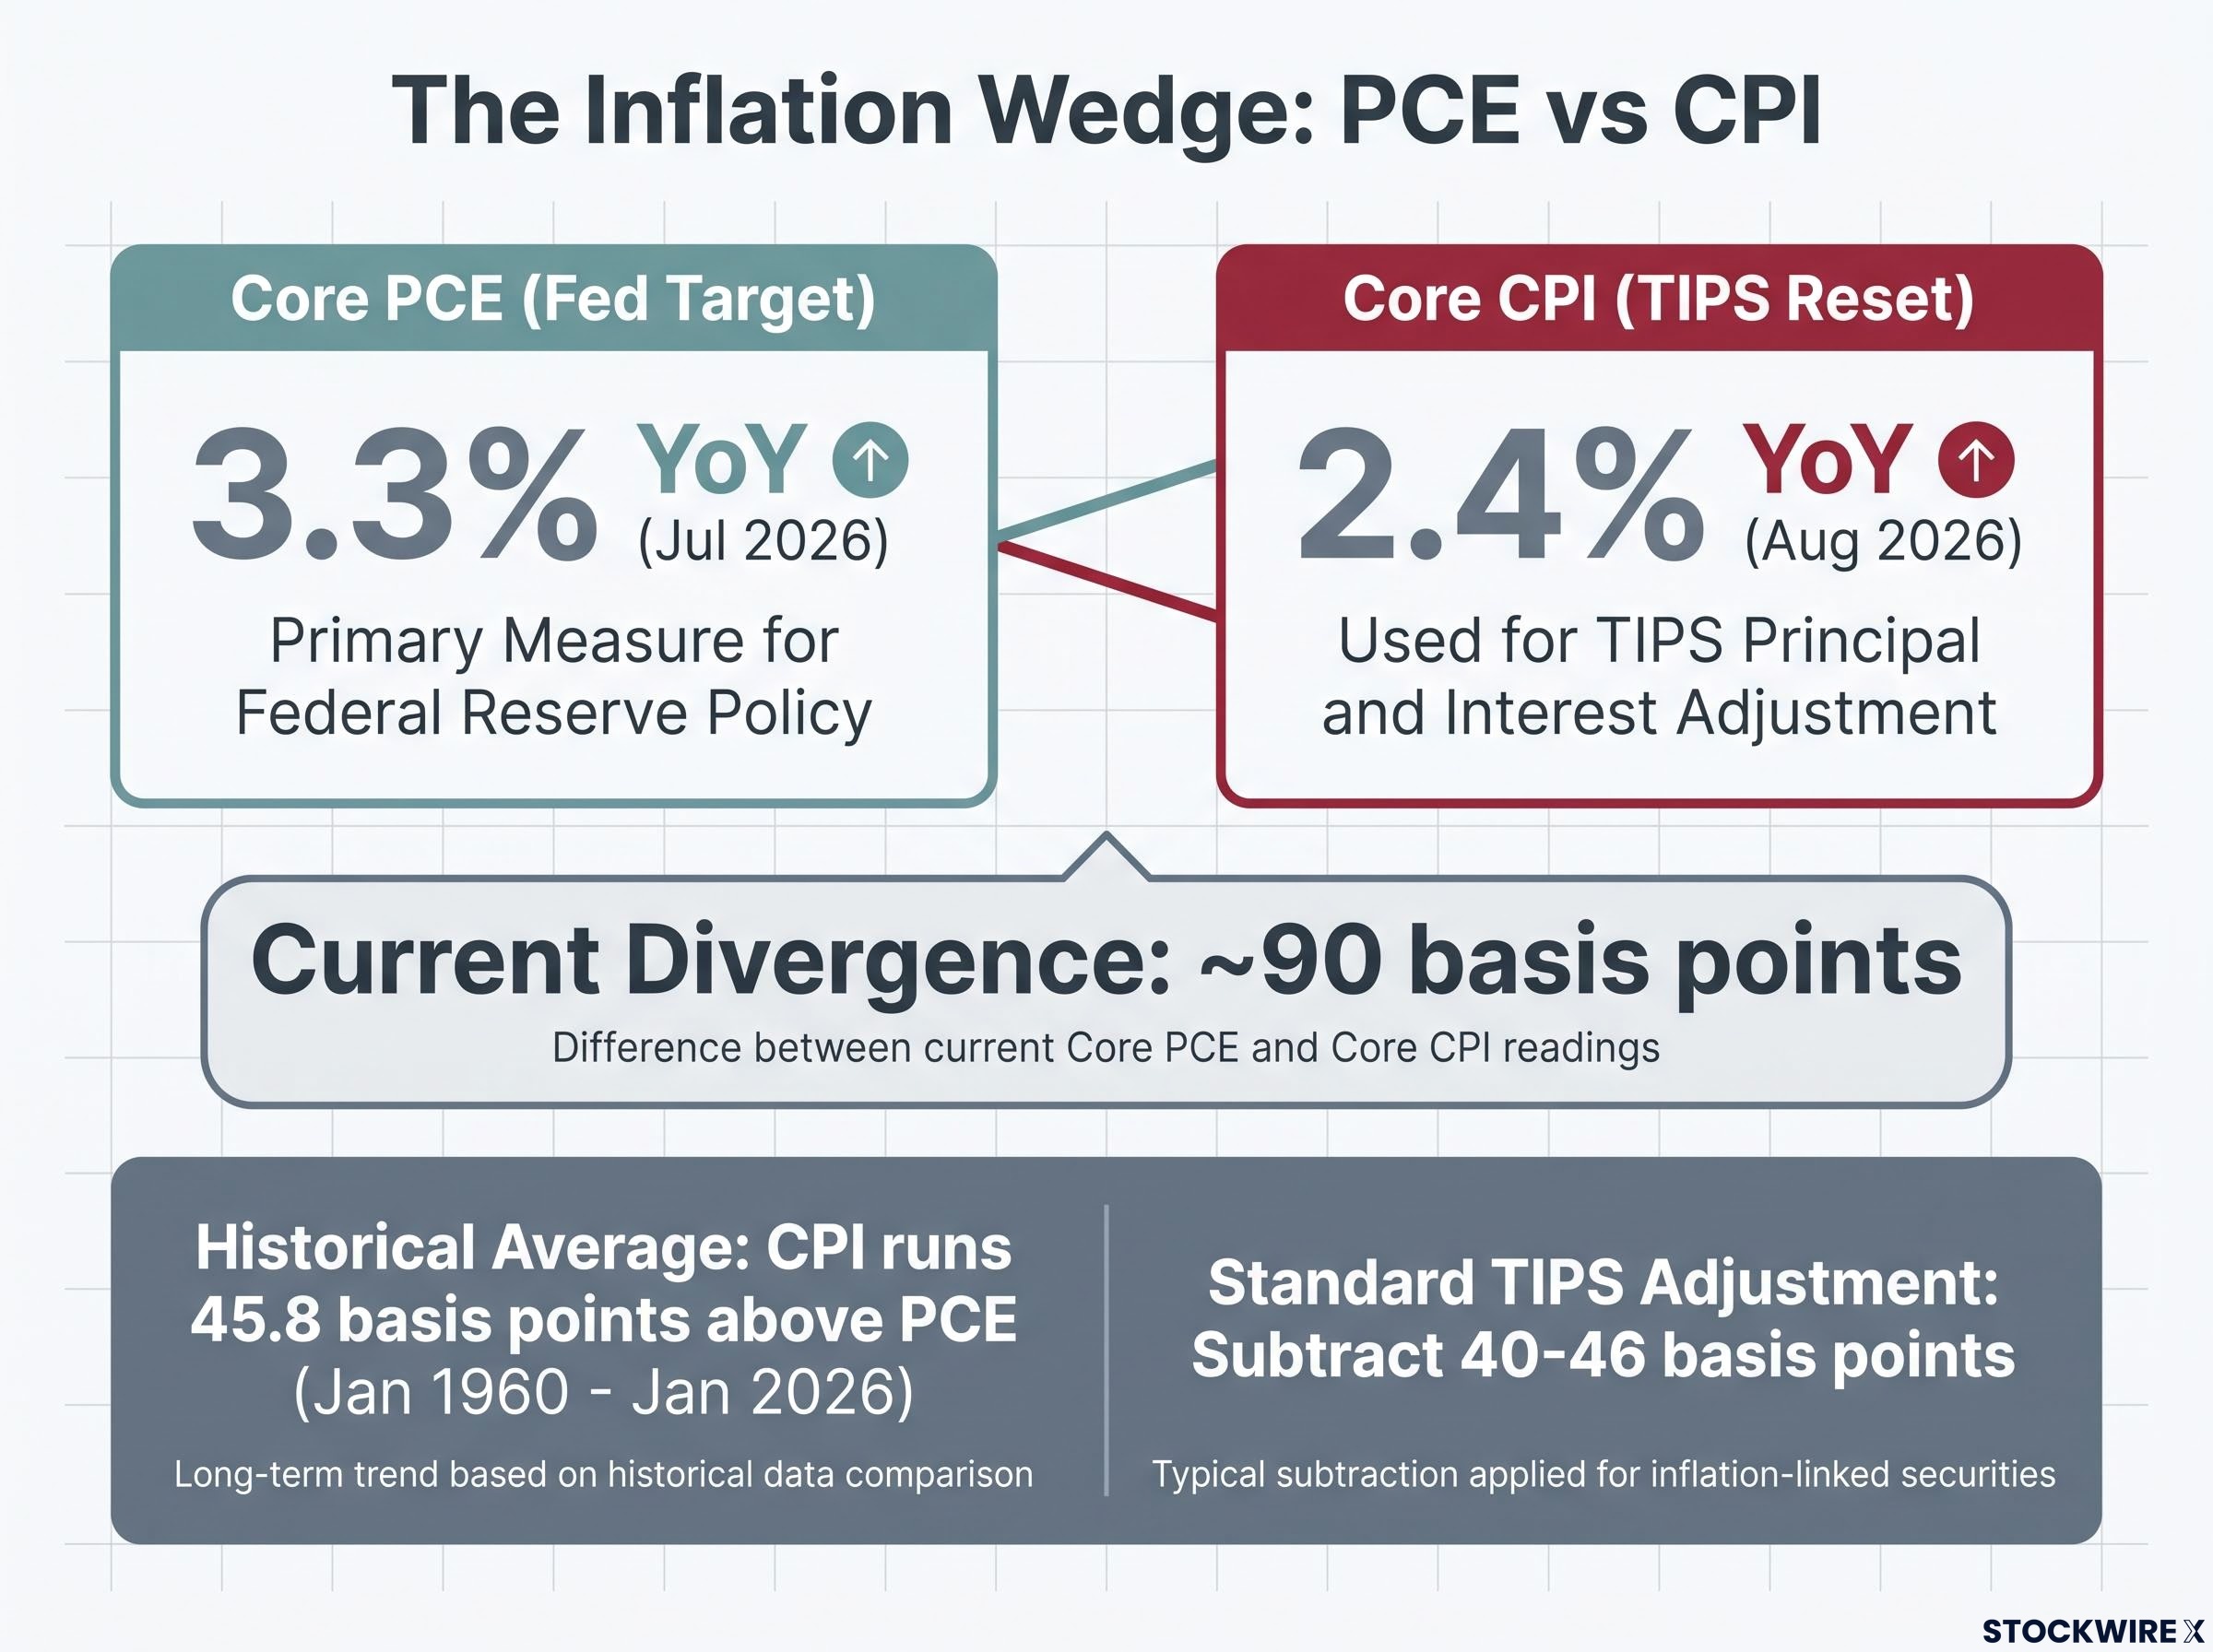
Start with the current gap between them. The Bureau of Economic Analysis reported core PCE rising 3.3% year-over-year in July 2026. The Bureau of Labor Statistics reported core CPI at 2.4% year-over-year in August 2026, down from 2.5%. That is a divergence of nearly 90 basis points in the most recent readings.
The core PCE trajectory from May through July 2026 tells a consistent story: the measure held at 3.4% in May before the July reading registered 3.3%, a modest deceleration that removed the immediate risk of a hawkish Fed reassessment but provided no basis for near-term cuts.
This wedge is not a fluke of the moment. It is structural, and the BLS attributes it to three differences:
- Scope: the two indices cover different sets of spending
- Weights: each assigns different importance to the same categories
- Formula: they use different mathematical methods to combine prices
| Measure | Current Reading | Gap to Fed Target | TIPS Relevance |
|---|---|---|---|
| Core PCE | 3.3% (Jul 2026) | +130 bp above 2% | Fed’s target measure, not what TIPS track |
| Core CPI | 2.4% (Aug 2026) | +40 bp above 2% | The measure TIPS reset against |
Over the long run, the gap is remarkably consistent. Across 792 monthly observations from January 1960 to January 2026, CPI has run above PCE by an average of 45.8 basis points, with a median near 39.7 basis points.
The Bank for International Settlements corroborates this, noting that annual CPI inflation runs persistently higher than PCE by roughly 40 basis points.
Now the part that changes how you read your own holdings. Because TIPS principal and coupons reset with headline CPI-U, their breakeven rates embed expected CPI plus risk and liquidity premia, not PCE expectations. Standard central-bank practice is to subtract 40-46 basis points from a TIPS breakeven before comparing it to the Fed’s 2% PCE target.
If you hold TIPS and assume your breakeven aligns with the Fed’s target, you are working with a number that sits about 40-46 basis points too high. That adjustment changes whether your real yield actually looks adequate for the current policy environment. Encouragingly, a Boston Fed paper concluded that this basis risk is neither economically nor statistically significant, so TIPS remain effective inflation hedges once you read them correctly.
Reading all three signals together: what the data actually says about higher-for-longer
Now bring the three threads into one view, because each on its own points somewhere different. Futures price a hawkish short-term path that economists dispute. The yield curve is compressed to near-zero, flagging elevated but uncertain recession risk. And the inflation gauges are converging without both reaching target on the Fed’s preferred measure, with core PCE still 130 basis points above 2%.
| Signal | Current Reading | Portfolio Implication |
|---|---|---|
| Rate futures | Two hikes priced; economists dissent | Avoid betting the whole book on the futures path |
| Yield curve | 2s10s near 4 bp spot | Monitor for re-inversion; hold measured duration |
| Inflation gauges | PCE 3.3%, CPI 2.4% | Short-dated TIPS, adjusted for the wedge |
Authoritative institutions converge on a practical response. Read in priority order:
- Capture front-end yields. High short-term rates support front-end Treasuries and high-quality short credit for income with limited duration exposure.
- Hold intermediate duration. Position in the belly of the curve, broadly the 3-7 or 5-10 year range, favoured by Vanguard, Schwab and others.
- Deploy selective TIPS. Use short-dated TIPS for near-term inflation cover; Truist Wealth specifically favours the 1-3 year range.
- Triangulate the signals. Read PCE, CPI and adjusted breakevens jointly rather than trusting any single gauge.
Russell Investments projects 10-year Treasuries to outperform cash by roughly 2.7% over five years, a useful counterweight to a rate-hike-dominant narrative.
The contrarian risk is real and cuts the other way. If futures are overpricing hikes, as prior cycles show they sometimes do, anyone positioned aggressively for a sustained multi-hike cycle faces meaningful duration risk on a reversal. The honest read is that higher-for-longer is real but not unlimited, and the most durable structure earns income at the front end while keeping measured exposure to the belly, where the risk-reward looks most favourable.
What to watch before making a duration call in this environment
The Fed is data-dependent, so a static verdict would age badly. What serves you better is a short list of readings that would move your positioning. Three variables matter most:
- Core PCE trajectory. Currently 3.3%, sitting 130 basis points above the 2% target. The direction of travel is the signal.
- The 2s10s spread direction. Near 4 basis points in spot terms. Whether it re-inverts or begins steepening tells you more than the level itself.
- The futures-economist gap. Futures price two hikes; over three-quarters of surveyed economists expect a hold through 2026, then gradual cuts from 2027. Watch whether that gap narrows.
The immediate catalyst is the 16 September 2026 Fed meeting, followed by the next core PCE and core CPI releases as the first post-meeting calibration points. One structural wildcard sits further out: an internal Fed working group is evaluating whether to keep relying on survey-based inflation data or adopt an alternative index.
The Federal Reserve September 2026 meeting calendar confirms the FOMC session runs across September 15-16, with the policy statement, updated Summary of Economic Projections, and Chair press conference all scheduled for release on the 16th, making that day the primary event risk for fixed income positioning.
Two scenarios and what each means for your fixed income positioning
You do not need a heroic call on the Fed’s exact path. You need a response to observable data:
- Scenario A: Core PCE declines toward 2.5-3%, the curve steepens, and the futures-economist gap narrows. Intermediate duration in the 3-7 year belly becomes incrementally more attractive.
- Scenario B: Core PCE holds above 3%, the curve stays flat or re-inverts, and futures remain hawkish. Front-end yield capture and short-dated TIPS stay the more defensible core.
BofA’s base case, a hold through 2026 followed by two cuts in mid-2027, anchors the moderate middle between them.
The honest read on where this leaves fixed income investors in September 2026
The bond market is flashing amber, not red. The curve is compressed but not catastrophically inverted, inflation sits above target on PCE while declining on CPI, and futures price a hawkish path the professional consensus does not fully endorse.
The positioning the evidence supports most robustly is a diversified one: intermediate duration in the belly of the curve, short-dated TIPS for near-term inflation protection, front-end exposure for income, and a habit of reading PCE, CPI and TIPS breakevens together, adjusted for the 40-46 basis point CPI-PCE wedge.
You are reading this one day before the 16 September 2026 Fed meeting, with the next core PCE and core CPI readings as your first calibration points. Position against those releases rather than locking in around a single decision.
For investors wanting a structured framework to implement the positioning the evidence supports here, our dedicated guide to fixed income portfolio positioning in a rate-hold world covers laddered allocation mechanics, duration trade-offs across short and intermediate instruments, and how professional managers calibrate yield margins of safety across a range of plausible inflation outcomes.
This article is for informational purposes only and should not be considered financial advice. Investors should conduct their own research and consult with financial professionals before making investment decisions. Past performance does not guarantee future results, and financial projections are subject to market conditions and various risk factors.