It is a Friday in September, and you have just watched the market drop sharply in the final hour. You open three financial sites for an explanation. One blames zero-DTE options overwhelming dealers into the close. Another says it is simply September doing what September does. A third points to nervousness ahead of the midterm elections.
Three commentators, three causes, and no obvious way to decide which one actually moved your portfolio. That confusion is not a personal failing. It is a structural problem with how these forces get explained, always in isolation, never against each other.
September 2026 has stacked an unusually dense set of volatility signals into a single window. Spot VIX sits in the mid-teens at 15.84 as of 11 September 2026, yet the term structure is sloping upward. The historical seasonal record is weak, and a midterm election is approaching fast.
This explainer hands you a framework for reading several volatility signals at once. By the time you finish, you will be able to stop reacting to whichever headline is loudest and start asking what the signals collectively suggest about your risk.
What zero-DTE options actually do to the market (and what they do not)
Start with the scale, because the numbers are genuinely large. Zero-days-to-expiration options, contracts that expire the same day they are traded, now account for 59% of S&P 500 index (SPX) options volume, a daily average of 2.3 to 2.6 million contracts according to full-year 2025 Cboe data reaffirmed on 12 September 2026. Across all US listed options, they made up 24.1% of volume in 2025, up from 21.5% in 2024.
That growth has fed a widespread retail assumption: more 0DTE volume must mean more volatility. The data does not support it, at least not the way most people think.
On an average trading day, the net market impact is structurally contained. Consider what the research shows:
- Average net gamma from market makers’ SPX 0DTE exposure sits at just 0.04% to 0.17% of daily S&P futures liquidity.
- Market maker intermediation of these options has been found to decrease index volatility by 60 to 90 annualised basis points on days with 0DTE trading.
- The year-to-date 2026 spread between close-to-close and intraday realised volatility is 2.7 volatility points, exactly matching the 10-year historical average.
- Under a one-standard-deviation surge in 0DTE trading, volatility can still rise 10.4% relative to its mean level.
The third point challenges the retail narrative most directly.
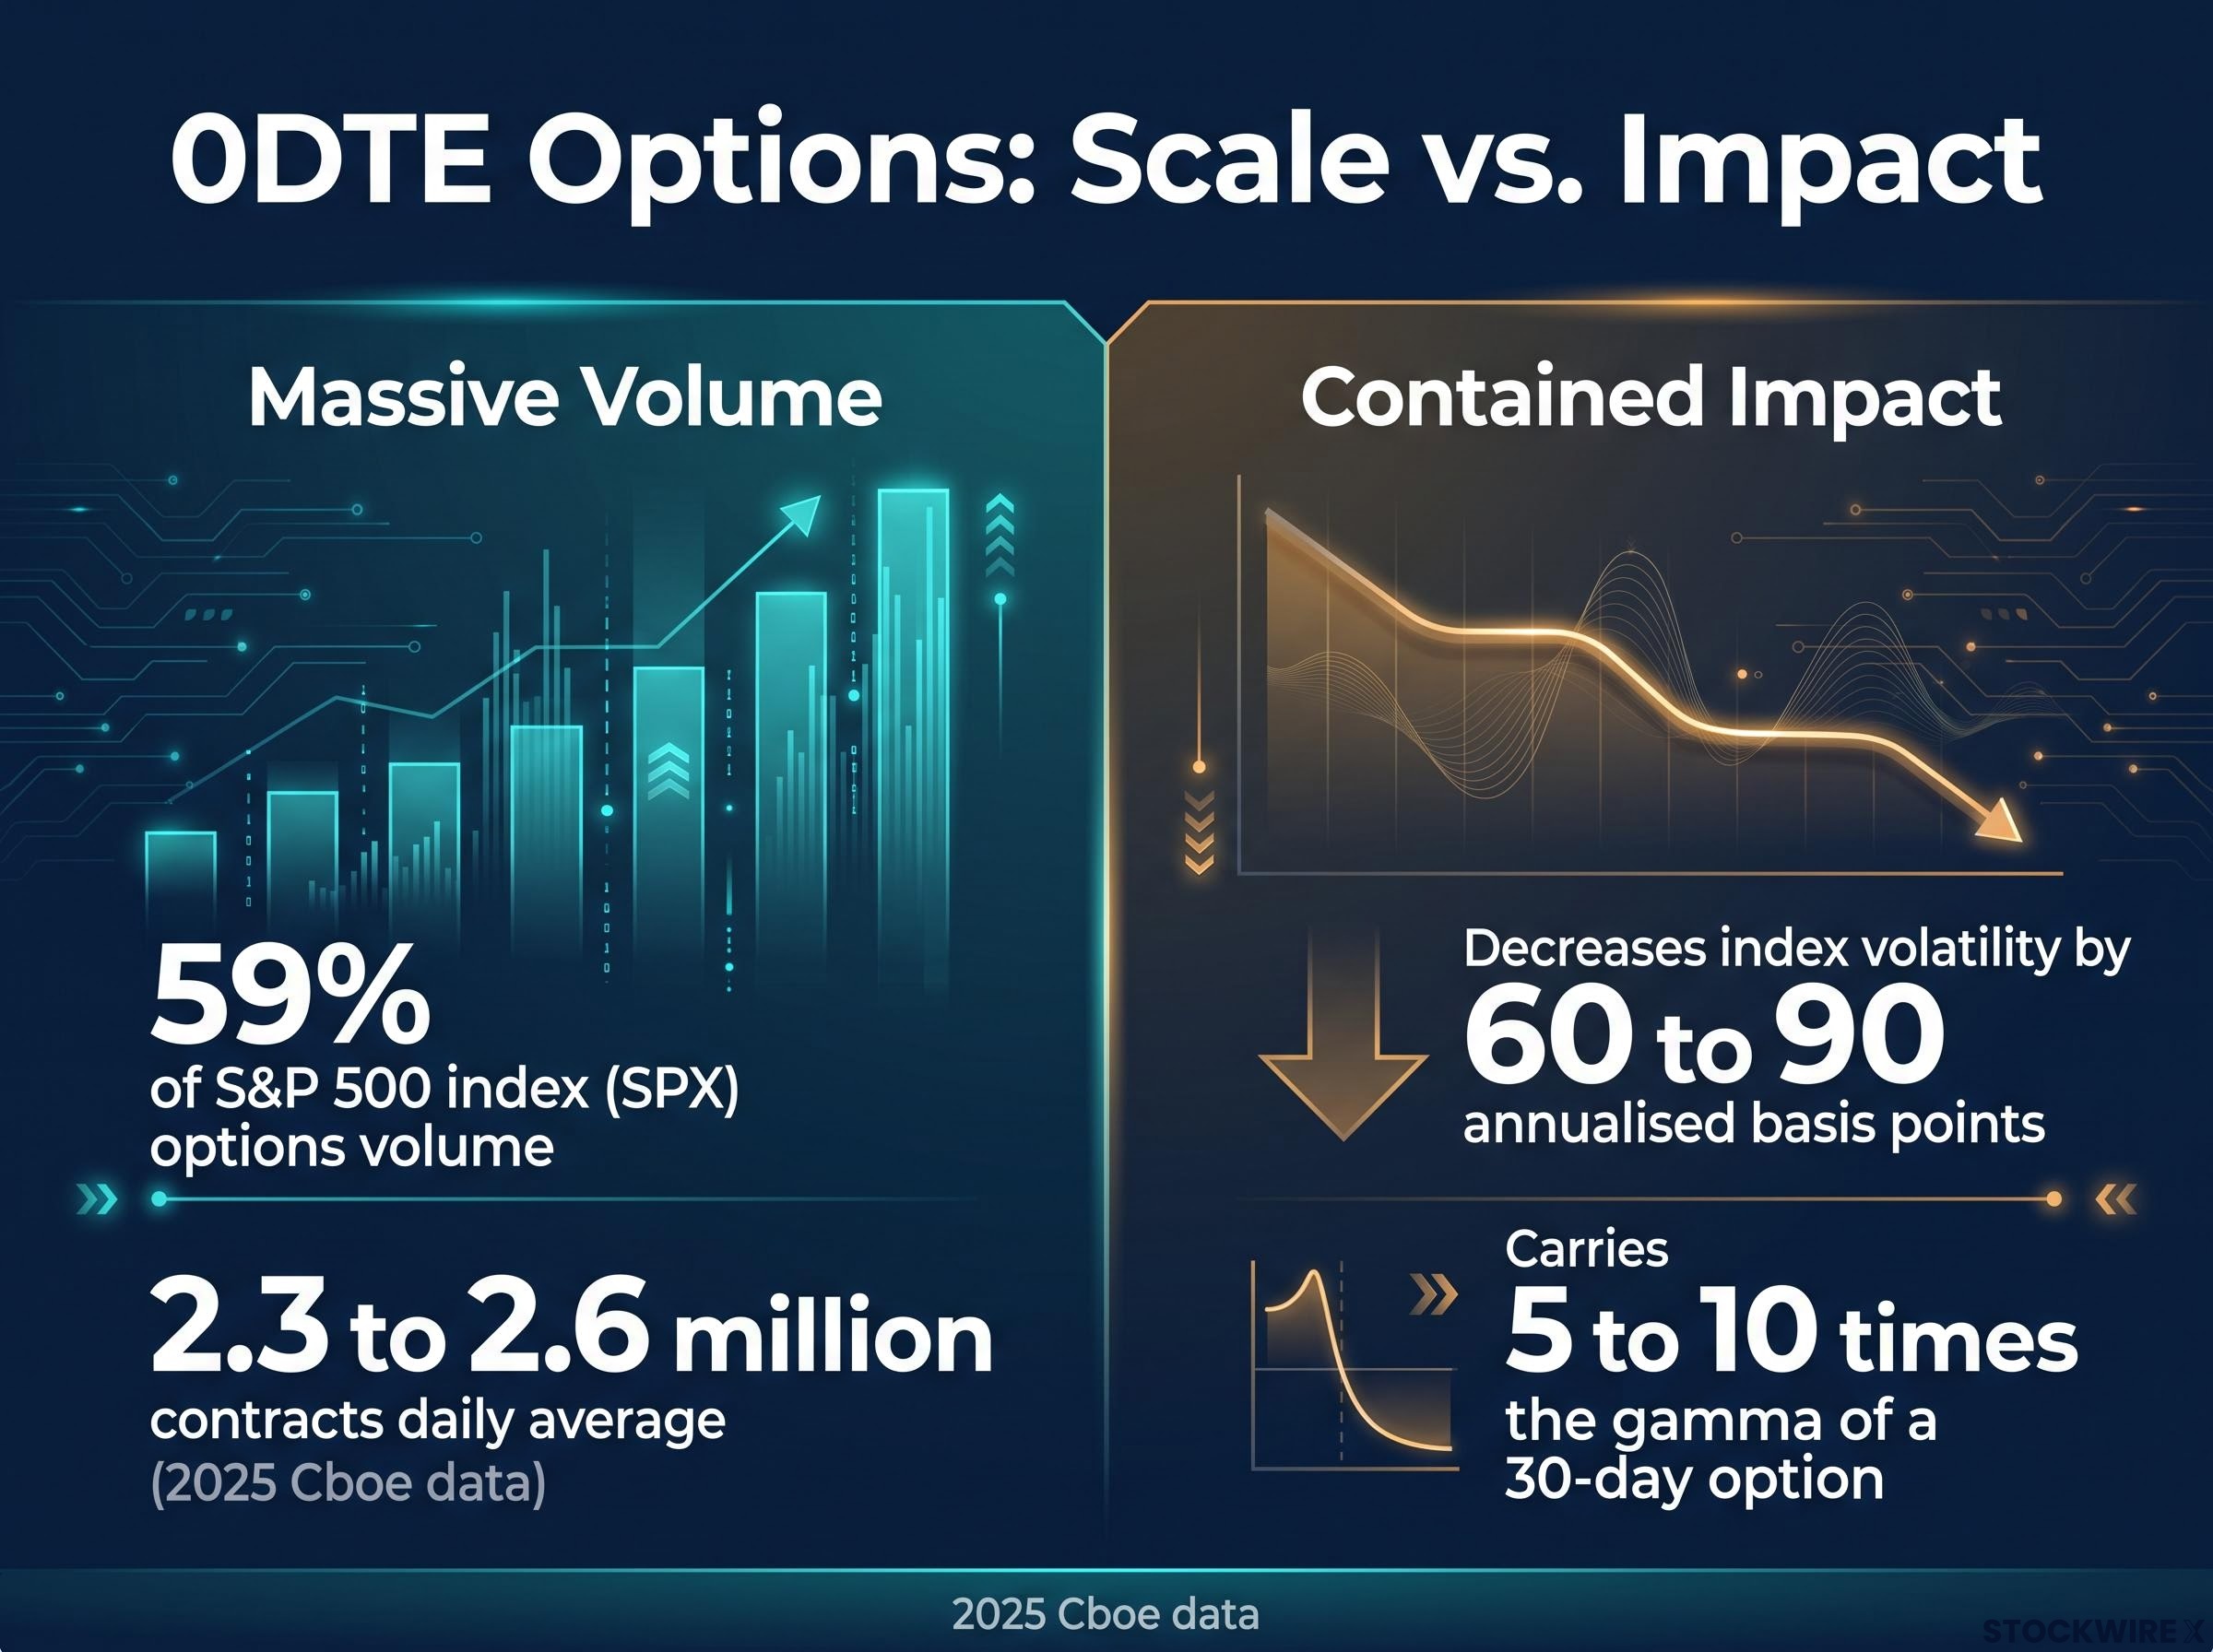
One academic study found that market makers’ intermediation of SPX 0DTE options decreases index volatility by 60 to 90 annualised basis points on days when those options trade. On a typical session, this activity dampens moves rather than amplifying them.
So what does this tell you about your own exposure? The volume is enormous and present in every single session, but its effect on your portfolio is mostly invisible on ordinary days. It only becomes relevant when speculative flows cluster heavily in one direction near the close.
How gamma mechanics amplify moves near the close
Gamma measures how quickly an option’s directional sensitivity changes as the underlying price moves. As expiration collapses toward zero, that sensitivity does not fade. It explodes.
A 0DTE option can carry 5 to 10 times the gamma of a 30-day option at the same strike. That is the anchoring figure to remember.
The gamma pinning mechanics that produce this close-of-day instability operate through dealer delta hedging, where 0DTE gamma running 2 to 5 times higher than equivalent weekly contracts forces disproportionately large hedging trades into the final minutes of each session.
Here is why it matters for the last hour of trading. When the market moves, dealers who sold those options must hedge their exposure faster and in larger size than they would for longer-dated contracts. That rapid hedging can push prices further in the direction they are already heading.
The practical read for you: on a high-volume 0DTE day, the final hour can feel unstable in a way the open did not, because dealer hedging is concentrating into a shrinking window. That afternoon intensity, not the raw volume figure, is the signal worth watching.
When big ASX news breaks, our subscribers know first
Does September actually eat portfolios? What the data says about seasonal volatility
Your instinct that September and October carry real risk is not superstition. It has a statistical basis.
Since 1926, US large-cap stocks have averaged a loss of 0.9% in September, with the final two weeks historically the weakest stretch of the month. October is regularly cited as one of the more volatile months of the year.
There are logical reasons behind the pattern. Investors return from summer and reassess their positioning, mutual funds manage fiscal year-end, and tax-loss harvesting picks up. The seasonal weakness is a behavioural footprint, not random noise.
| Month | Historical pattern | Key behavioural driver |
|---|---|---|
| August | Transition month | End-of-summer positioning reassessment |
| September | Average return of -0.9% since 1926 | Fund fiscal year-end, tax-loss harvesting |
| October | Historically elevated volatility | Repositioning after weak September |
Here is where the pattern gets less actionable than it feels. Even a 50-year market history gives you only 50 distinct September data points, which is nowhere near enough to draw a robust conclusion. Practitioners treat seasonal signals with meaningful skepticism for exactly this reason.
The September effect carries less statistical weight than its reputation suggests: the median S&P 500 return for September since 1925 is actually positive at +0.1%, and roughly 52% of all Septembers have closed in positive territory, making the month closer to a coin flip than the reliable decline the average return implies.
The pattern also breaks easily.
In September 2025, global equities defied the seasonal script entirely. The MSCI AC World Index delivered a positive total return of roughly 2% for the month, the opposite of what the historical average would predict.
Now look at what the options market is doing right now. The VIX term structure is upward-sloping: the 16 September VIX future sits at 17.50, while SPX options expiring 16 October carry implied volatility of 16.19. One-month realised volatility for the S&P 500 was just 8.9% on 11 September 2026, leaving a 6.9 volatility point gap versus spot VIX.
That upward slope tells you options markets are already pricing elevated near-term risk relative to what is actually being realised. In other words, some of the seasonal risk premium is already baked into hedging costs. You are not being offered a free hedge against September weakness. You are being asked to pay for one the market has already anticipated.
Election cycles and implied volatility: the pattern, the limits, and the current context
The election-cycle volatility story is real, but it is consistently overstated. Working through the data in order of how intuitive it feels makes the reframing clear:
- Since 1990, the S&P 500 has averaged a drawdown of roughly 8% between 31 August and election day in midterm years, before recovering.
- Midterm years also show average maximum intra-year drawdowns of 19%, versus 12% in non-midterm years.
- Yet across full election years, S&P 500 realised volatility averages just 14.8%, only marginally above the 14.1% average in non-election years.
The third finding is the one that breaks the narrative.
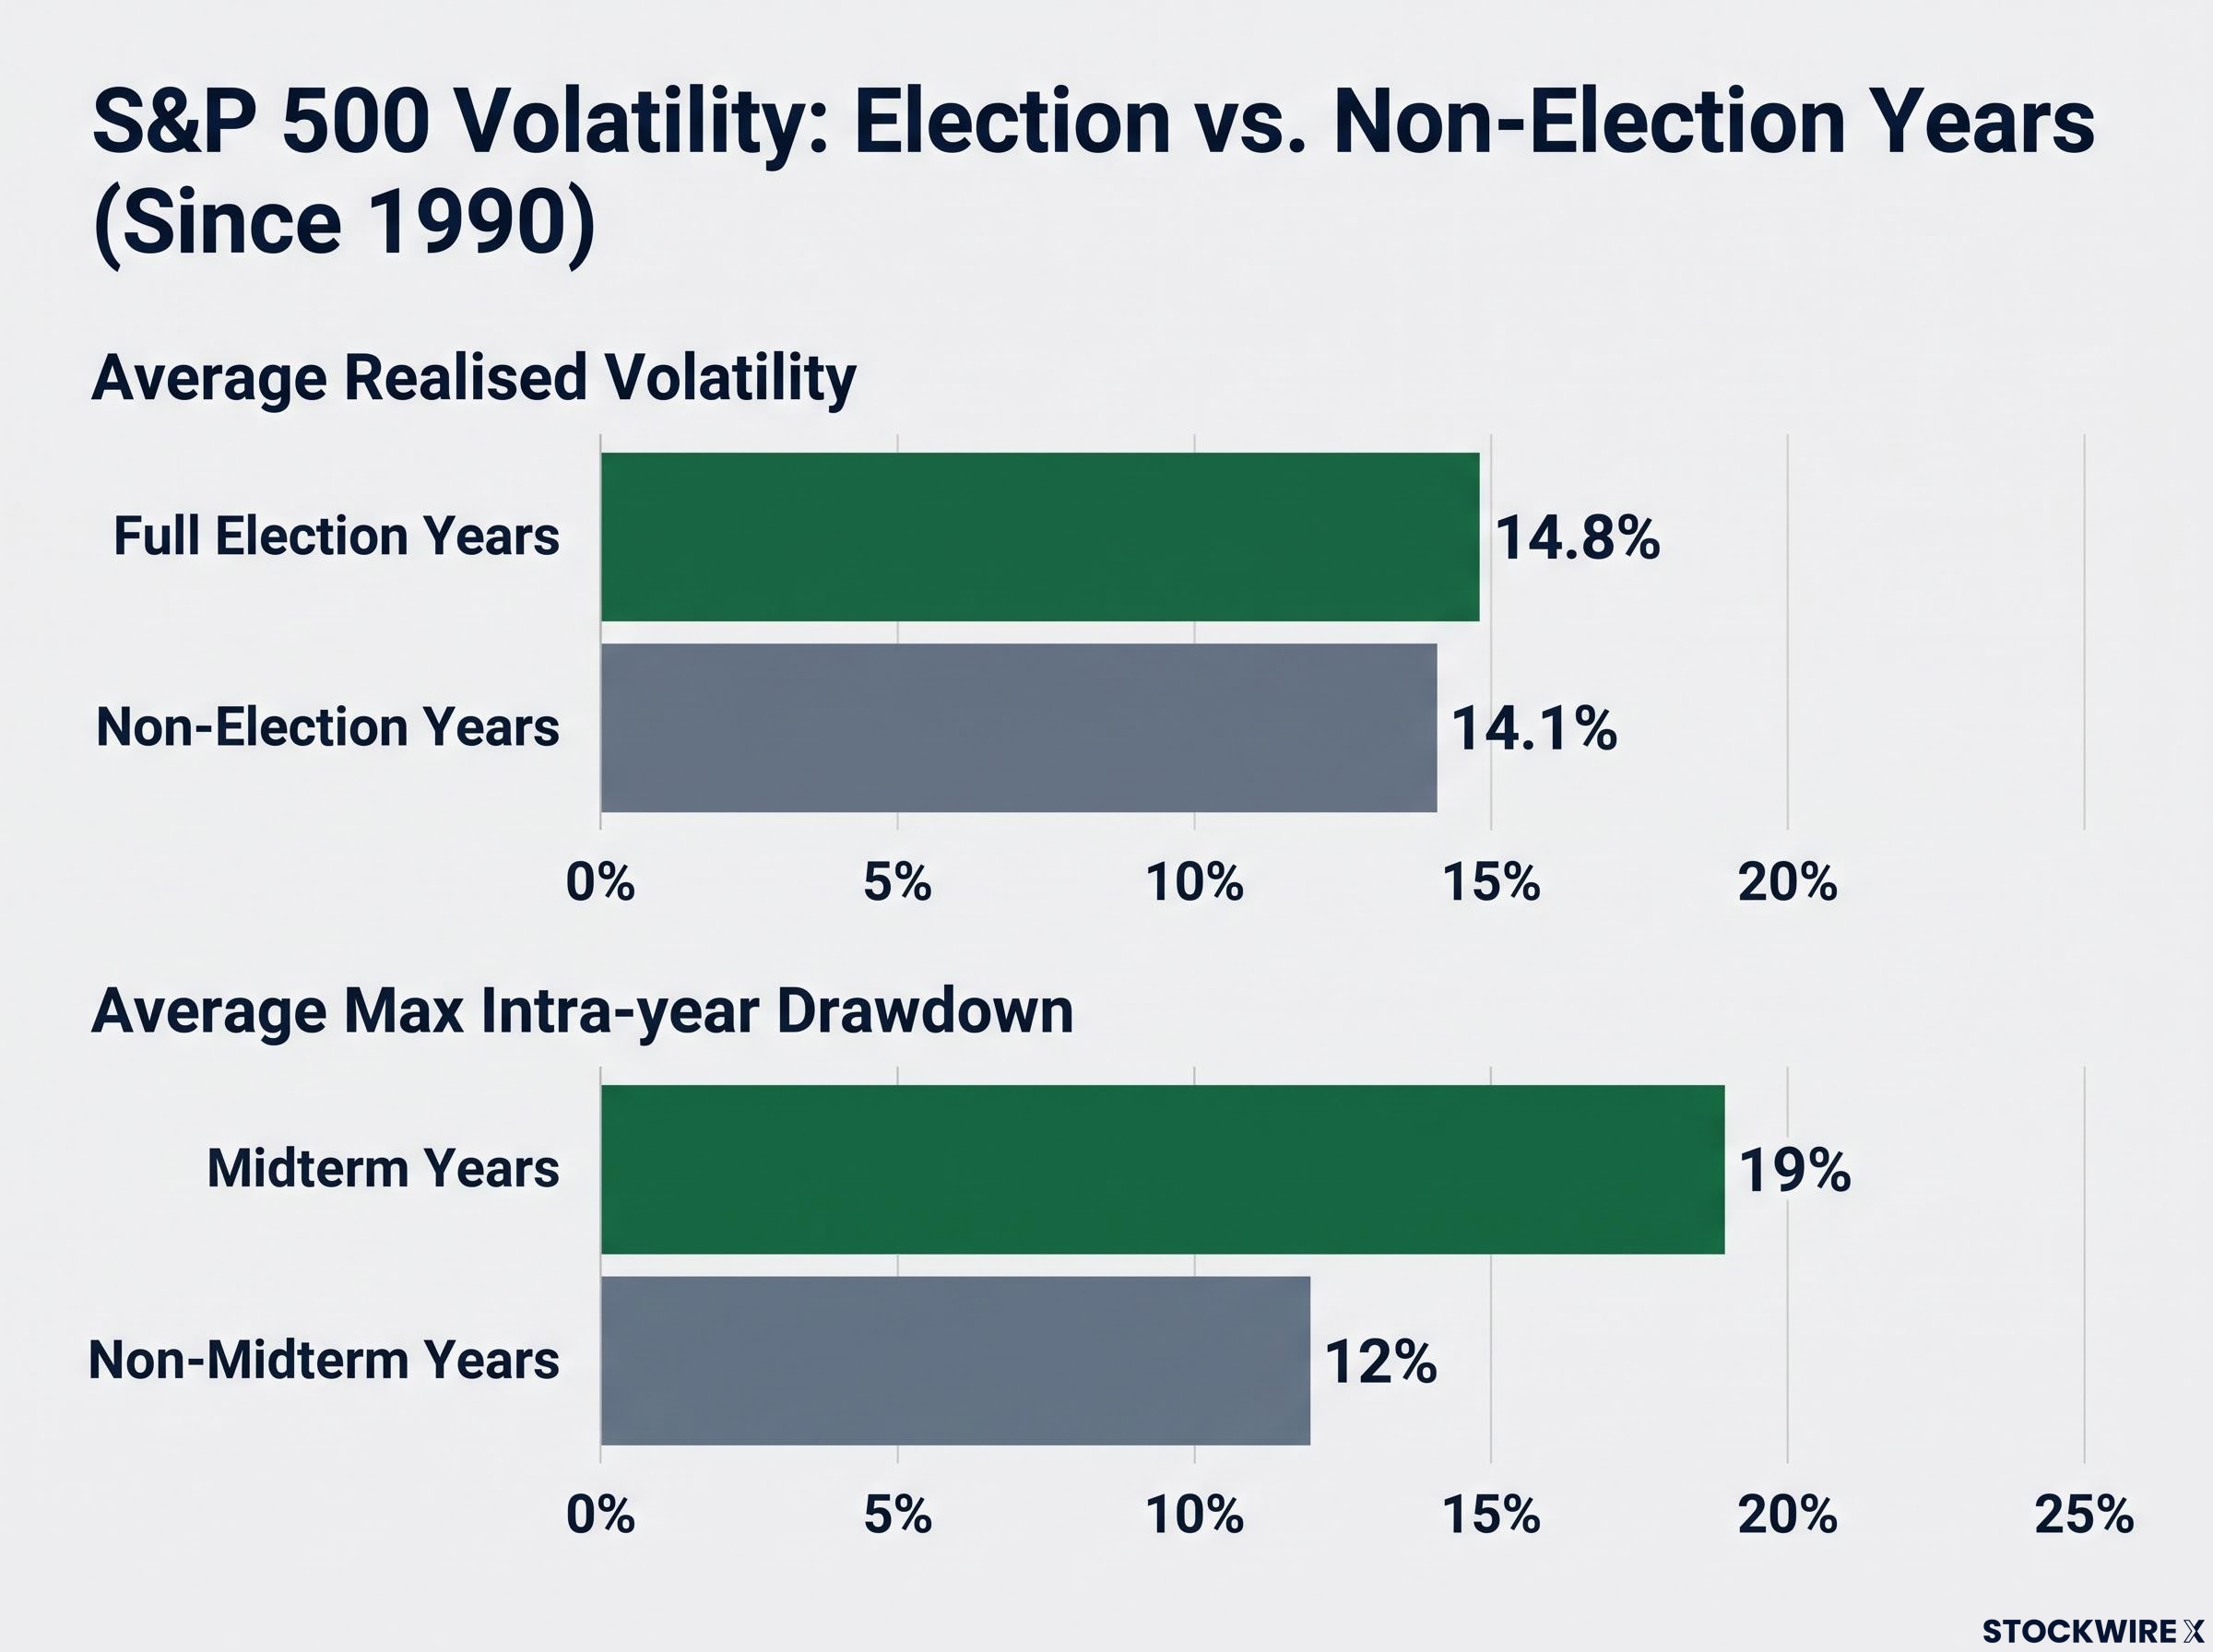
Despite the widespread expectation of election-year turbulence, S&P 500 realised volatility during full election years averages 14.8%, barely above the 14.1% seen in non-election years. The excess is concentrated in the one-to-three-month window immediately before the vote, not spread across the year.
The sample problem is even more severe here than with seasonality. There are far fewer distinct midterm cycles than there are September data points, which makes pattern-matching to historical analogs particularly unreliable.
There is also a structural wrinkle in the current environment. Ongoing fiscal support and market-friendly policy expectations, what some participants call the “Trump Put”, have been identified as partial contributors to today’s suppressed volatility. That matters because any perceived reduction in that support could lift volatility independent of the election calendar entirely.
So what should you take from all this? The gap between election-year and non-election-year volatility is too small to justify reshaping your risk posture around the calendar alone. The fiscal policy environment may be doing more work than the election cycle in setting the current baseline. Watch the policy signals, not the countdown to polling day.
Prediction markets currently price the Senate result near a coin flip, with a Republican Senate hold at roughly 53% probability, meaning the two dominant post-election configurations carry nearly equal weight and investors who position as if either outcome is certain are absorbing uncompensated scenario risk.
Why no single signal is enough: the mosaic method for reading volatility
Everything so far points to one conclusion. No single force, not 0DTE volume, not September, not the midterms, reliably dictates market behaviour on its own. Each is easily overwhelmed by macro shocks, rate cycles, and geopolitics.
The mosaic method is the answer, and it is simpler than it sounds. Instead of treating each factor as a standalone trigger, you combine live current data across several dimensions to build one composite picture.
Here are the four inputs to track at the same time, framed as questions you can actually ask:
- VIX level: Where does it sit relative to its recent range, elevated or suppressed?
- Term structure slope: Is it upward-sloping (contango) or inverted, and what is that pricing in?
- Realised versus implied spread: Is the market charging more for protection than volatility is currently delivering?
- Dealer gamma positioning: Are hedging flows likely to dampen or amplify moves near the close?
The guiding principle is current data over historical pattern. The three forces in this article are best used as context for interpreting live signals, not as independent reasons to act. Right now, the realised versus implied spread of 6.9 volatility points is your clearest live signal: the market is already paying for protection against exactly the risks described here.
The realised versus implied spread of 6.9 volatility points is historically a risk premium rather than a mispricing: the premium has inverted during slow-moving crises, reaching roughly negative 33 volatility points in early 2009 when options markets were too calm to price the deterioration already underway.
That spread reframes your decision. The question is not whether risk exists. It is whether you are being fairly compensated for the protection you are buying or selling.
Turning the mosaic into portfolio behaviour
Translate those four inputs into three behavioural principles, and the framework becomes usable:
- Maintain diversified, long-term allocations rather than repositioning around a single factor.
- Treat volatility spikes as potential rebalancing windows, not exit signals.
- Avoid portfolio-level changes driven by a calendar narrative alone.
History supports holding through the noise. Volatility typically subsides after elections as policy uncertainty resolves, which has historically rewarded investors who stayed invested rather than cutting equity exposure ahead of the vote.
Using the mosaic method, in practice, looks like this: you hear a scary September headline, you check the four inputs, and you let the live signals decide whether anything has genuinely changed for you.
What September 2026 is actually telling you right now
Apply the mosaic to today’s live data, and the picture comes into focus.
| Signal | Current reading | Historical context | Mosaic interpretation |
|---|---|---|---|
| VIX level | 15.84 (11 Sept 2026) | Near year-to-date low of 14.25 | Suppressed, but not the lowest of the year |
| Term structure slope | Sept future 17.50, Oct implied 16.19 | Upward-sloping, not flat | Market pricing modest near-term risk |
| Realised/implied spread | 6.9 volatility points | Options above realised volatility | Meaningful premium already paid for protection |
| Election cycle position | Midterm approaching | ~8% average Aug 31 to election day drawdown | A baseline, not a prediction |
Read together, these send a mixed message on purpose. VIX at 15.84 with a 6.9-point realised/implied spread is not a market pretending risk does not exist. It is a market that has already paid for some of that risk, which changes what additional hedging actually costs you.
The honest limits matter too. The term structure is upward-sloping rather than flat, so this is not complacency. And the fiscal support dynamic adds a variable with no reliable historical analog, so the roughly 8% midterm drawdown is a calibration baseline, not a forecast. Any Republican underperformance may already be in the pricing.
The current picture is genuinely mixed. That is precisely why a single-factor read, “it is September, therefore sell”, is the most dangerous approach you can take right now.
Navigating the noise when every calendar says “be careful”
Zero-DTE mechanics, September seasonality, and election-cycle dynamics are each real forces. None of them is reliable enough on its own to drive a portfolio decision, and right now all three are visible in the same narrow window.
That is exactly why the mosaic method is the durable takeaway. Understanding each force individually is what equips you to weigh it against live signals, VIX level, term structure, realised versus implied spread, and dealer positioning, rather than defaulting to whichever narrative is loudest that day. The October window and the weeks before the midterm vote are when this multi-factor literacy pays off most, because that is when single-factor headlines will be most intense and most misleading.
This article is for informational purposes only and should not be considered financial advice. Investors should conduct their own research and consult with financial professionals before making investment decisions. Past performance does not guarantee future results, and any references to historical patterns are subject to small sample sizes and changing market conditions.