XSP options volume just set an all-time record. In August 2026, the mini-SPX contract averaged 241,000 contracts per day, according to Cboe. A large share of that flow is retail traders doing one specific thing: selling premium to generate income.
The appeal is easy to understand. Collect a premium up front, smooth out the ride, and produce cash flow without waiting on a dividend cheque. But nearly two decades of index data tell a more complicated story, one where lower risk carries a measurable, compounding price.
This piece gives you the specific numbers and the analytical framework to decide whether the risk-return trade-off in selling options for income actually fits your goals. Not a general warning that options are risky. An honest, data-grounded answer to whether the exchange is worth it for you.
What 19 years of Cboe data actually show about premium-selling returns
Start with the longest clean record available. Cboe’s S&P 500 Put Write Index tracks a collateralised short-put strategy from 3 January 2007 through 31 July 2026, a window that spans two major crashes, a rate shock, and one of the longest bull markets in modern history. That breadth is what makes it useful. It has been tested against most of the conditions a premium-seller would ever face.
Here is what the numbers show over the full period.
| Metric | S&P 500 Put Write Index | S&P 500 Total Return Index |
|---|---|---|
| Annualised Return | 7.1% | 10.9% |
| Annualised Volatility | 10.8% | ~15.5% |
| Maximum Drawdown | 32.7% | 50.9% |
| Timeframe | Jan 2007 – Jul 2026 | Jan 2007 – Jul 2026 |
One caveat matters before you read too much into these figures. The Put Write Index is a reference benchmark, not a backtest of any specific retail spread strategy. It sells cash-secured puts against a Treasury bill portfolio on a fixed schedule. Your own iron condors or short-dated puts will behave differently. Treat the index as the honest floor of the conversation, not a promise about your results.
The compounding cost of capped upside
The volatility numbers look attractive at first glance. A 10.8% annualised standard deviation against roughly 15.5% for the index, and a peak drawdown of 32.7% versus 50.9%, is a genuinely smoother ride. The strategy did what it claims to do.
But the return gap is where the real cost lives. A $100,000 starting balance compounding at 7.1% for 19 years grows to roughly $372,000. The same amount compounding at 10.9% grows to roughly $733,000. The smoother path cost about $361,000 in foregone wealth.
The 3.8 percentage point annual gap does not stay small. Over 19 years it nearly doubled the terminal wealth of full equity exposure relative to the premium-selling benchmark.
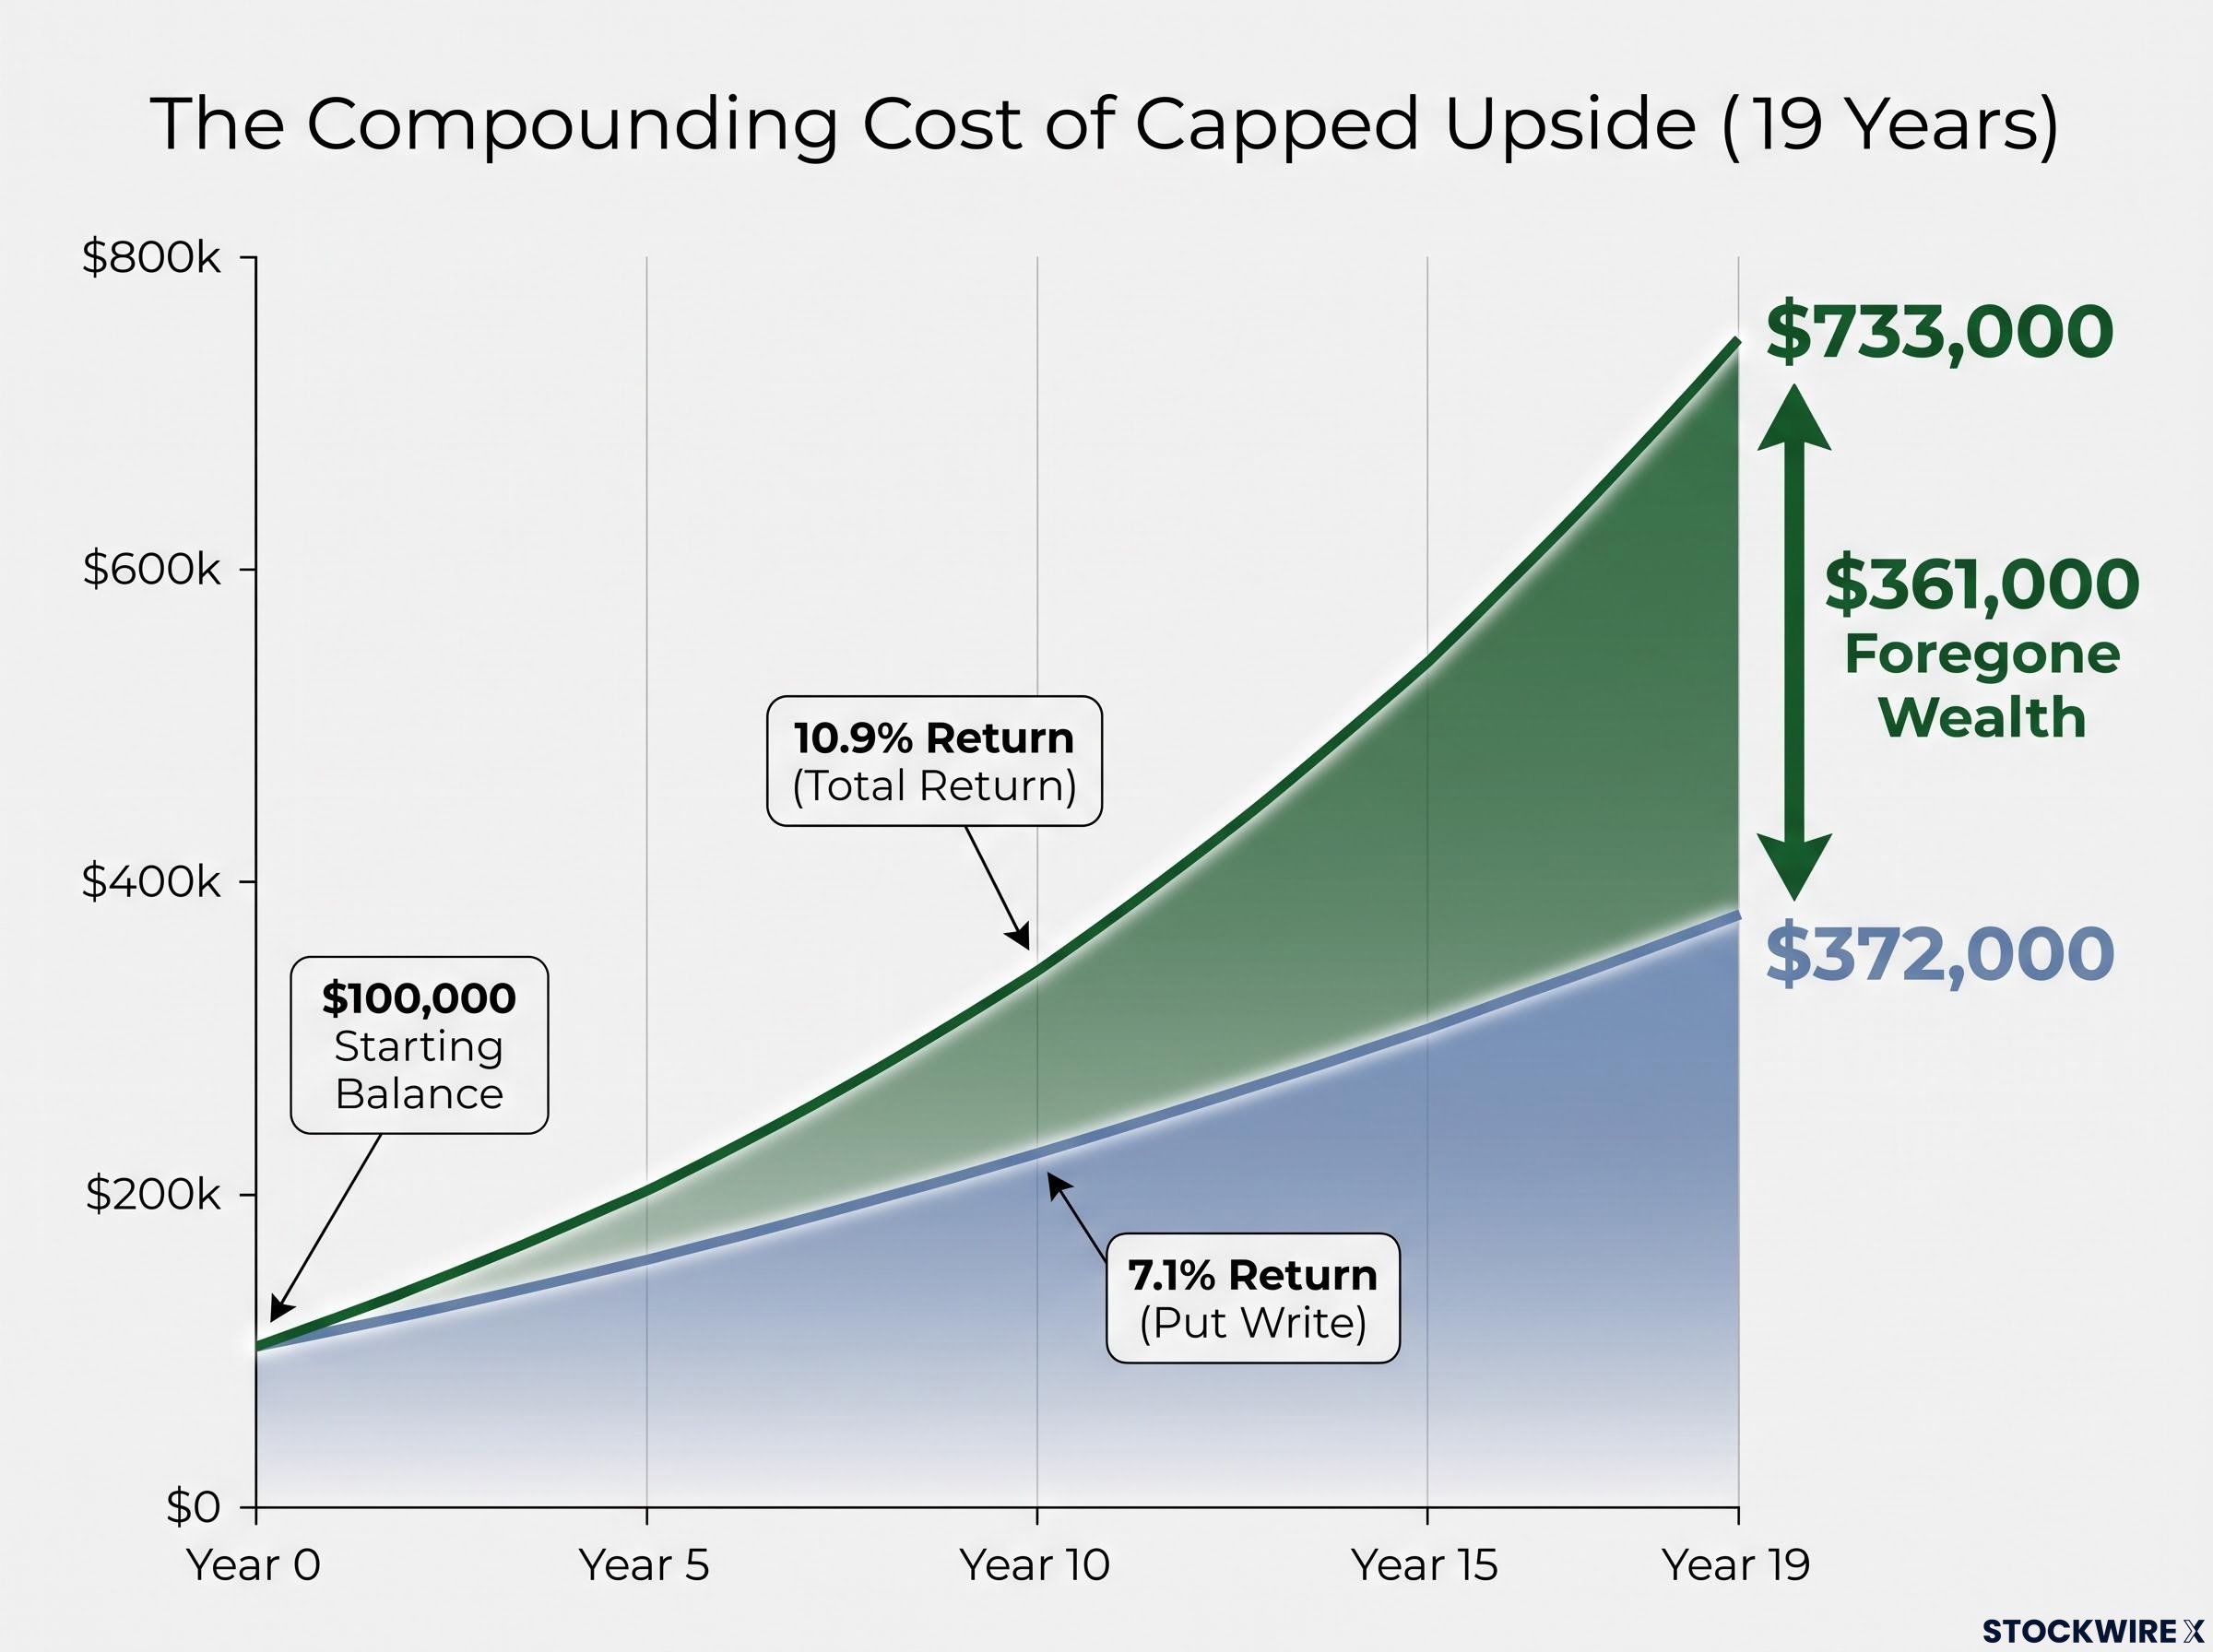
This is not an argument that the strategy is bad. It is a plain statement of what the volatility reduction costs. You are giving up roughly a third of the equity market’s annual gain, and over a multi-decade horizon that trade compounds into a very large number.
When big ASX news breaks, our subscribers know first
Why premium-selling underperforms in bull markets and survives bear ones
The return gap is not bad luck. It falls out of what the strategy is structurally doing, and once you understand the mechanism you can predict the behaviour rather than being surprised by it.
The core engine is the volatility risk premium (VRP). Option sellers earn income because implied volatility, the volatility priced into an option, has historically run above the volatility that actually shows up in the market. You are being paid to provide insurance, and on average that insurance has been priced above its eventual cost. That is the edge.
But the edge is conditional. It only pays when realised volatility stays below implied volatility. When realised volatility spikes above implied levels, the premium collected is too thin to cover the losses, and the edge disappears or reverses.
The volatility risk premium inversion documented in slow-moving crises is the hardest scenario for premium sellers to price: in January 2009, the spread between 3-month implied and realised volatility on the S&P 500 reached roughly negative 33 volatility points, a magnitude that collected premium could never offset.
The second force is short gamma. Put-writes and short calls are short-gamma positions, meaning their profit and loss worsens as the underlying moves sharply in either direction. In a sustained uptrend, sold options continuously cap your upside, replacing the larger equity risk premium with the smaller volatility risk premium.
The third force is skew. Index options carry downside skew, so puts are richer than calls. That makes put-selling attractive in calm markets, but it embeds crash risk that the premium does not fully compensate. Research on short-dated index option-selling found average returns turned negative through the 2020 COVID crash, a direct demonstration that skew and crash risk can overwhelm the income.
Here is how the strategy behaves across the three regimes that matter:
- Range-bound markets: realised volatility stays below implied, sellers keep most of the premium, and the VRP works as marketed.
- Persistent bull trend: foregone upside dominates, the equity risk premium you gave up outpaces the premium you collected, and the strategy lags simple equity holding.
- Sharp crash: downside skew and short gamma dominate, losses cluster, and the premium is insufficient to offset a fast gap move.
When the edge disappears
The VRP is not an always-on income machine. Practitioner frameworks are explicit that the trade only behaves as advertised under specific conditions: a high implied volatility rank at entry, realised volatility staying below implied, and a market that is range-bound or only moderately declining.
Step outside those conditions, especially into a strong bull market, and the opportunity cost of foregone upside compounds in exactly the way the Cboe return gap shows. Understanding this tells you the strategy is not market-neutral. It is a specific bet that implied volatility will stay above realised volatility, and that bet fails in precisely the conditions that already hurt most portfolios.
How premium-selling strategies have behaved in actual stress episodes
Theory is one thing. What matters to you is how these strategies held up when markets actually broke. Three named episodes let you see whether the mechanism holds across different shapes of stress.
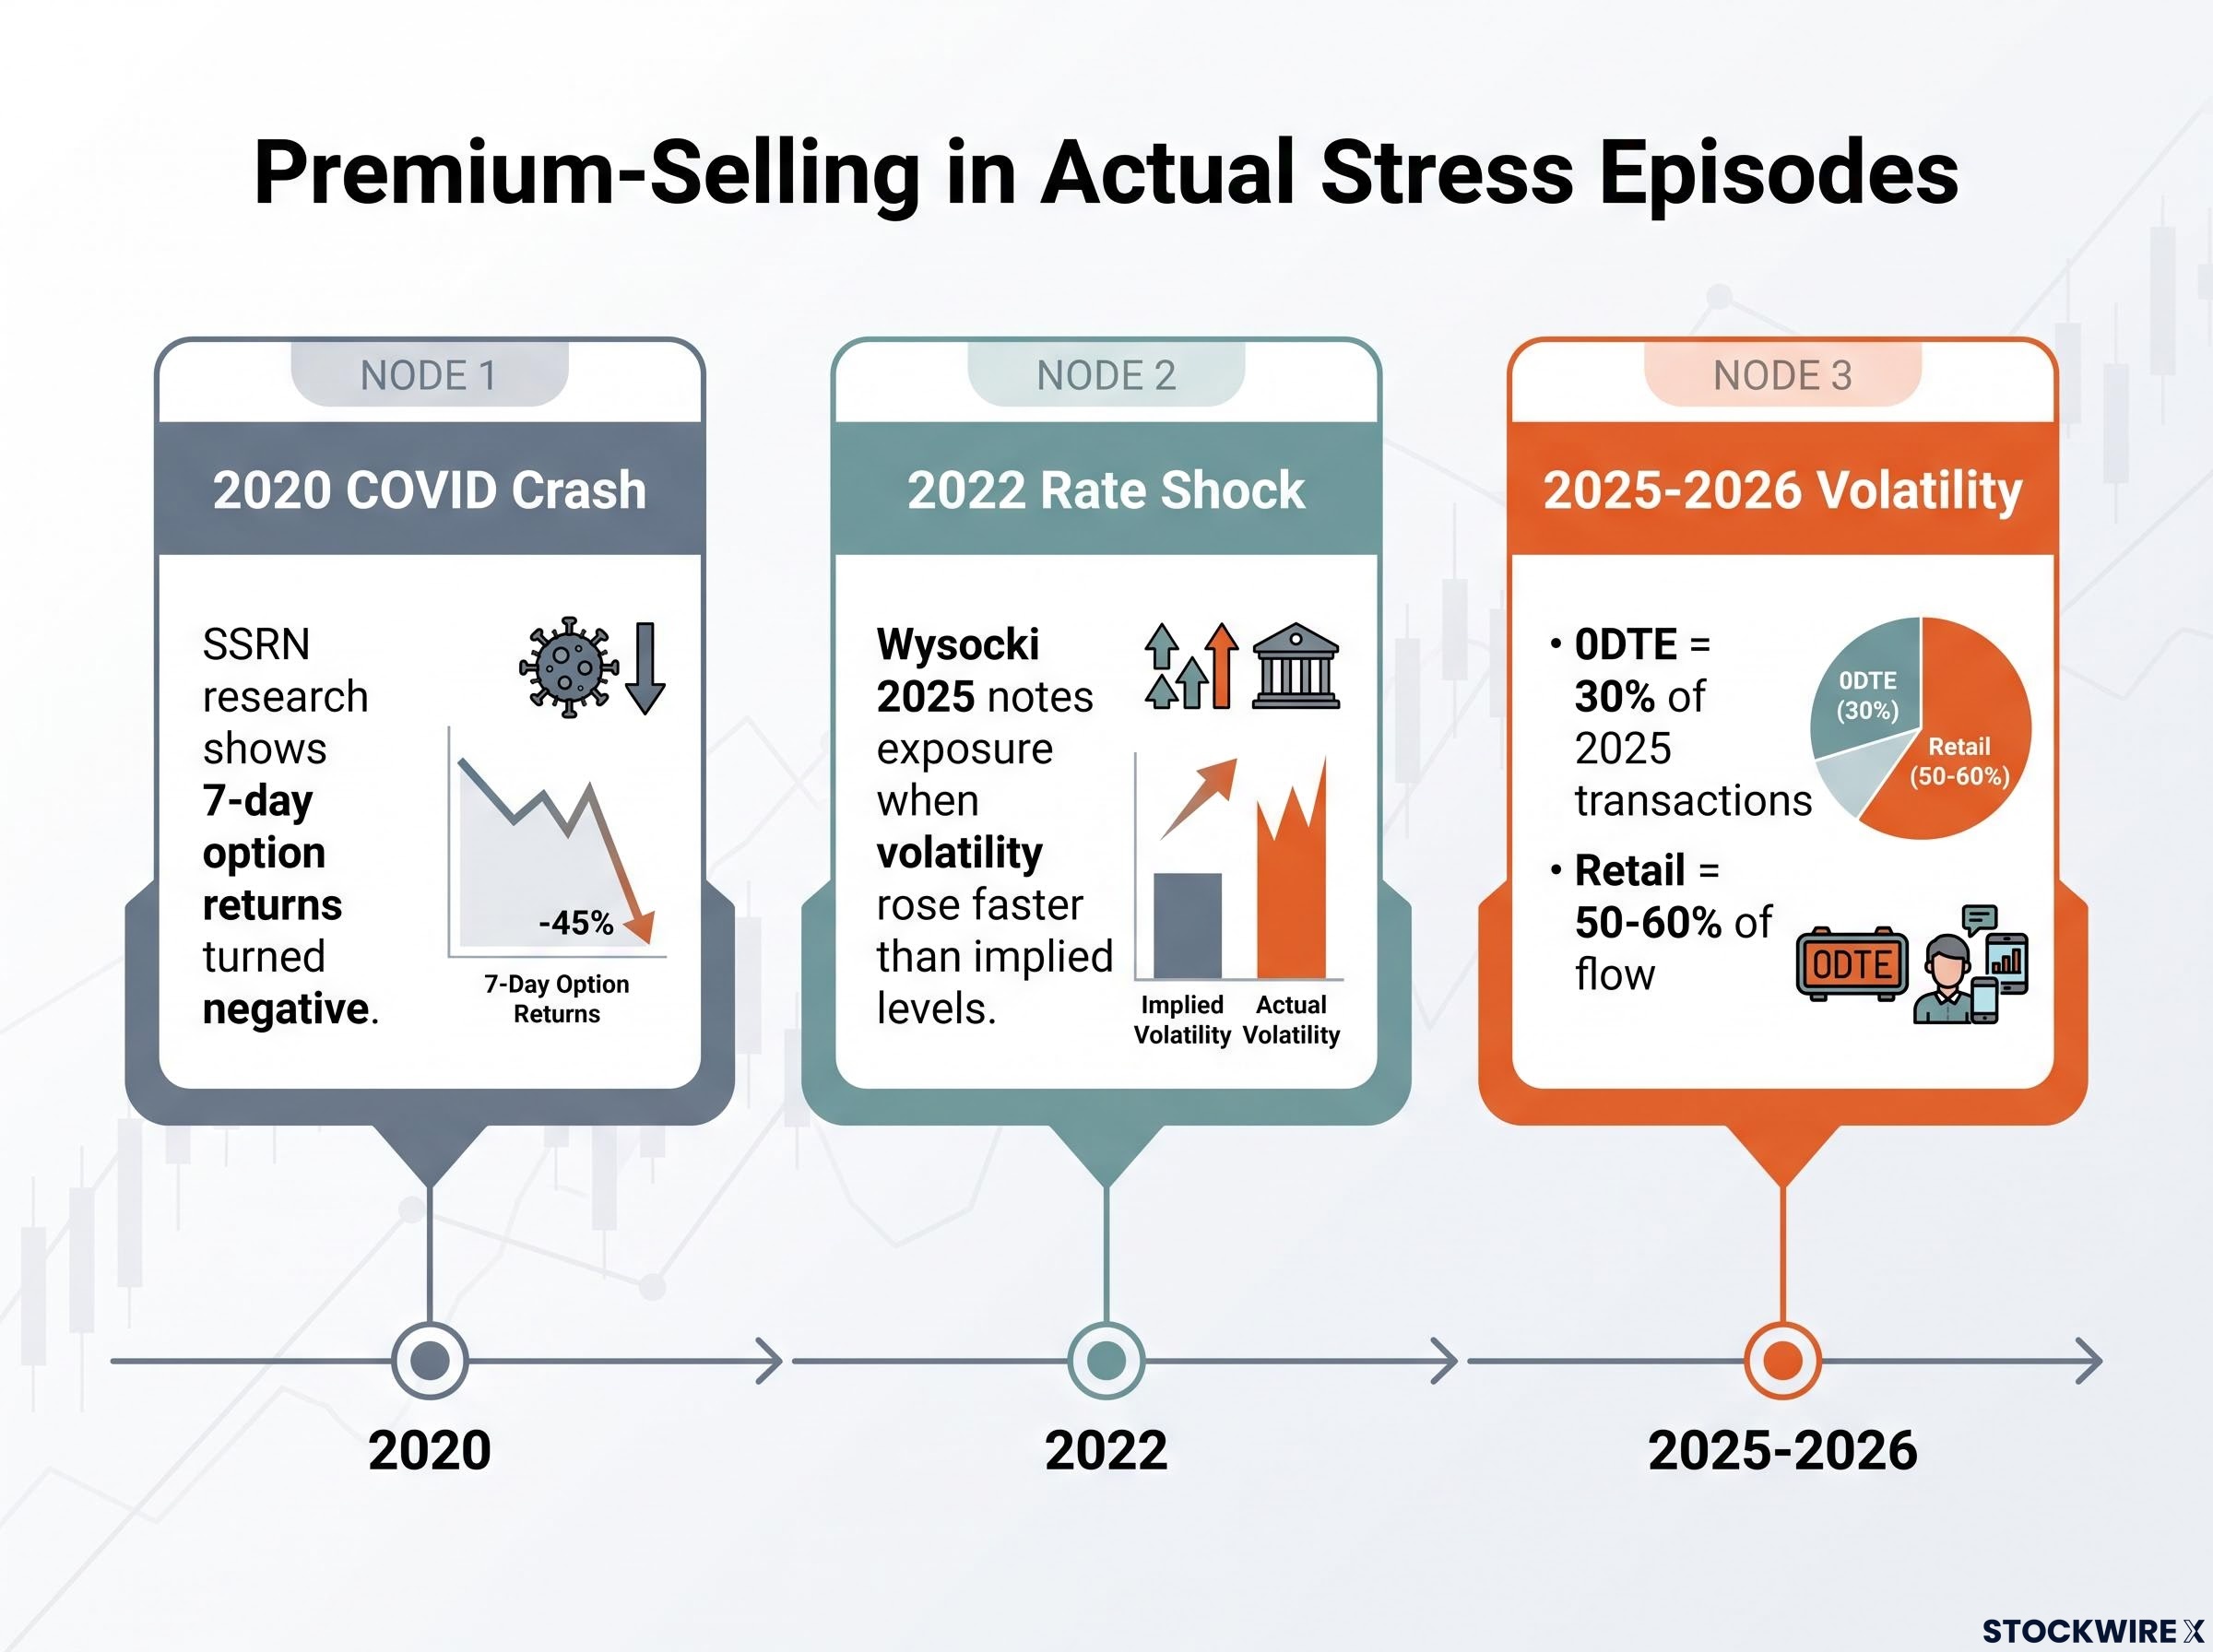
- 2020 COVID crash. SSRN research testing strategies that continuously sell 7-day-to-expiry index options found that all average returns turned negative through the crash and recovery. Theta decay and the VRP were simply insufficient against a fast, violent gap move. This is the single most counterintuitive result for income seekers, because it shows the income engine failing exactly when insurance premiums should have been highest.
- 2022 rate shock. Systematic option-writing came through the rate-hike environment with lower volatility and better risk-adjusted returns overall, according to academic work including Wysocki 2025. But the strategies remained exposed whenever volatility rose faster than implied levels could compensate. The takeaway is that discipline, strict entry filters, conservative sizing, and active rolling, was the difference between surviving and not.
- 2025-2026 volatility episodes. With 0DTE contracts representing roughly 30% of all options transactions in 2025, short-tenor premium-selling amplified intraday profit-and-loss swings during volatility spikes. Retail is estimated at 50-60% of that 0DTE flow. Position sizing and risk management, not strategy selection, became the variable that decided outcomes.
Zero DTE gamma exposure runs 2-5 times higher than equivalent weekly contracts and up to 10 times higher near the session close, which is why the 2025-2026 volatility episodes described above produced intraday P&L swings that outpaced any historical analogue from the pre-0DTE era.
SSRN research found that all average returns from 7-day index option-selling strategies turned negative during 2020, including through the COVID crash and recovery.
Even the collateralised Put Write Index, a conservative structure by design, still posted a 32.7% maximum drawdown. That is meaningfully better than the equity index’s 50.9%, but it is a long way from safe.
The stress record tells you that premium-selling does not eliminate downside risk in a crash. It reshapes it. And whether that reshaping helps you depends entirely on how your positions are sized and managed when the market gaps against you. The “80% probability of profit” figures in the marketing are not wrong, but the 20% loss scenarios do not spread smoothly across time. They cluster in the exact conditions that are already punishing your broader portfolio.
The volatility risk premium as a source of return: mechanism and limits
Set the theory aside for a moment and think about what this feels like in practice. You sell a put, a month passes, the market drifts sideways, and the premium is yours. Do it again and again and the cash keeps arriving. It feels like collecting rent.
It is not rent. You are running an insurance book. The volatility risk premium is the compensation you earn for selling protection, and historically the insurance premium has been set above its actuarial cost, the volatility that eventually materialises. That gap is real and documented across index options markets over long periods.
But the VRP has hard limits as a return source, and you need all three of them in view before you decide anything.
- Source of return: the VRP pays you to sell insurance. The equity risk premium pays you to own growth. Over long bull cycles, growth is the larger cheque.
- Typical volatility level: the Put Write benchmark carried 10.8% volatility against roughly 15.5% for the index. Lower volatility exposure earns lower compensation, which is exactly why the 7.1% return trailed the 10.9% equity return.
- Worst-case timing: your worst outcomes as an insurance seller arrive when everyone else’s do, in a crash, when correlations spike and the premium cannot cover the claim.
- Suitability horizon: the equity risk premium tends to win over long horizons focused on terminal wealth, while the VRP suits shorter horizons focused on smoother income.
Academic framing from Wysocki 2025 lands the same point. Systematic index option-writing can produce superior risk-adjusted returns relative to buy-and-hold, but it typically underperforms in strong bull markets where the equity risk premium dominates.
Who the trade-off actually suits
Reframing the VRP as an insurance premium changes how you should evaluate any premium-selling strategy or fund. You are not a dividend investor collecting yield. You are an underwriter, and underwriters think about reserving, sizing, and worst-case claims, not smooth equity curves.
That points the suitability question at your goals. If your objective is terminal wealth, holding equities is more likely to win. If your objective is volatility reduction and steadier income, premium-selling is more likely to satisfy, and it can be structured for cash generation. Both are legitimate goals; they are just different ones.
FINRA has repeatedly warned that uncovered option writing carries substantial, sometimes unlimited, downside, and that the Greeks, margin mechanics, and early assignment are routinely underestimated by retail traders. In plain terms: this is not set-and-forget income. With retail now around 30% of total options volume and heavily concentrated in 0DTE and short-dated structures, a large population may be sitting exactly in the gap between marketed win-rates and actual tail outcomes.
Making the data work for your portfolio decision
None of this makes premium-selling inferior in every situation. It makes it a genuine trade-off with legitimate cases on both sides. The conditions under which it delivers are specific, and they require active management rather than a passive hold. The honest task is to work out whether your situation matches those conditions.
Three diagnostic questions will settle it faster than any backtest:
- What is my primary financial goal, terminal wealth or income smoothing? An honest answer here tells you which side of the 7.1% versus 10.9% trade you actually want to be on.
- What is my realistic capacity to actively manage entry criteria, sizing, and rolling? If the honest answer is “not much,” the strategy’s edge, which depends on discipline, is not available to you.
The entry criteria for premium selling are more demanding than a single IV rank reading: practitioner frameworks require convergence across IV rank, IV percentile, the IV/HV ratio, and VIX term structure before a position is considered eligible, because each filter separately removes a category of losing trade.
- How will I handle a 30% drawdown in this strategy at the same time my equity portfolio is also falling? If that scenario would force you to close at the worst possible moment, you are not sized correctly for it.
XSP mini-SPX options set an all-time monthly record of 241,000 contracts per day in August 2026, a large share of it retail premium-selling.
That record participation means the strategy has never been more accessible. But accessibility does not change the economics. The 32.7% maximum drawdown is the honest benchmark for what “lower risk” really means: not zero risk, just meaningfully less than 50.9%. Work through the three questions before you place a trade, not during your first stress episode.
What the Cboe data settles, and what it leaves open
The 19-year record settles some things cleanly. Over the full period from January 2007 to July 2026, premium-selling reduced volatility and drawdowns materially, and it did so at a real, compounding cost to total return. Both halves of that sentence are facts, not opinions.
Over January 2007 to July 2026: 7.1% versus 10.9% annualised return, 10.8% versus 15.5% annualised volatility, and a 32.7% versus 50.9% maximum drawdown.
What the data cannot settle is the future. Whether the volatility risk premium will keep compensating sellers as it has, whether the record surge in XSP and 0DTE participation changes the dynamics when retail is a 30-50% share of the market rather than the 10% it was before 2020, and whether your specific implementation will track the index’s collateralised structure, are all open questions no historical record can close.
The equity risk premium outlook over the next decade complicates the simple comparison this article draws: Bank of America’s valuation model projects cap-weighted S&P 500 annualised returns of -3% to +2%, which would substantially narrow the 3.8 percentage point gap between buy-and-hold and premium-selling if it materialises.
So the right framing is not whether selling options for income is good or bad. It is whether the specific exchange it offers, lower volatility at lower long-run return, matches your goals, your time horizon, and your capacity to manage the position actively. The strategy delivers exactly what it promises and costs exactly what it costs. The only question that matters is whether that exchange rate suits your financial life.
This article is for informational purposes only and should not be considered financial advice. Investors should conduct their own research and consult with financial professionals before making investment decisions. Past performance does not guarantee future results. Financial projections are subject to market conditions and various risk factors.