Semiconductor stocks just had their worst month since October 2008, and the companies responsible are still planning to spend more than $600 billion on AI infrastructure this year alone.
That is not a contradiction. It is the central tension of the AI trade in 2026.
What began as a conviction rally that carried U.S. equities to record highs has since passed through a punishing bear market in chip stocks, a partial Nvidia-driven recovery, and a September reversal triggered by geopolitics and a bond market repricing. Each phase ran on a distinct mechanism.
Understanding those mechanisms is what separates a reasoned position on AI equities from a reactive one.
This maps the full arc of the trade, explains the return-on-investment arithmetic at the heart of the July selloff, and identifies the specific conditions analysts say must be met before the next leg can be trusted. You will leave knowing which signals to watch and which market narratives to discount.
How the AI rally carried markets to record highs, then reversed sharply
The rally started in the chips. Between April and June 2026, semiconductor stocks, treated as the primary beneficiaries of AI spending since late 2022, pulled the broader U.S. market to fresh all-time highs, holding the line even as Middle East tensions simmered in the background.
The Philadelphia Semiconductor Index (SOX) set a record high on 22 June 2026. That was the peak.
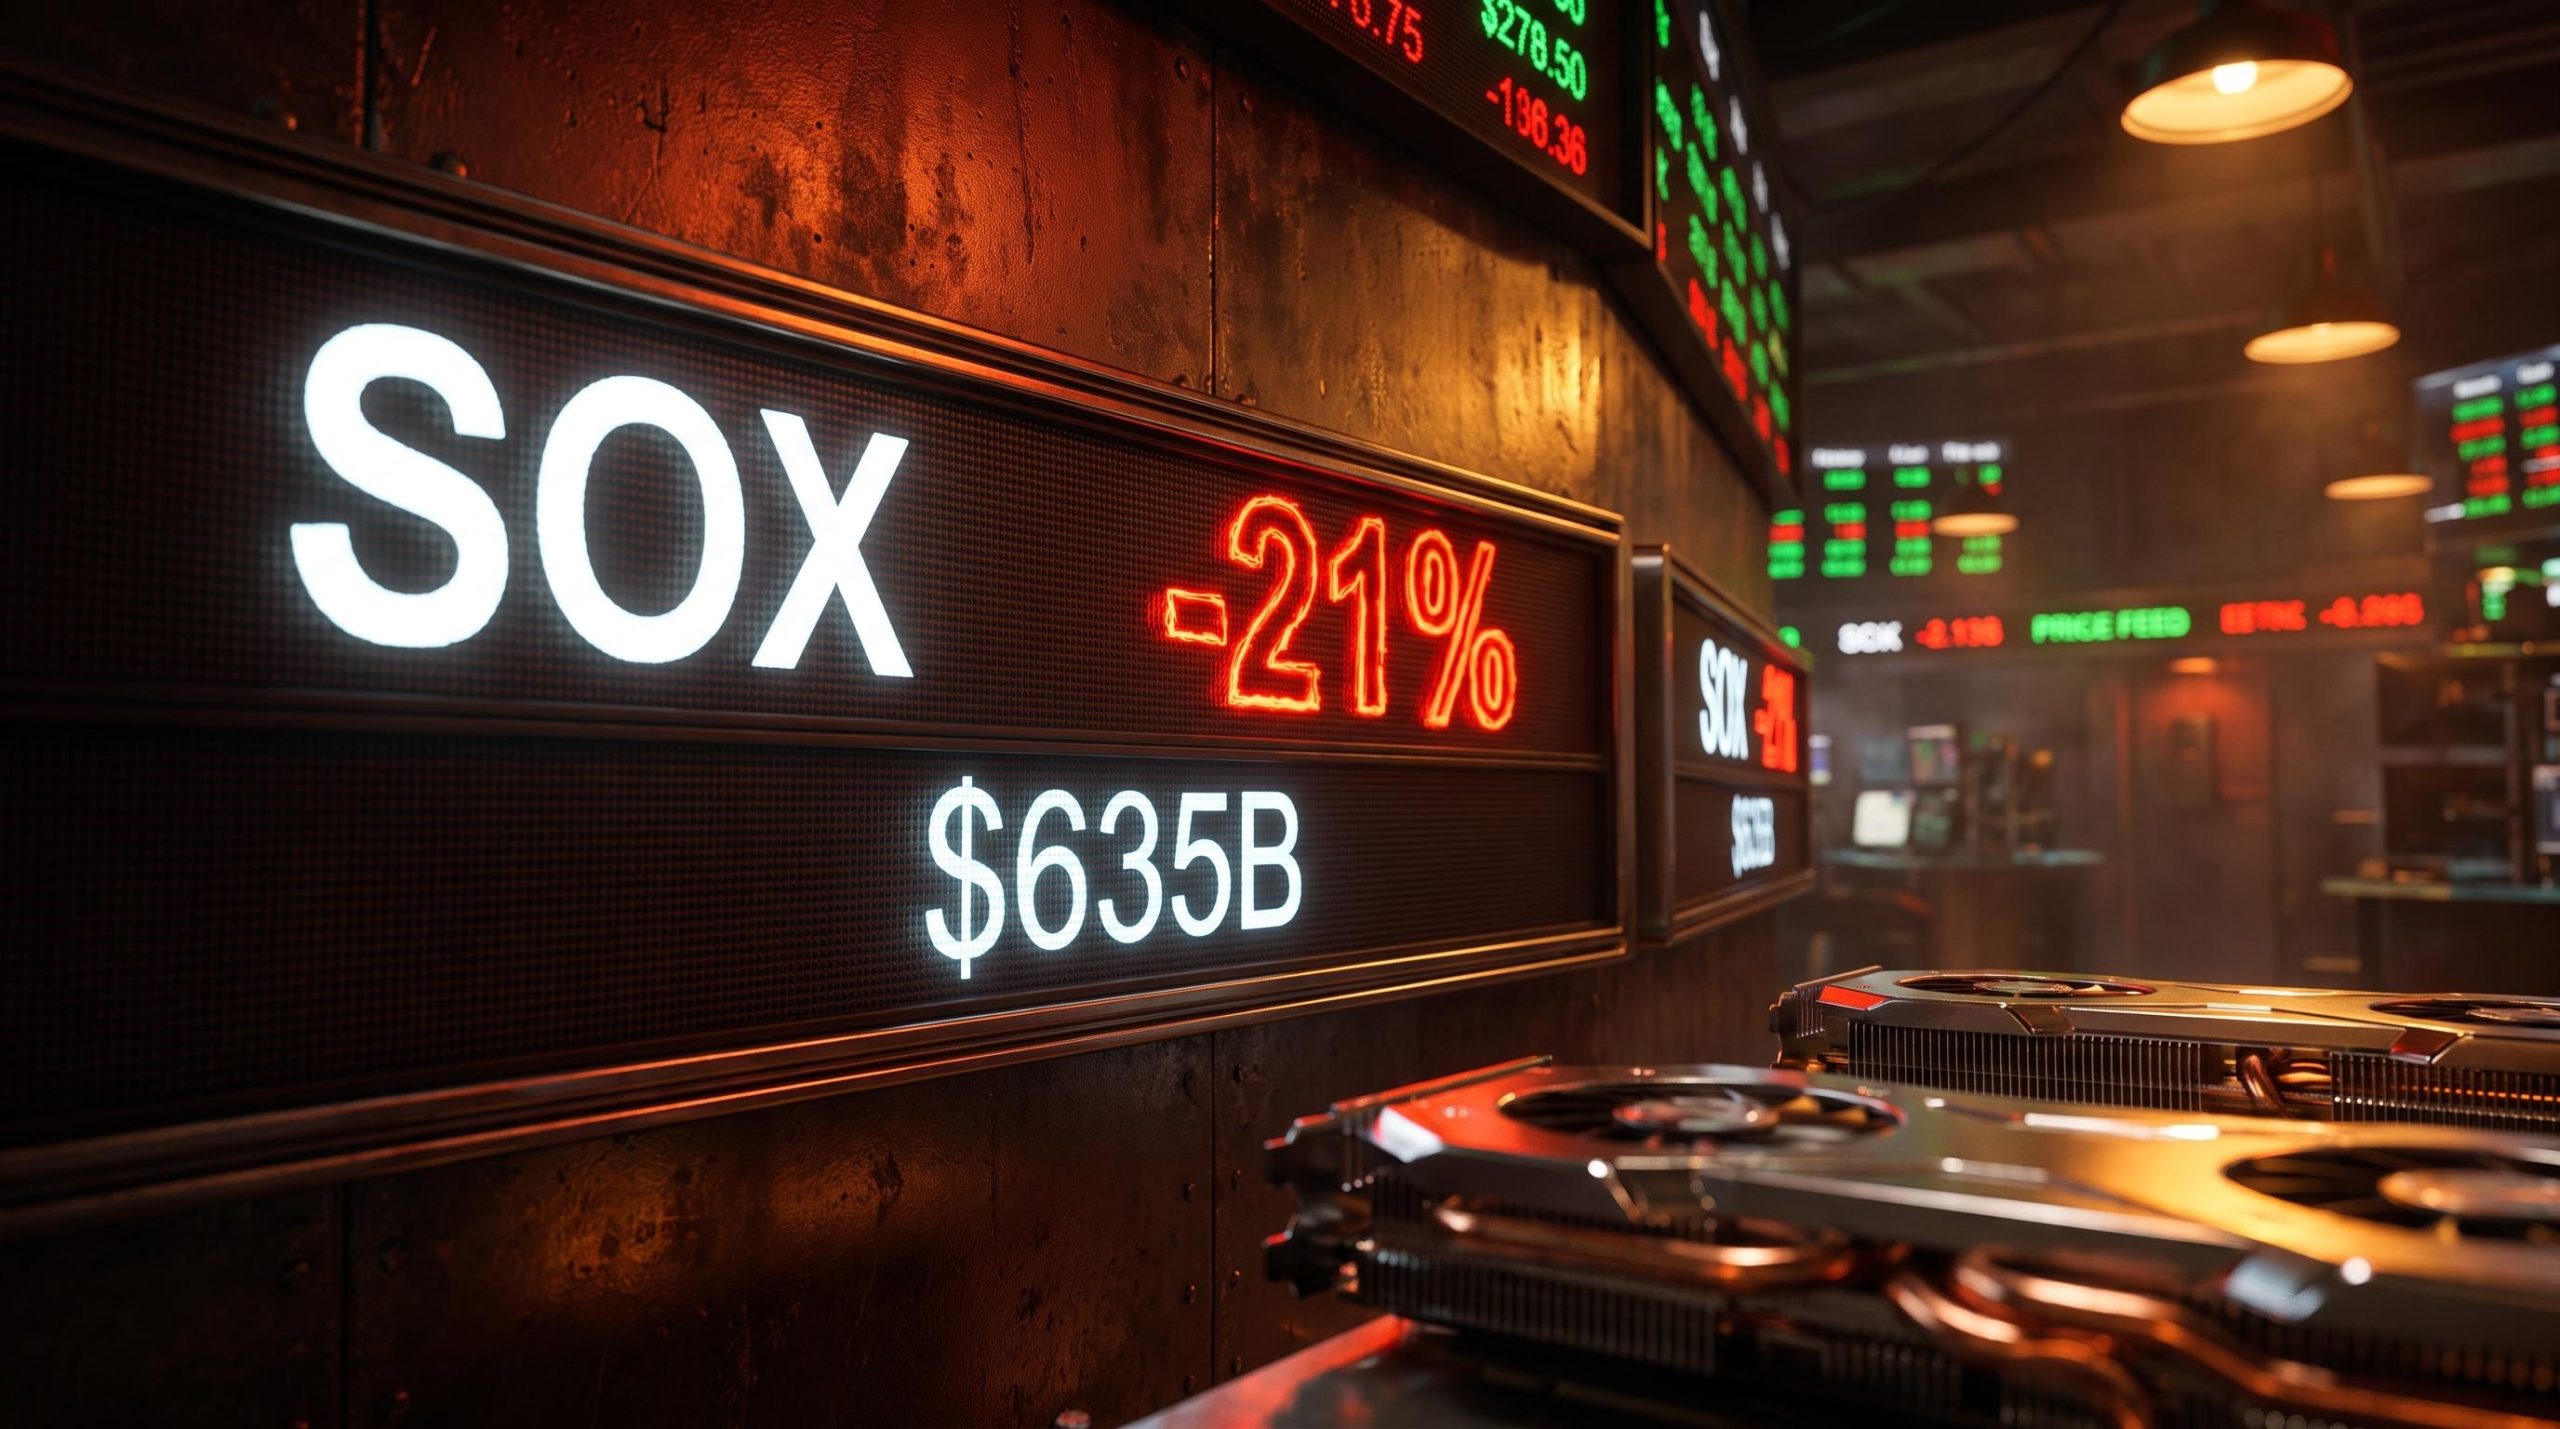
Then July arrived, and the same trade that had carried markets up became the trade that broke them. The SOX dropped 21% in July alone, its worst single month since the depths of the financial crisis.
The SOX’s July decline of 21% marked its worst monthly performance since October 2008.
This was not a routine pullback. Peak to trough, the SOX fell 29% between 22 June and 29 July, a confirmed bear market move in the most crowded corner of the equity market. The damage spread across the entire chip complex.
| Index / ETF | Peak Date | Trough Date | Peak-to-Trough Decline | July-Only Decline |
|---|---|---|---|---|
| SOX | 22 Jun 2026 | 29 Jul 2026 | 29% | 21% |
| SOXX | 22 Jun 2026 | Jul 2026 | 24% | Not separately reported |
| SMH | 22 Jun 2026 | Jul 2026 | 20% | Not separately reported |
| DRAM | Jun 2026 | Jul 2026 | ~40% | Not separately reported |
| SOXL | Jun 2026 | Jul 2026 | 61% | Not separately reported |
The Roundhill Memory ETF (DRAM) shed almost 40%, and the leveraged Direxion Daily Semiconductor Bull 3X (SOXL) collapsed 61%. Declines of that magnitude tell you this was not sentiment noise; it was a structural repricing of the AI growth thesis, and a lesson in how quickly momentum-driven valuations unwind when a single narrative assumption is challenged.
The assumption in question was simple. Would the spending ever pay off.
When big ASX news breaks, our subscribers know first
The $635 billion question: why investors turned on AI capital expenditure
The selloff had one trigger above all others: the sheer scale of what hyperscalers plan to spend, weighed against how little they currently earn from it.
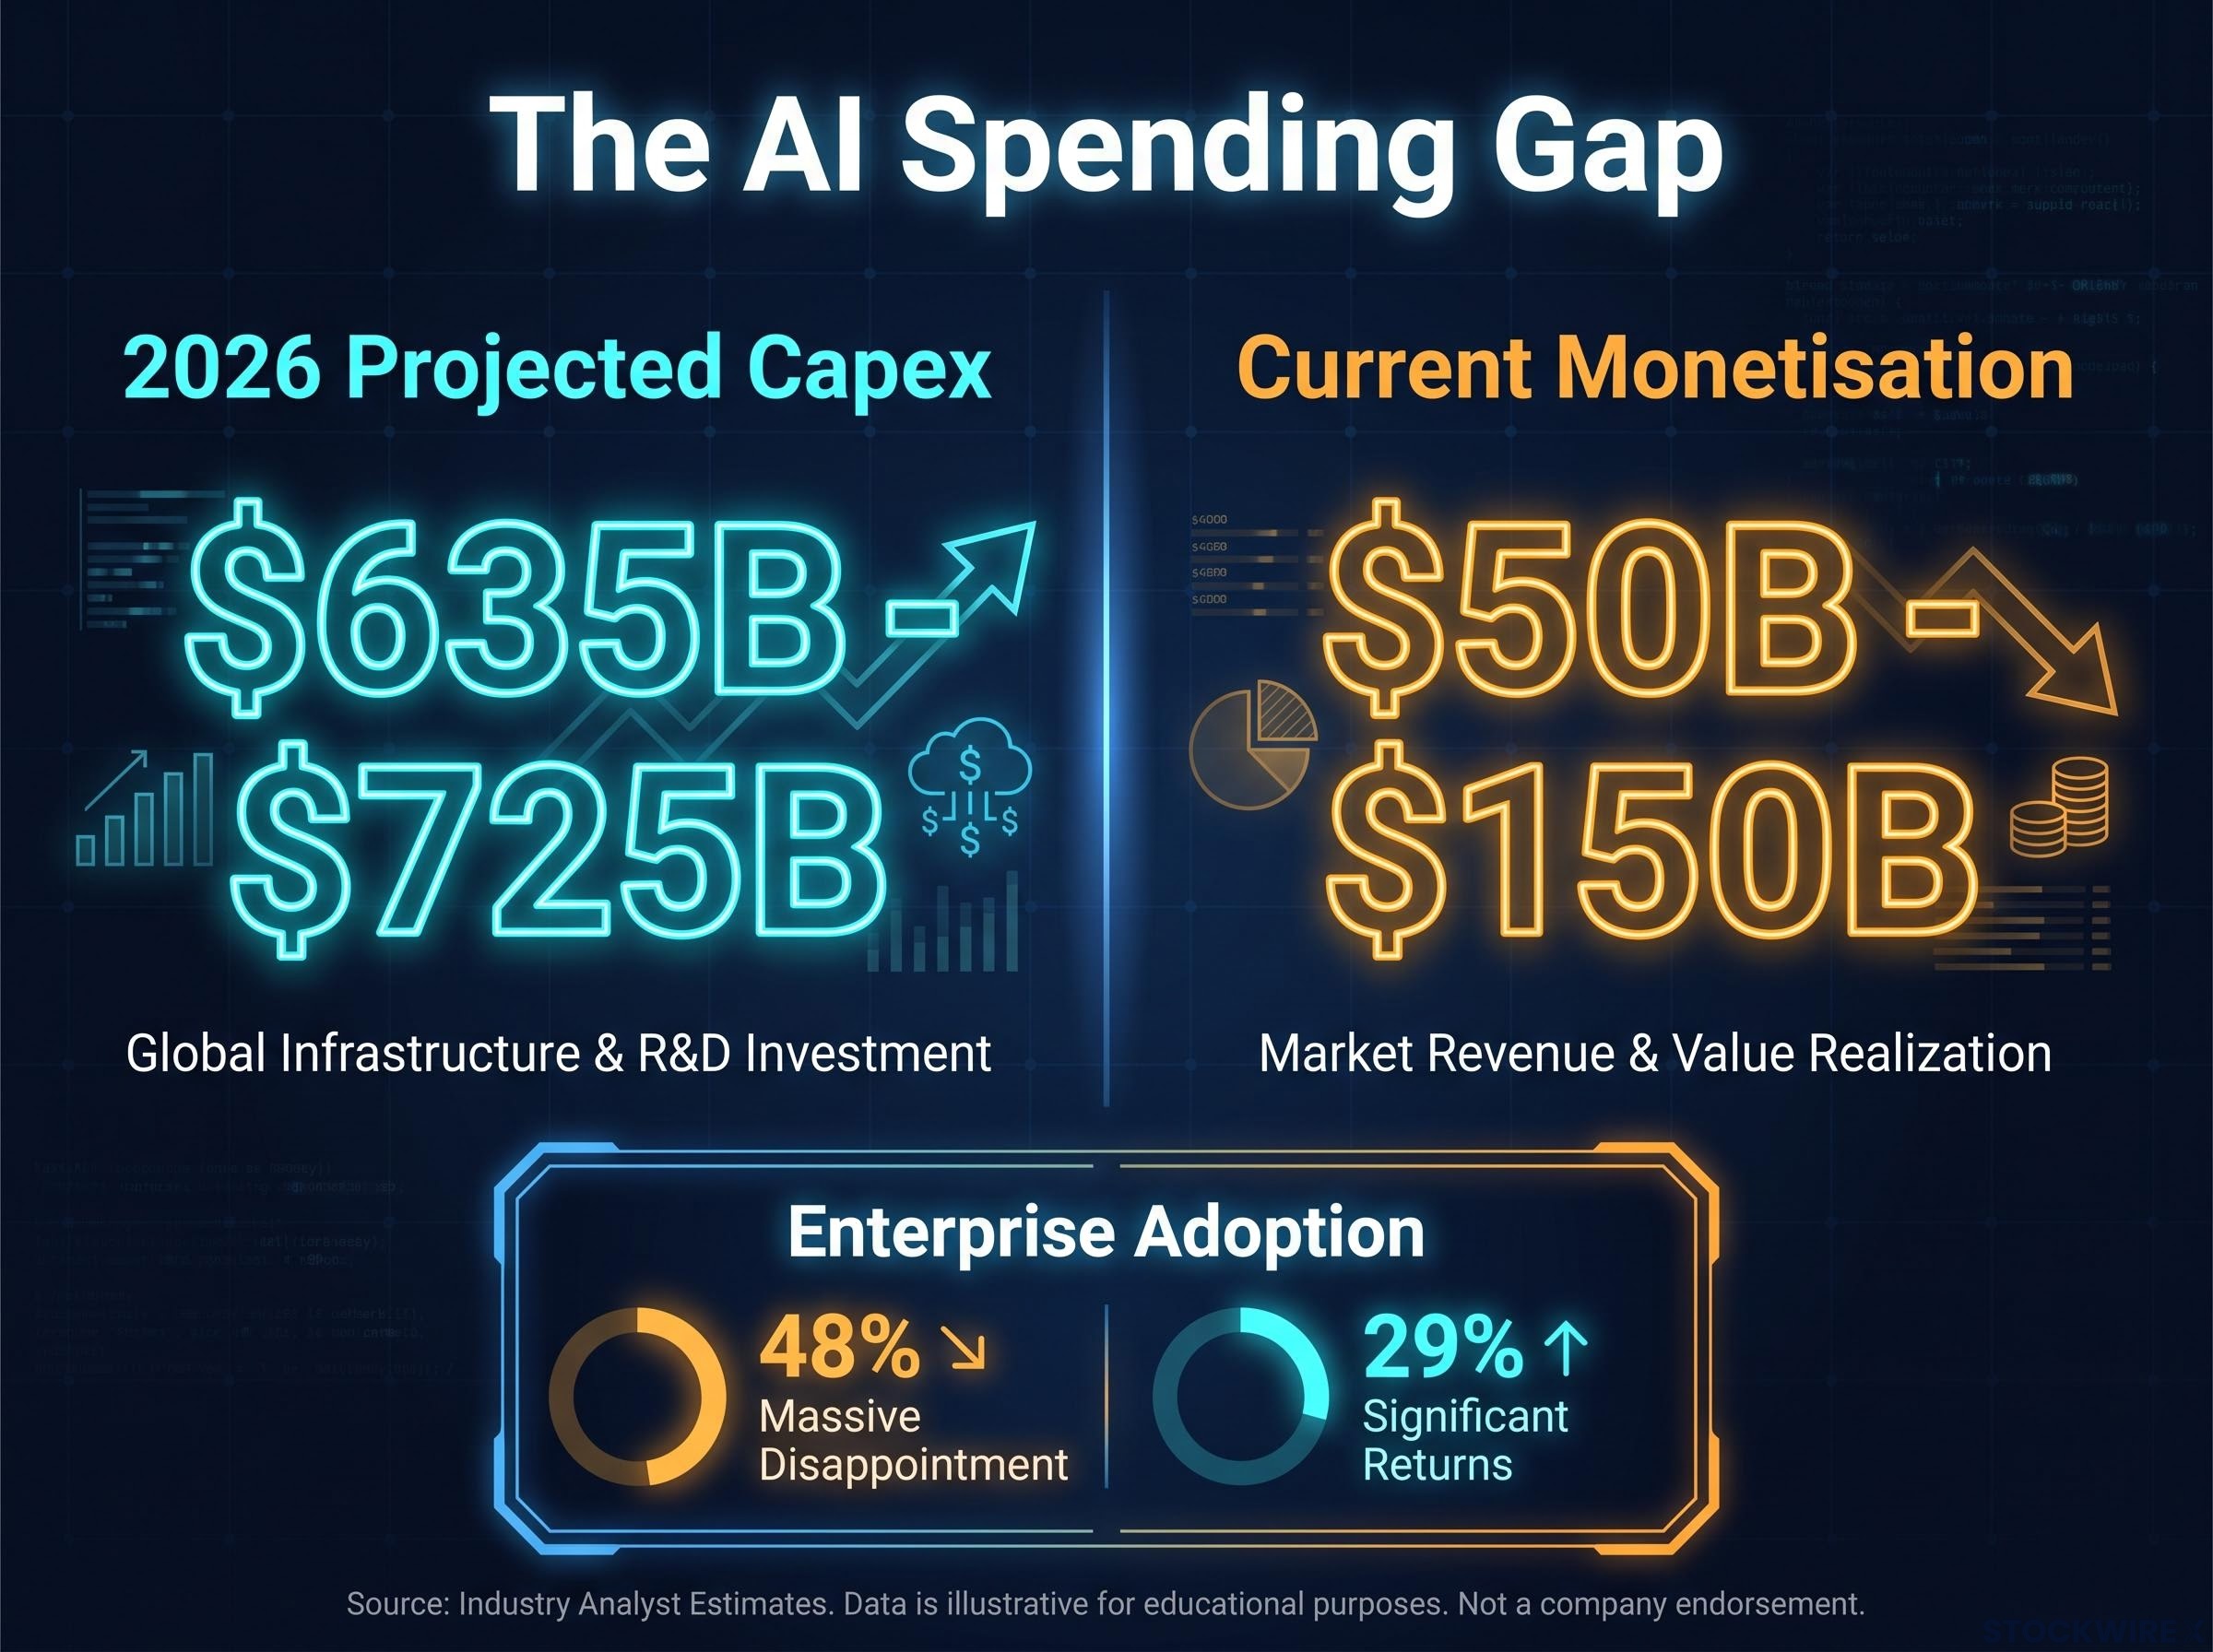
Combined, Microsoft, Alphabet, Amazon, and Meta are projected to spend between $635 billion and $725 billion on AI-related infrastructure in 2026. That is up roughly 77% from the approximately $410 billion spent in 2025.
The hyperscaler capex trajectory into 2027 adds a further dimension to this concern: Microsoft reported an annualised AI revenue run rate surpassing $37 billion, up 123% year-over-year, while the four major cloud operators collectively issued roughly $121 billion in debt in 2025, approximately four times their five-year average, raising structural questions about whether debt-funded infrastructure spending can sustain itself if monetisation lags.
A 77% jump in a single year is the variable that changed investor sentiment. The individual guidance figures make the acceleration concrete.
| Company | 2025 Capex | 2026 Guidance | Year-over-Year Change |
|---|---|---|---|
| Microsoft | Not separately reported | ~$190B | +61% |
| Alphabet | $91.45B | $175B-$185B | More than double |
| Meta | ~$72.2B | $125B-$145B | Up sharply |
| Amazon | Not separately reported | ~$200B | +50% |
Several of these sub-figures, including Alphabet’s and Meta’s 2025 totals and Amazon’s growth rate, remain directional rather than fully verified, so treat them as scale indicators rather than precise inputs. The aggregate, however, is the number that matters.
Now set that spending against what the industry currently earns. Total AI monetisation sits somewhere in the $50 billion to $150 billion range. According to recent market analysis, that is not enough to generate a 10%-plus return on the infrastructure build without a rapid acceleration in utilisation.
That is not a theoretical worry. It is a cash-flow arithmetic problem, and every company in the chip supply chain is now being asked to answer for it.
The ground-level data corroborates the top-down concern. Enterprise adoption surveys show a striking gap between promise and delivery.
48% of enterprise leaders describe AI adoption as a “massive disappointment,” and only 29% report significant returns on generative-AI investment.
What the monetisation gap actually means for the AI supply chain
Here is why this lands hardest on the chipmakers, not just the hyperscalers deploying the capital.
GPU and data centre demand is a direct function of hyperscaler confidence in future AI monetisation. When Microsoft or Amazon commits to another $40 billion quarter, that money flows into chips. Any hesitation in capex, therefore, signals straight into semiconductor order books.
The deeper fear is overbuild. If adoption does not accelerate to match the infrastructure being deployed right now, the risk is that data centres full of expensive GPUs sit underutilised, generating depreciation instead of cash flow. That is the scenario the July selloff was pricing in, and it is the scenario Nvidia’s earnings were about to test.
Nvidia’s results provided a floor, not a foundation
In late August, the AI narrative got the strongest possible counterargument. Nvidia reported Q2 FY2027 earnings, and the numbers were genuinely hard to argue with.
- Revenue of $96.2 billion, up 18% sequentially and 106% year-over-year
- Adjusted EPS of $2.22, ahead of the roughly $2.10 consensus
- Revenue a year earlier was $46.7 billion, showing the sheer pace of growth
- Gross margin guidance of 73.5% to 74.5%
This was the company’s 15th consecutive quarter of beating consensus. The forward guidance was the part that mattered most for the durability question.
CFO Colette Kress projected that revenue would grow 70% in fiscal year 2028, signalling multi-year infrastructure demand rather than a one-quarter spike.
That is the case for the bulls in a single sentence. The infrastructure cycle is real, it is continuing, and the company at the centre of it is guiding to another year of extraordinary growth.
Now hold the more complicated thought. Nvidia’s beat sparked the August recovery, but by late July, chip stocks had recaptured only about 10% of their prior drawdown.
A 10% recovery after a 29% peak-to-trough decline leaves the bulk of the downside firmly on the books. That gap is the difference between a floor and a foundation.
Nvidia’s results confirmed one thing: demand for AI infrastructure is durable. What they did not confirm is whether that demand converts into returns for the buyers spending the $635 billion, whether valuations can absorb a hostile rate environment, or whether the second-tier names beyond Nvidia can show the same discipline. You should read the August bounce as sentiment and positioning finding a level, not as a new uptrend, until those other questions get answered.
September answered none of them. It asked a new one instead.
September’s dual shock: geopolitics, bond yields, and a second pressure test for AI stocks
The recovery stalled because two things happened in sequence, and the second flowed directly from the first.
Stage one was geopolitical. Renewed U.S.-Iran military conflict flared in September 2026, raising fears of escalation across the Middle East and sending oil prices sharply higher. Morningstar and Grok verification put Brent crude at $97-$98 on supply-disruption fears, with WTI above $88. One source (FXEmpire) placed Brent nearer $92, so the higher figure carries more corroboration but should be read with that qualifier.
Stage two was the transmission into rates. Surging oil is an inflation signal, and an inflation signal moves the bond market.
The chain ran like this:
- Oil shock from the Iran conflict drives fears of renewed inflation
- Higher expected inflation triggers a global bond selloff
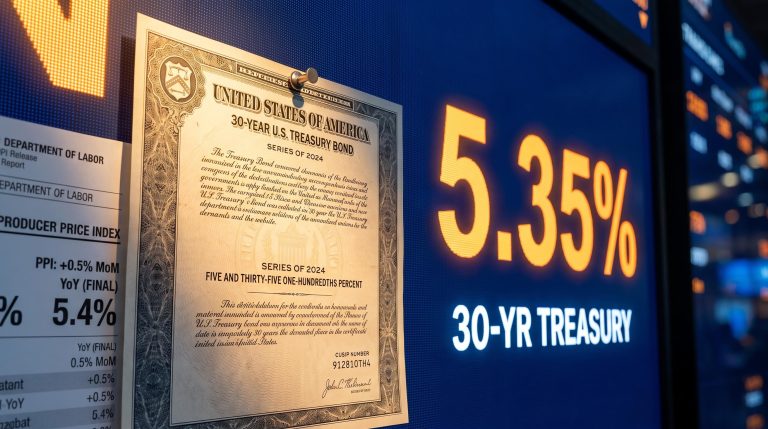
- The U.S. 10-year Treasury yield climbs to 4.80%, its highest since January 2025
- Rising discount rates spark a rapid rotation out of long-duration growth stocks
On 1 September 2026, the Nasdaq fell 0.90%, and Nvidia, AMD, and Micron each dropped around 2%. That is not a coincidence. It is the mechanism working exactly as it should.
Why rate sensitivity is now a permanent feature of the AI trade
The vulnerability here is structural, not seasonal. Long-duration growth stocks are penalised when yields rise because a higher discount rate reduces the present value of earnings expected years into the future, and AI valuations rest almost entirely on those distant projections.
Equity duration explains the precise mechanical link between rising yields and growth-stock drawdowns: Morgan Stanley estimates a 100 basis point increase in real yields drives 3-4 turns of multiple compression in U.S. growth stocks with no new fundamental information required, meaning a significant share of the September selloff in chip names can be attributed to discount-rate arithmetic alone rather than any change in the underlying AI demand outlook.
The capex angle sharpens the point. Hyperscaler infrastructure programmes are financed partly through debt, which means their free-cash-flow projections are acutely sensitive to borrowing costs.
A 10-year yield at 4.80% materially raises the discount rate applied to AI earnings. Even if the technology thesis is entirely correct, the math of today’s valuations gets harder to justify until yields retreat or monetisation accelerates. That makes rate sensitivity a permanent feature of the trade, not a September anomaly, and it means holding these stocks now requires a view on the macro environment, not just the product roadmap.
What a durable recovery actually requires
The way out of this uncertainty is not a hunch about direction. It is a checklist. Analysts have identified four conditions that would distinguish a durable recovery from a bear-market rally, and each addresses a specific weakness the July selloff and September reversal exposed.
- Sustained megacap earnings. Hyperscalers must keep delivering, with no slowdown flagged in their multi-year AI forward guidance.
- Disciplined AI investment. Second-tier tech names need to show improving profitability and clear investment frameworks, rather than chasing top-line growth.
- Supportive macro conditions. Interest rates and inflation must moderate, avoiding further upside surprises in yields or fresh geopolitical shocks.
- Tangible monetisation. Companies must prove they can convert historic capex into robust cash flow, easing the fear that GPU deployments outrun end-user demand.
Return to this list each earnings season. It turns a volatile, narratively noisy market theme into a set of observable signals you can actually track.
The distinction between trade shock versus cyclical bust matters for how investors position coming out of the July drawdown: BofA analysts Didier Scemama and Vivek Arya identified an 18% SOX underperformance versus the S&P 500 as the regime-defining threshold, noting that readings near this level have historically resolved as recoverable trade-shock episodes rather than the roughly 30% underperformance seen in full cyclical downturns.
The bubble debate in numbers
The obvious question underneath all of this is whether the AI trade is a bubble. The valuation data offers the strongest argument against that view.
Current AI stocks trade at 25x to 31x forward earnings, averaging around 26x. That is a different mathematical reality from the dot-com peak.
AI stocks currently average roughly 26x forward earnings, against approximately 70x at the peak of the 2000 dot-com bubble.
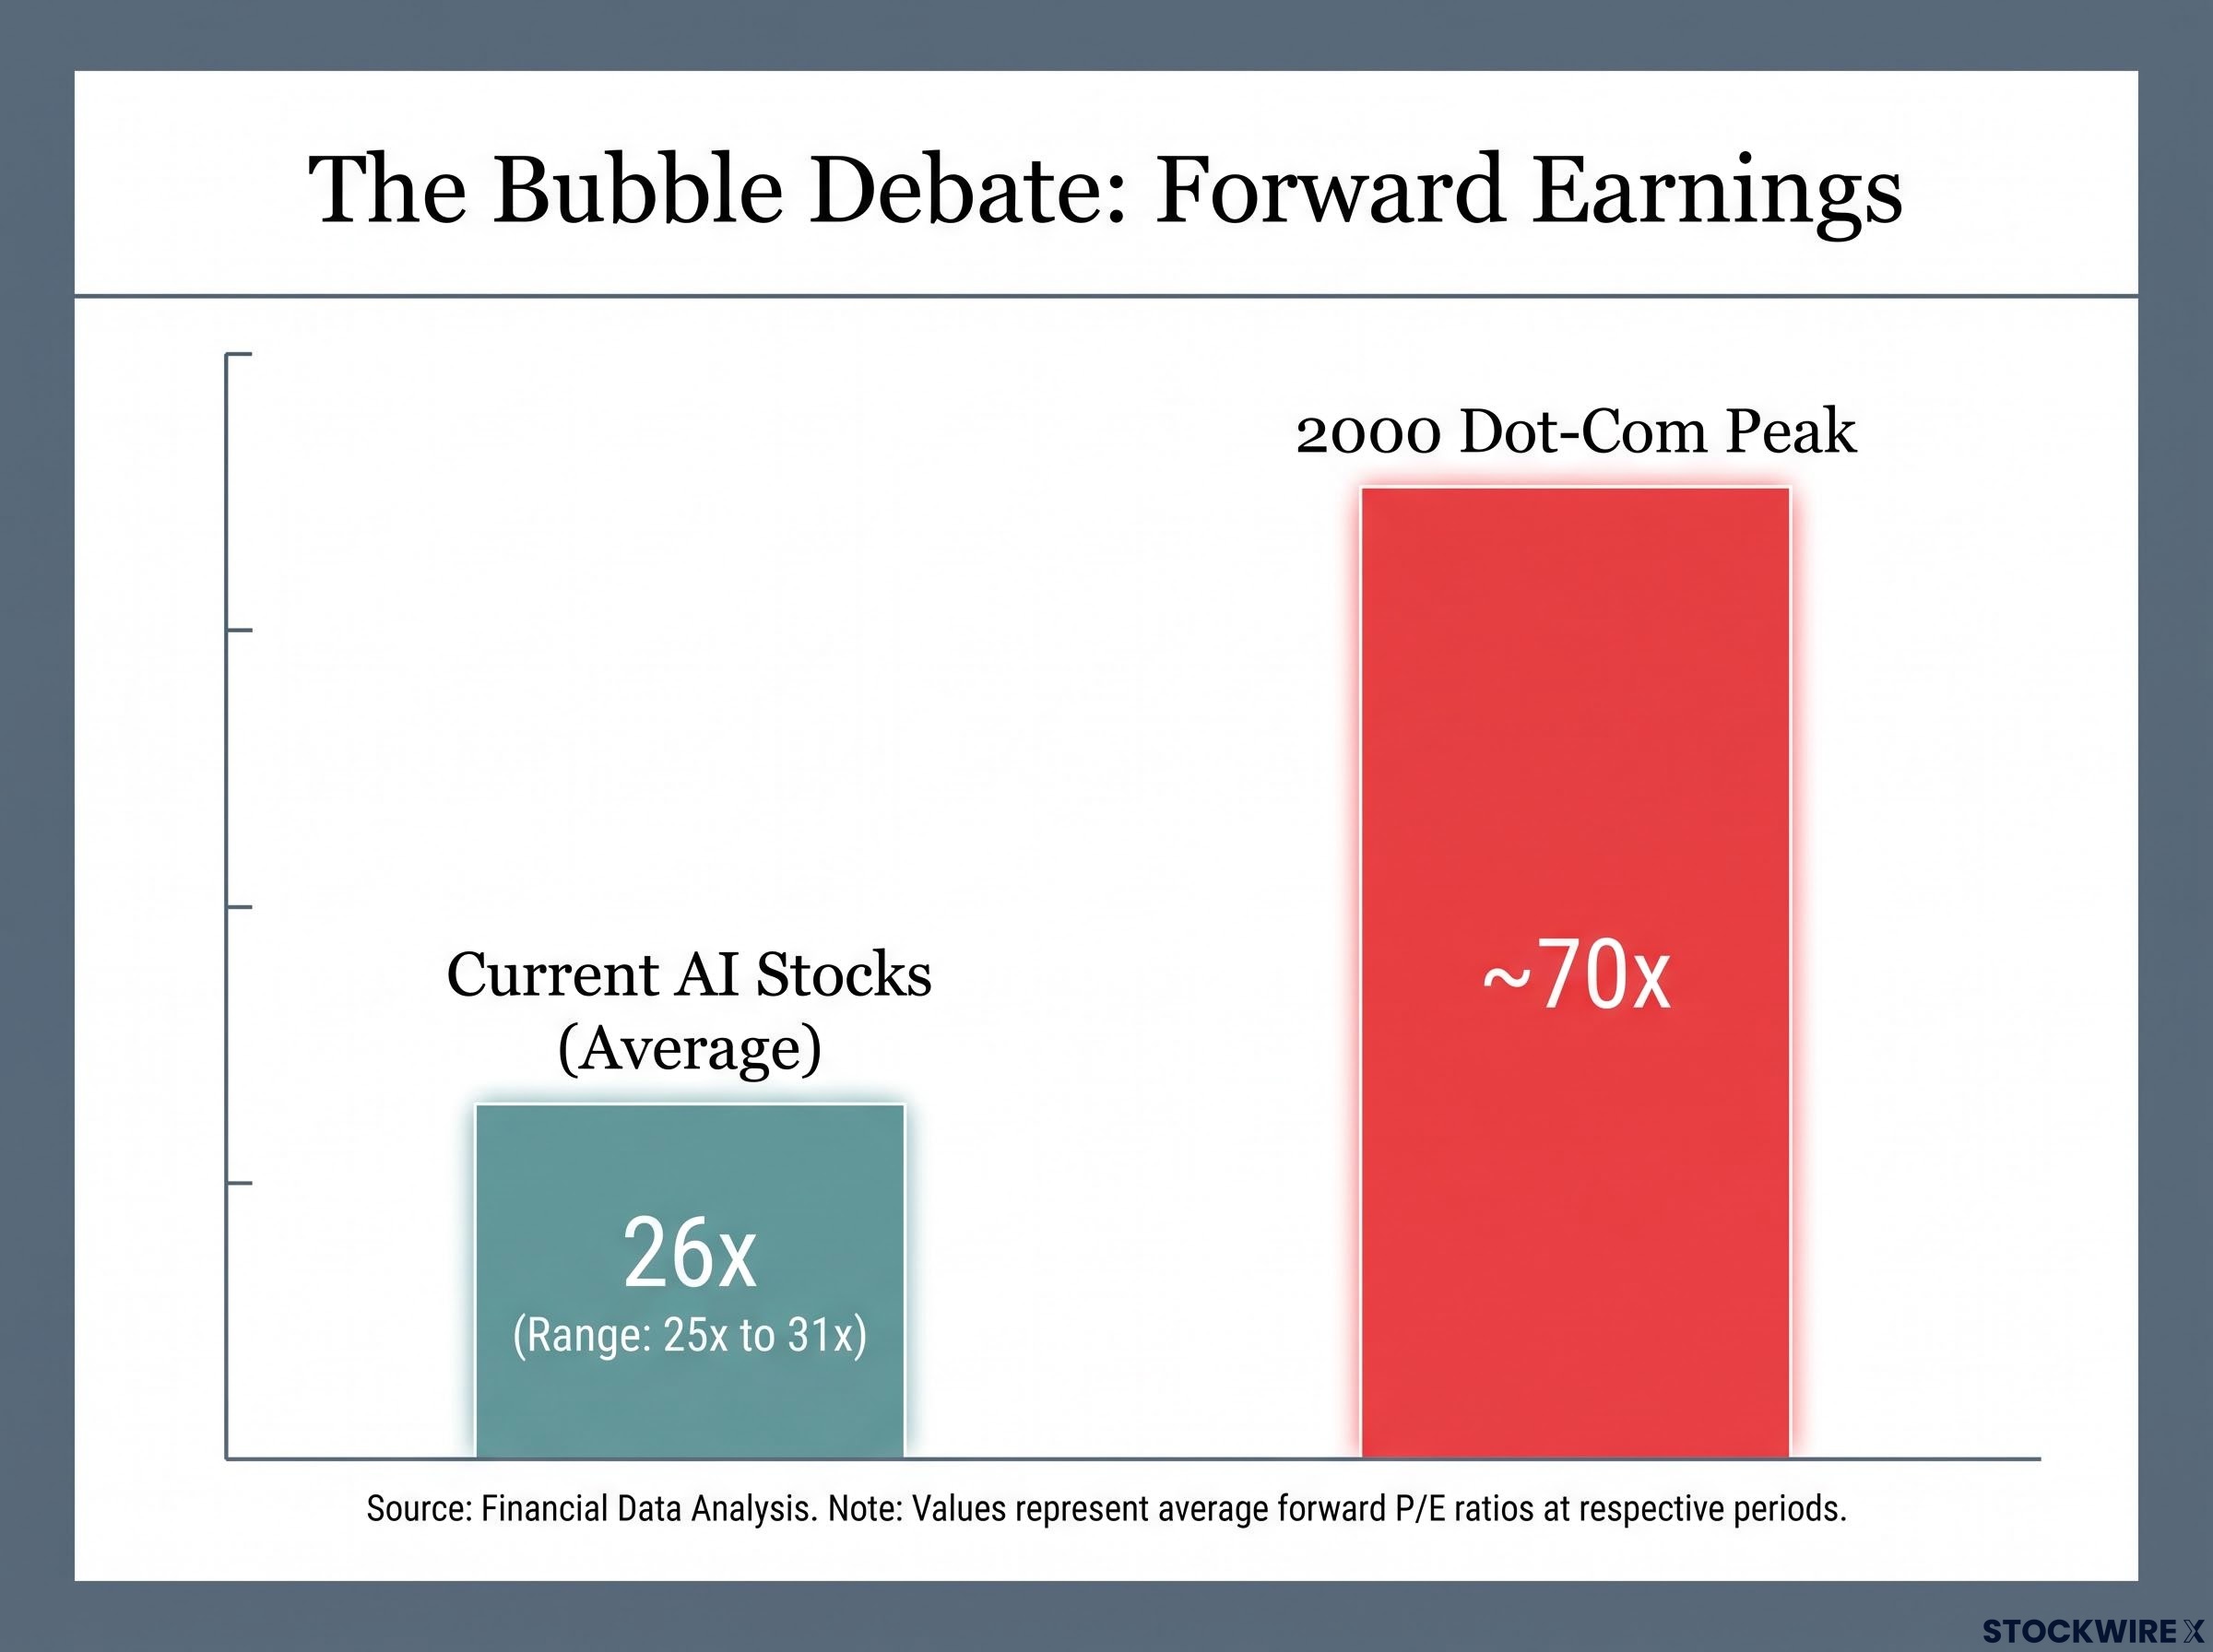
That does not make these stocks cheap or immune to further compression. But it does ground the case in different arithmetic than 2000, and that distinction is what you need to calibrate your own risk.
The iShares analysis comparing AI valuations to the dot-com era argues that today’s AI infrastructure build has been largely funded by profits rather than speculative equity issuance, a structural difference that separates the current cycle from the capital structures that made 2000 so destructive when sentiment reversed.
The bearish counter is technical. At the peak of the 2026 rally, the semiconductor price spread above its 200-day moving average hit roughly 62%, an extreme that has mirrored pre-crash surges in past cycles, from the dot-com era to 19th-century railway booms. Both arguments carry genuine weight, and the disagreement among institutional investors is real.
The semiconductor bubble narrative has attracted serious institutional scrutiny: Bank of America analyst Savita Subramanian published a May 2026 note citing record free cash flow yields, earnings revisions above 20%, and active long-only positioning at roughly half the 2017 cycle peak as evidence that the sector’s fundamentals do not match the conditions historically associated with speculative blow-offs.
Where the AI trade stands entering the final quarter of 2026
Strip away the four phases and one story remains: the rally, the July bear market, the August bounce, and the September reversal all trace back to a single unresolved gap. Between $635-$725 billion in 2026 hyperscaler capex and just $50-$150 billion in current monetisation sits the entire debate.
As of early September 2026, chip stocks remain well below their 22 June all-time highs despite the August partial recovery. This is a second pressure test, distinct from July’s but driven by the same underlying question, and its outcome depends on the four recovery conditions above.
The near-term variables worth watching are concrete:
- The direction of the 10-year Treasury yield, currently at 4.80%
- The tone of Q3 hyperscaler earnings and their AI forward guidance
- Fresh enterprise AI adoption data
- Fed commentary on the rate path and the next inflation print
Having tracked this cycle from April to September, you now have the pattern recognition to read the next earnings season as an informed participant rather than a reactive one. The job is not to call the bottom. It is to watch the right variables.
This article is for informational purposes only and should not be considered financial advice. Investors should conduct their own research and consult with financial professionals before making investment decisions.
Past performance does not guarantee future results. Financial projections are subject to market conditions and various risk factors, and forward-looking statements are speculative and subject to change based on market developments and company performance.