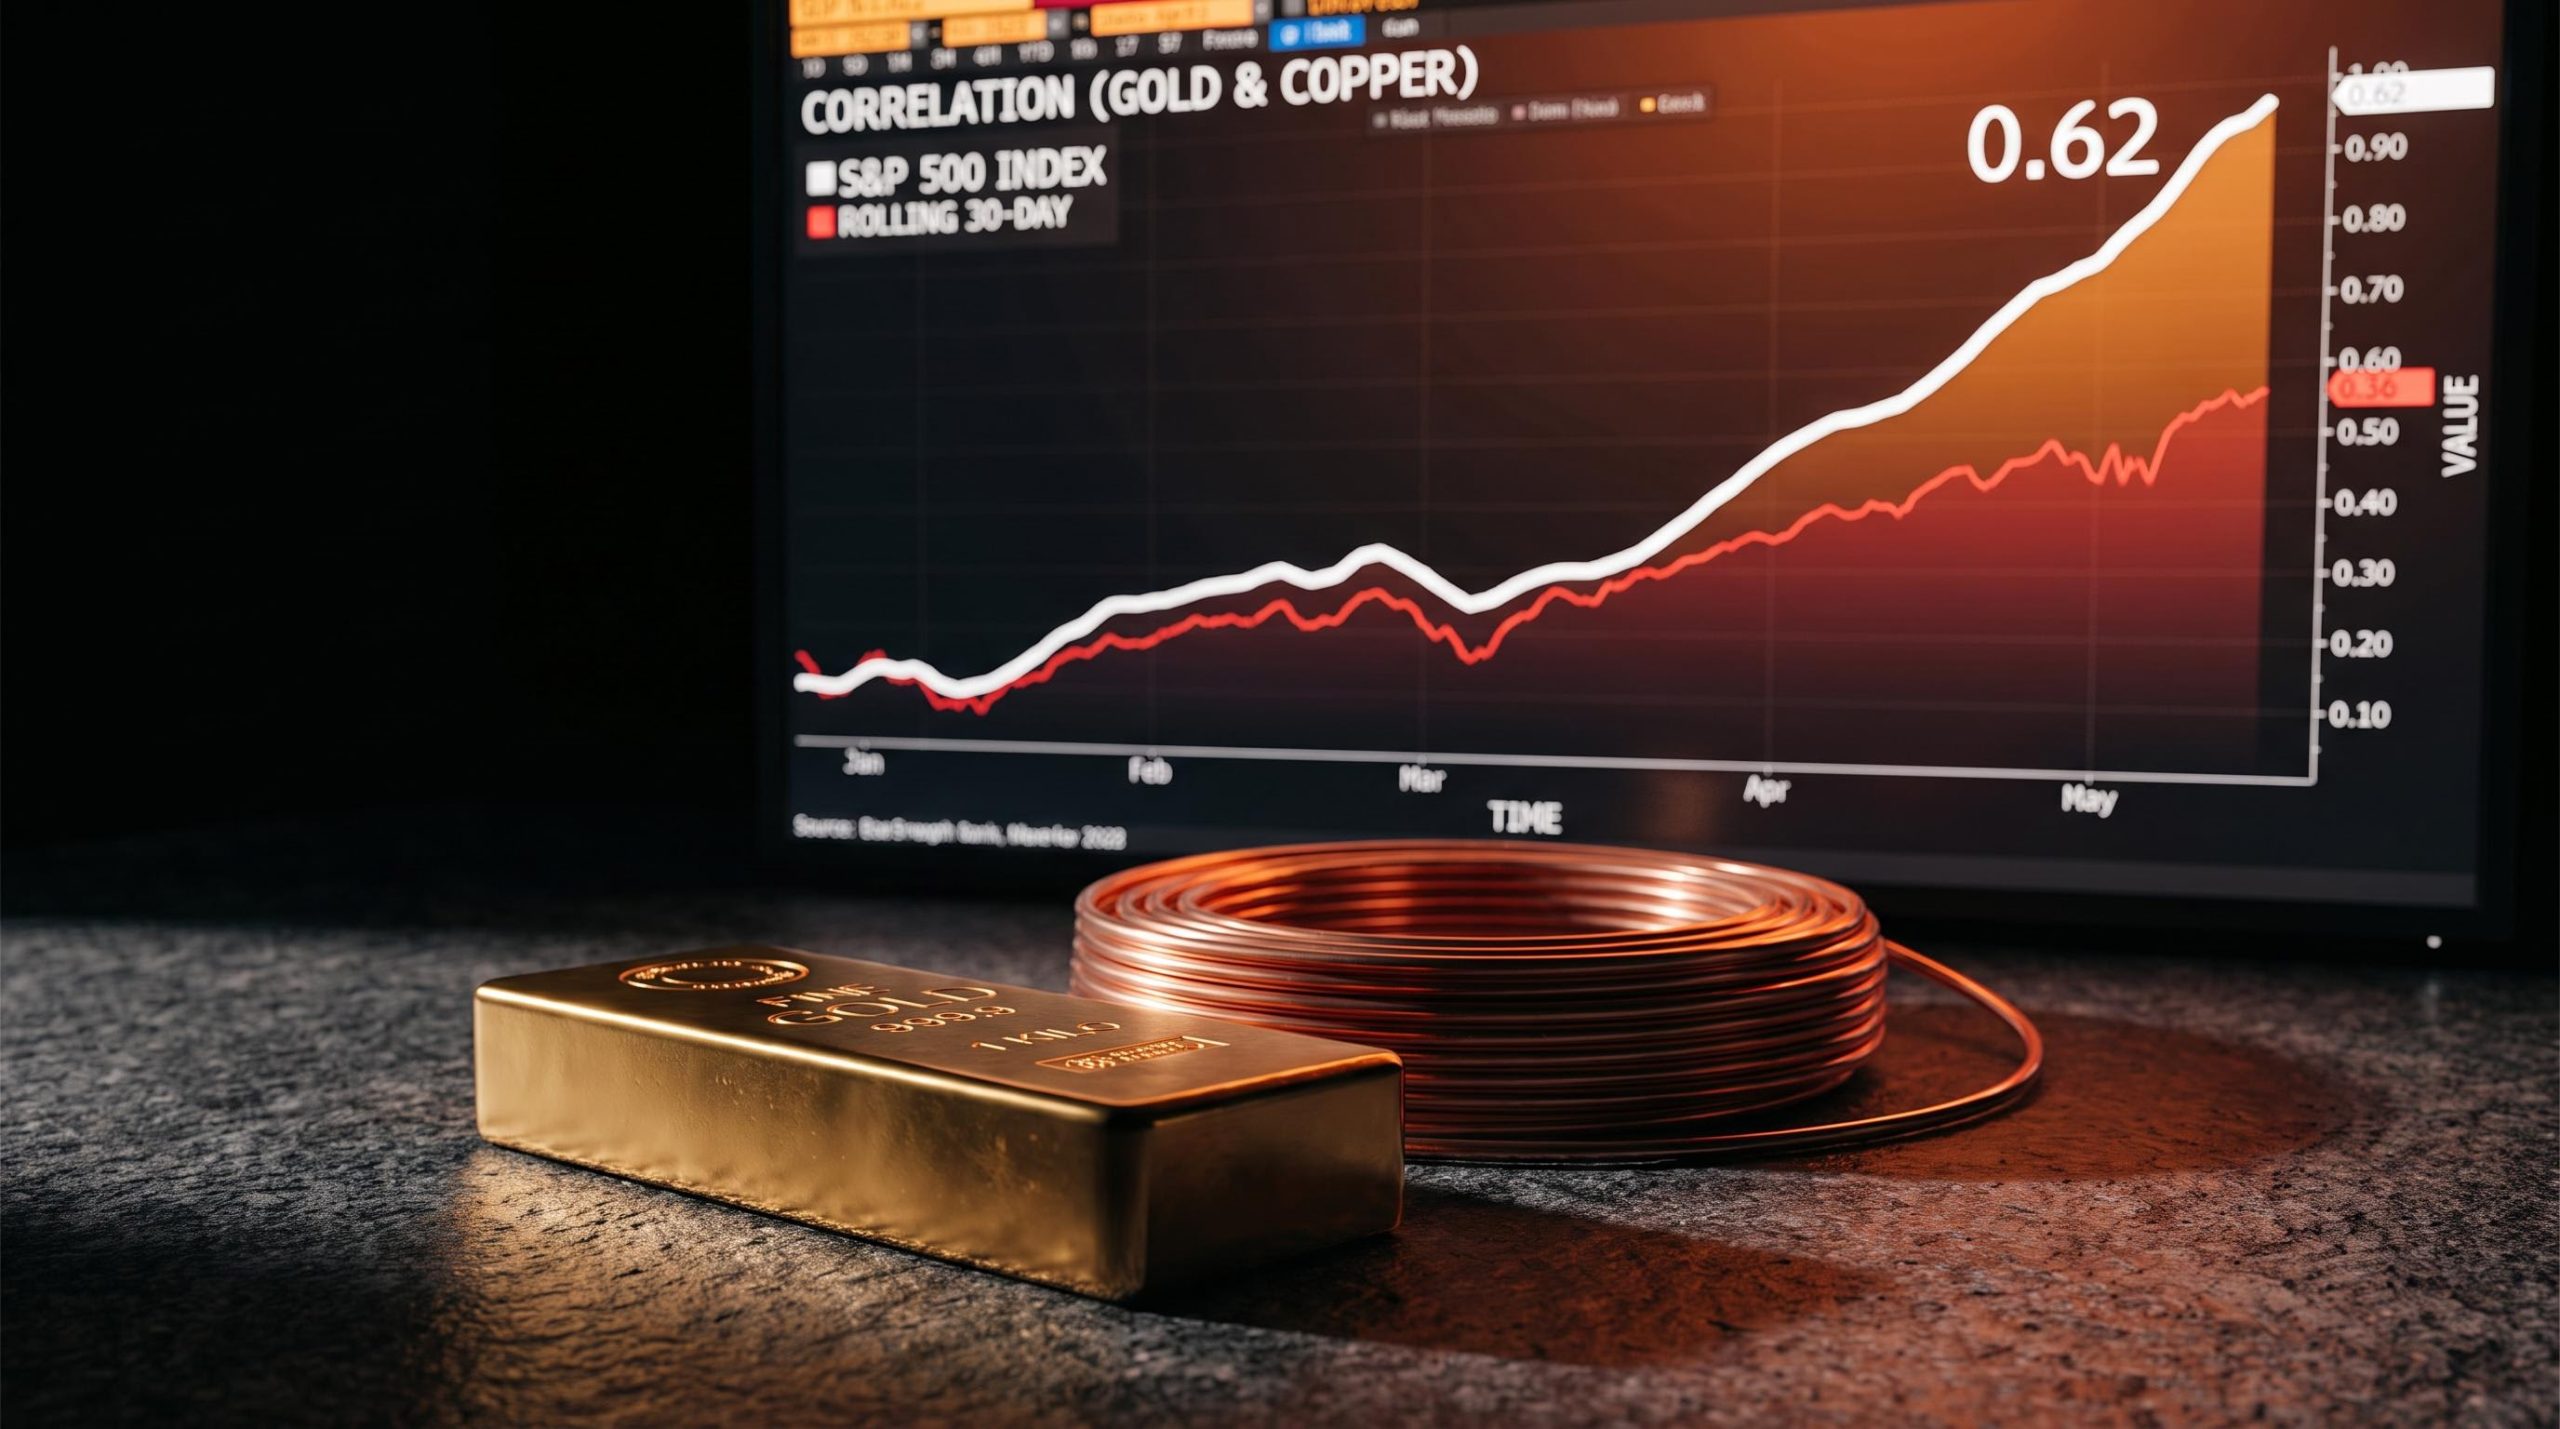
Most portfolios are built on a single quiet assumption: when stocks fall, gold and copper will hold the line. The correlation numbers as of early 2026 say that assumption is broken. Gold’s 100-day correlation with the S&P 500 has reached roughly 0.52, approaching a multi-decade high, while copper’s equivalent measure hit approximately 0.62, the highest since the CME contract launched in 1988.
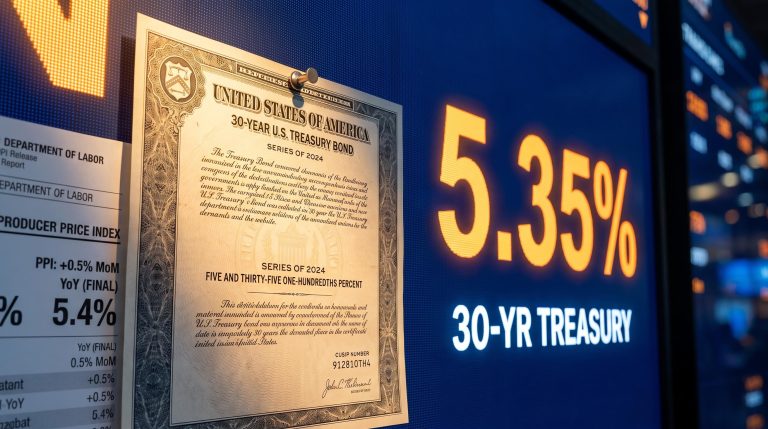
Both metals have climbed alongside equities, and that shared ascent has created the illusion of a diversified, resilient portfolio. The underlying reality is the opposite. Investors have concentrated risk into assets that now move together, not spread it across assets that move apart. With Treasury yields sitting near 5%, the entire safe-haven calculus has quietly shifted, and most retail allocators have not repriced it.
This is a framework for reading that shift. After this, you will know the specific signals that reveal when a supposed hedge has crossed into equity-proxy territory, and what that means for how your capital should be positioned today.
Gold’s safe-haven reputation is running on borrowed time
The pitch for gold has always been simple. It zigs when equities zag, holds value through crises, and anchors a portfolio when everything else is falling. That is the reputation. The current data tells a different story.
Gold’s crisis performance is empirically regime-dependent: the conditional safe haven case holds during financial crises and demand collapses, but fails during acute liquidity squeezes and rising real-yield environments, both of which were simultaneously active in March 2020 and March 2026.
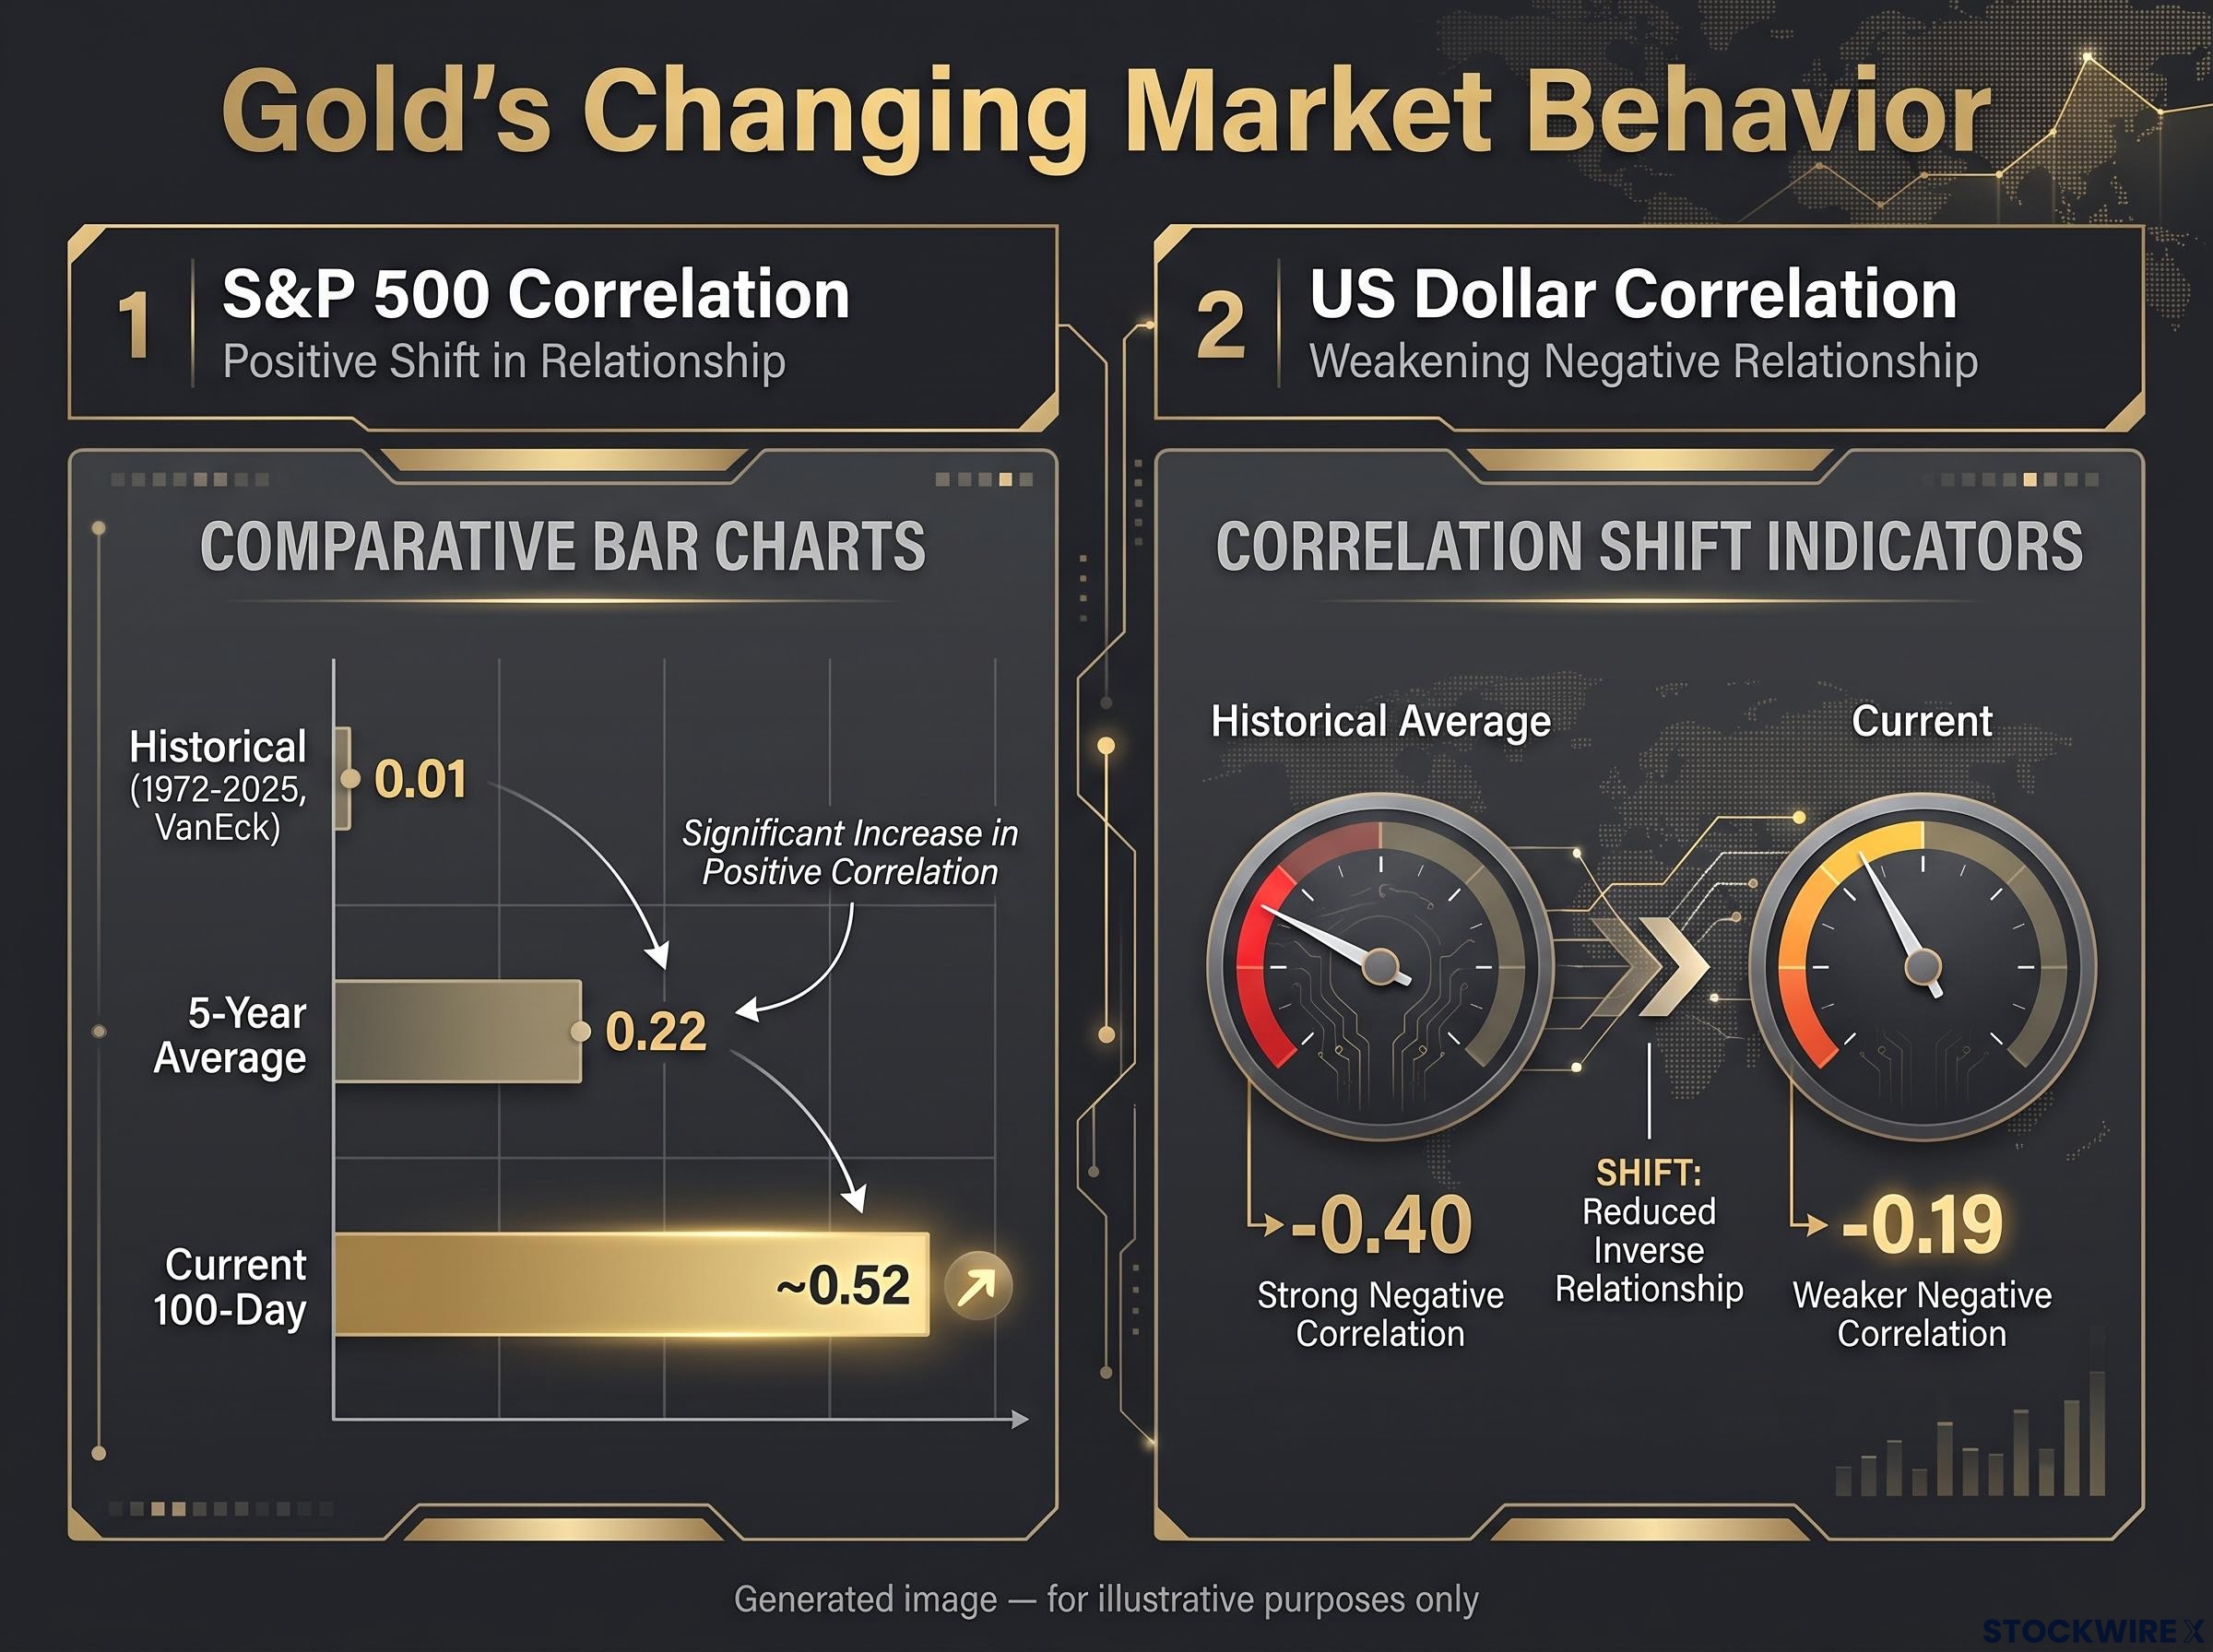
Gold’s five-year average correlation to the S&P 500 sat at 0.22, consistent with an asset that moves largely independent of stocks. Since late February 2026, Reuters reported that figure has climbed to around 0.55, nearly two and a half times its historical baseline. An asset behaving as advertised does not do that.
The relationship that historically powered gold has also weakened. Gold’s negative correlation to the US dollar has softened from a historical average near -0.40 to just -0.19, a point worth isolating in its own right.
When the dollar relationship breaks down
Dollar weakness has long been the primary engine through which gold appreciated: as the dollar falls, dollar-priced gold rises. With that negative correlation cut by more than half, one of gold’s core support mechanisms is now muted, removing a pillar investors have relied on without naming it.
The valuation picture sharpens the concern. Gold is trading at extremes that have historically preceded painful resets.
- Gold sits roughly 60% above its 60-month moving average, the highest such premium on a year-end basis since around 1980, comparable to the 2011 peak.
- It reached its highest valuation relative to US Treasuries in nearly 40 years during Q1 2026.
- Its 100-day correlation with the S&P 500 near 0.52 is approaching a multi-decade high, the correlation extreme that started this analysis.
Mike McGlone, Senior Commodity Strategist at Bloomberg Intelligence, does not soften the assessment.
Gold is behaving as a high-risk, overpriced asset in the current tightening macro environment, according to McGlone, at risk of losing safe-haven status to US bonds through 2026.
What the correlation and valuation data mean together is uncomfortable. An investor adding gold to a stock-heavy portfolio right now is not reducing risk. They are layering on a second equity-like position that pays no income, at a time when government bonds yield near 5%. If a broad sell-off arrives, the protection may fail at exactly the moment it is supposed to work.
When big ASX news breaks, our subscribers know first
What the data has looked like across half a century
Before writing gold off, it helps to understand what correlation actually is. It is not a fixed property of an asset. It is a regime-dependent variable that changes with the market environment, and reading it that way is the difference between a sophisticated allocation call and a rule of thumb that breaks when tested.
Over full cycles, gold has been almost perfectly uncorrelated to US equities. The long-term evidence is consistent across independent sources.
| Source | Time period | Gold-S&P 500 correlation |
|---|---|---|
| VanEck | 1972-2025 | 0.01 |
| State Street | 1970s onward (monthly) | 0.00 |
| Reuters (current) | Since late February 2026 | 0.55 |
| 2025 peak rally window | Brief 30-day sample | +0.82 |
The gap between 0.01 over five decades and 0.55 today is the whole story. Correlation is not stable; it swings with conditions.
Historically, gold’s correlation to stocks tends to rise under specific circumstances:
- During strong equity bull markets driven by liquidity expansion.
- When both assets are traded together inside risk-on and risk-off ETF baskets.
- When macro liquidity, what McGlone describes as the “money pump,” lifts equities and metals at the same time.
The reverse is equally important. During severe equity drawdowns, gold’s correlation falls toward zero or turns negative, which is precisely the regime where its hedging value is supposed to appear. The Bloomberg All Metals Index is currently showing its highest 100-day correlation with the S&P 500 in roughly 30 years of index history, and during one 2025 rally window gold’s correlation briefly spiked to +0.82.
Here is what the regime-dependency insight tells you. The danger is not that gold has permanently changed character. It is that you may be buying it near a liquidity-driven correlation peak, right before the relationship resets through a drawdown you did not price in.
Copper is not a hedge; it is a stock market amplifier
Copper’s correlation with equities is even more extreme than gold’s. Its 100-day correlation with the S&P 500 has reached approximately 0.62, the highest ever recorded for the CME contract since its 1988 inception. A quantitative study published in August 2026 found a Pearson correlation coefficient of about 0.724 between global copper prices and the S&P 500, meaning the two have moved together with striking consistency over long-term monthly data.
Look inside the copper market and the reason becomes visible. This is not physical scarcity driving price. It is positioning.
Copper’s supply and positioning dynamics in 2026 include two simultaneous shocks, a Chilean winter storm that wiped 1.6 million tonnes of annualised production and US Section 232 tariff front-running, which helps explain why COMEX inventories reached record levels driven by geographic redistribution rather than genuine global scarcity.
Copper is an accident in waiting, according to McGlone, behaving as a “stock puppet” with its 100-day correlation to the S&P 500 at roughly 0.62, the highest since the contract began trading in 1988.
The distortion beneath the price
Three internal signals reveal how detached the current copper market has become from fundamentals:
- Inventory pile-up: Tariff-related shifts moved approximately 70% of global copper inventories into CME-type warehouses, the highest proportion ever recorded. CME warehouse stocks surged from 85,000 tons at the start of 2025 to 536,000 tons by February 2026.
- Speculative extremes: Hedge funds built net long positions equal to roughly 20% to 30% of total open interest after copper crossed $5 per pound. By September 2026, CFTC speculative non-commercial net positions stood elevated at +80.9K contracts.
- Leading-indicator sell-off: On 10 September 2026, copper fell roughly 5%, and it sold off before the broader stock market declined, behaving as an early warning rather than a hedge.
Both copper and the S&P 500 are now trading near 40% premiums to their respective 200-week moving averages. Copper runs at two to three times the volatility of the S&P 500 yet has consistently underperformed the index over the prior three to four years. That is a lot of risk for less reward.
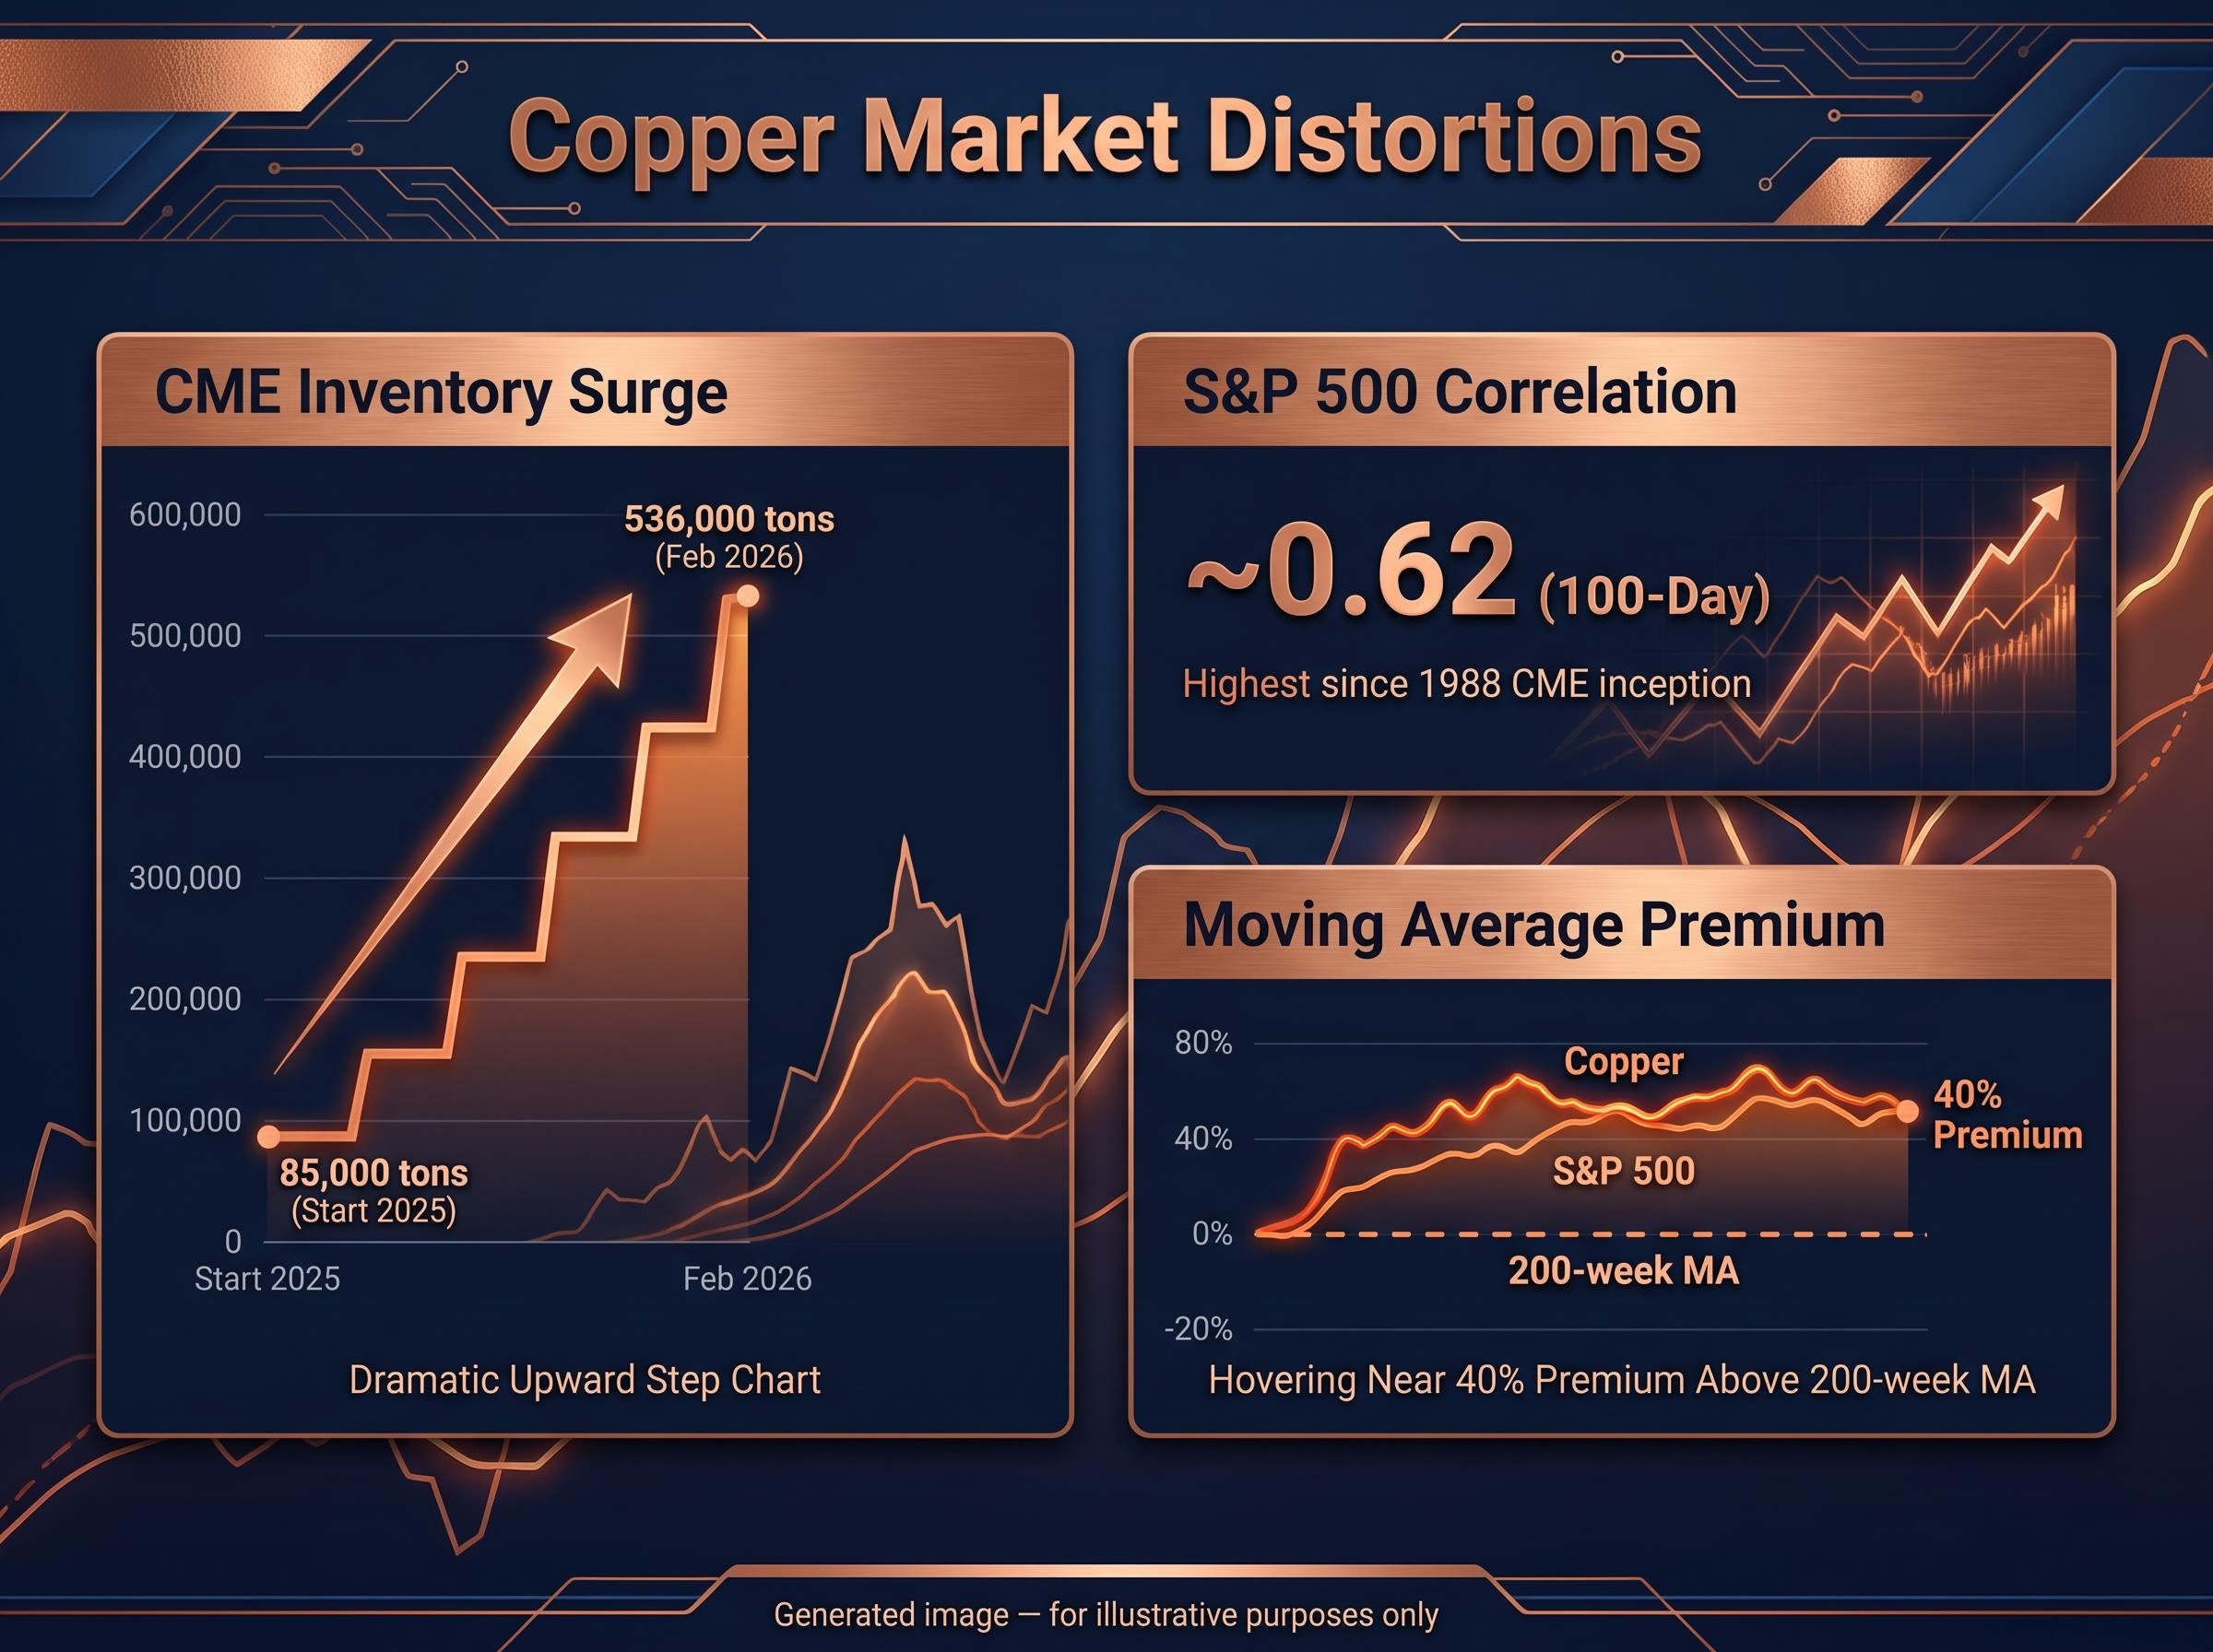
The read here is direct. Record correlation, speculative longs at extremes, and copper leading the equity sell-off on 10 September tell you that a positioning unwind would hit your equity and commodity holdings at the same time, wiping out the diversification you assumed you owned.
The demand story is real, the current price is not
None of this dismisses copper’s structural case. Electrification added nearly 5 million tonnes of demand between 2019 and 2025. Major AI data centres each consume 40,000 to 50,000 tons of copper, and EVs require three to four times more than conventional vehicles.
That demand is genuine, but it operates on a multi-decade horizon. Current speculative pricing operates on a much shorter one. Confusing the two is exactly how investors get caught when the positioning unwinds.
AI-driven copper demand projections through 2040 underpin the structural case for the metal, but near-term speculative pricing has decoupled sharply from those multi-decade fundamentals, creating the gap between the thesis that is real and the entry point that is not.
What replaces metals when the diversification logic breaks down
If gold and copper are trading as equity proxies, the practical question is how you test any asset you hold for diversification, and what actually passes that test today. Start with a three-part screen.
- Correlation regime analysis: Track rolling correlations across different market states, using 52-week and 3-year windows. An asset that stays positively correlated through both rallies and drawdowns is a proxy, not a hedge.
- Crisis stress testing: Judge the asset by how it performed during severe equity drawdowns. If it fell alongside stocks across multiple stress episodes, its hedging value is compromised.
- Valuation comparison: Measure the premium against established hedges. Gold at a near-40-year high versus Treasuries, or copper at a 40% premium to its moving average despite record inventory, signals deteriorating risk-reward.
Run current metals through that screen and the alternatives that pass become clear:
- US Treasuries: Offer a guaranteed return near 5% with a historical negative correlation to equities during risk-off episodes.
- TIPS and cash: Provide real-yield exposure and stability when equities and gold struggle together under rising real yields.
- Diversified commodity baskets: Spread exposure across energy, agriculture, and varied industrial metals rather than concentrating correlation risk in a single asset.
The comparison against Treasuries is where the opportunity cost lands.
Treasury yields as a policy lever have taken on heightened significance in 2026, with the 10-year at 4.66%-4.67% functioning as an active pressure zone that tightens mortgage rates, corporate borrowing costs, and federal debt servicing simultaneously, reinforcing why a 5% yield environment materially changes the calculus for holding zero-income assets as hedges.
| Asset | Current income | 100-day equity correlation | Volatility regime |
|---|---|---|---|
| Gold | None | ~0.52 | ~2x S&P 500; 40-year high vs bonds |
| Copper | None | ~0.62 | 2-3x S&P 500 volatility |
| US Treasuries | ~5% yield | Negative in risk-off | Low, guaranteed return |
Here is what that comparison tells you. With Treasuries paying near 5% and gold producing zero income while trading at a 40-year high in volatility relative to bonds, the cost of holding gold as a hedge is the highest it has been in modern history. The question is not whether gold or copper eventually recovers. It is whether those positions are doing the portfolio job you assigned them right now.
The metals are not broken permanently, but the thesis that justifies holding them right now is
The long-term cases for both metals remain intact. Gold has historically reasserted its macro-hedge role during genuine deflationary crises and periods of real-yield compression. Copper’s electrification and AI demand narrative runs through 2040, with CME Group projecting a 50% rise in demand to 42 million tonnes by then. Neither structural story is in doubt.
What is in doubt is whether now is the moment to own them for protection. For gold, three signals would mark a shift back toward genuine safe-haven behaviour:
- A break toward the $3,000 downside target McGlone cited before gold could sustain levels above $5,000 longer-term.
- A re-compression of equity correlations back toward their historical averages.
- A meaningful reduction in speculative positioning.
For context on what a genuinely attractive entry looks like, McGlone pointed to gold near $1,600 in Q4 2022, when it sat right on its 60-month moving average. That is the kind of setup, not the current 60% premium above it, that historically rewards buyers.
The most important structural finding sits underneath all of this. Granger-causality tests show neither copper nor equities drives the other; both respond to the same macro forces of growth and liquidity. Correlation will therefore stay elevated for as long as the current monetary environment persists, and that is the fact to anchor your expectations to.
The current period represents the longest stretch in recorded data where gold has outperformed S&P 500 total returns, a signal that historically points toward mean reversion.
The real risk is not that gold and copper fall. It is that they fall at the same time and for the same reasons as your equities, the one scenario a hedge exists to prevent.
The stock-bond correlation breakdown in 2022, 2025, and May 2026 mirrors the metals-equity correlation problem this article addresses: when assets that are supposed to diversify a portfolio start moving together, the diversification benefit assumed by standard allocation models evaporates at exactly the moment it is needed.
This article is for informational purposes only and should not be considered financial advice. Investors should conduct their own research and consult with financial professionals before making investment decisions. Past performance does not guarantee future results, and financial projections are subject to market conditions and various risk factors.