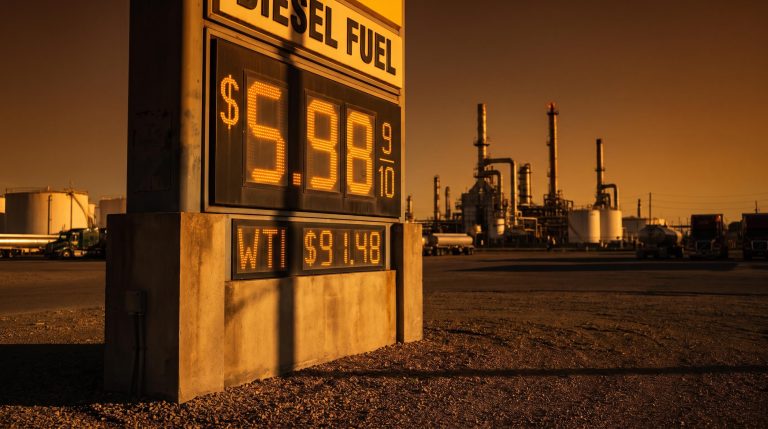
Copper just broke its own all-time high, settling above USD 14,700 per ton on 8 September 2026, and the reasons behind that number are more tangled than any single headline can hold.
Two forces converged almost at once. A US tariff regime sent importers racing to stockpile metal ahead of rising costs, while a winter storm in Chile knocked out roughly 1.6 million tonnes of annualised production capacity across 16 operations in a single week. Neither event alone would have moved the market this dramatically.
Together, they struck a market already under structural pressure from electrification demand, and prices responded accordingly. The analysis below separates the cyclical noise from the structural signal, so anyone tracking copper-exposed equities, commodity positions, or downstream cost exposure can see which of these price drivers is likely to persist and which is already priced in.
How US tariff policy turned copper into a hoarding trade
The current price does not describe a shortage in the traditional sense. It describes a redistribution of physical metal, and that redistribution began with a rational response to policy.
Under presidential proclamations modifying the Section 232 “national security” tariffs, effective 6 April 2026 and further clarified on 2 June 2026, US import duties now apply to the full customs value of covered copper articles. The rate schedule is tiered:
The Section 232 copper tariff rate schedule introduced under Proclamation 11021 applies the full customs value basis across tiered rates, a structure that created an unusually clear and calculable incentive for importers to front-run delivery timelines before costs became unavoidable.
- 50% ad valorem on core copper articles (Annex I-A)
- 25% on specified derivative copper products (Annex I-B)
- 10-15% in limited cases for certain UK-origin or high US-content products
Once those rates landed, the logic for importers was straightforward. Buy the metal, land it in a US warehouse, and beat the full weight of the tariff regime before it became unavoidable. That front-running pulled metal across the Atlantic, draining London Metal Exchange (LME) warehouses in the process and tightening every market outside the United States as a side effect.
A layer of compliance uncertainty followed. On 30 July 2026, US Customs and Border Protection (CBP) introduced a rule requiring importers to report country-of-smelt and country-of-cast data for certain copper wire. It added paperwork rather than cost, but uncertainty of any kind tends to push cautious buyers to act sooner.
The physical evidence of all this sits in COMEX inventory data. In late August 2026, stocks rose for 46 consecutive days, crossing a record 675,185 metric tons, and the build continued into September.
COMEX at the ceiling As of 8 September 2026, total COMEX copper stocks reached 767.5 thousand short tons, sitting at the 100th percentile of the 8-month record. Registered, deliverable inventory alone stood at 477.7 thousand short tons, or 62.2% of all COMEX copper in approved vaults.
| Date | Inventory level (thousand short tons) | Context |
|---|---|---|
| Late August 2026 | ~675 (metric tons) | 46-day consecutive build peak |
| 8 September 2026 | 767.5 total | 100th percentile, 8-month record |
| 8 September 2026 | 477.7 registered | 62.2% of approved-vault copper |
Here is what that scale tells you. Global exchange inventories have risen by roughly 300,000 tonnes since January 2026, and the bulk of that has landed in one country because of one policy. That is a geographic relocation, not a genuine physical scarcity, and it separates price strength built on real tightness from price strength built on stockpiling. The two unwind very differently if the policy environment shifts.
Tariff-driven inventory redistribution created a price signal that looks like a shortage from the outside but resolves very differently when the policy environment shifts; Chile’s El Teniente collapse earlier in 2026 and the subsequent nationwide power outage added genuine multi-year supply damage on top of the stockpiling premium, layering two structurally distinct problems into a single price number.
When big ASX news breaks, our subscribers know first
Chile’s winter storm and what a single week of bad weather revealed about supply fragility
The tariff story built inventory. The Chilean story removed it, and it did so almost overnight.
Between 15-21 July 2026, a severe winter storm and atmospheric river event brought heavy snow, rainfall, and high winds to central and north-central Chile. The weather struck 16 copper operations and curtailed about 1.6 million tonnes of annualised production capacity in a single week. The producers affected read as a roll call of the industry’s largest names:
- Codelco (state-owned, the world’s largest copper producer)
- Anglo American
- Antofagasta
- Lundin Mining (Caserones)
- BHP (Escondida, the world’s largest copper mine)
Escondida’s involvement matters disproportionately. When the single largest mine on the planet curtails output, the market feels it in a way no smaller operation could replicate.
Codelco’s production constraints have compounded the Chilean story over a longer arc; the state-owned producer recorded its fourth-lowest monthly output on record in March 2026, meaning the winter storm curtailments landed on a supply base already running below historical norms.

The export data made the damage tangible. According to Chile central bank figures, the country’s August 2026 copper export value fell to roughly USD 4.62 billion, a 14% month-over-month decrease and a 3.2% year-over-year decline.
A volume collapse the price could not mask Chile’s August export value fell 14% month-over-month even though the average global copper price that month ran more than 40% higher than the corresponding prior-year level. When a country responsible for roughly a quarter of global mine output loses that much export value into a rising price, the volume loss was severe enough to overwhelm the tailwind.
Chile accounts for approximately 25% of total global mine supply. A disruption of this magnitude, concentrated into one week, tells you the supply chain connecting Andean mines to global markets carries meaningful single-point vulnerabilities.
For anyone holding copper mining equities weighted toward Chilean operations, the read is direct. High-altitude Andean assets carry operational weather risk that rarely appears in standard financial models, and Chilean export figures are worth treating as a monthly leading indicator rather than an annual footnote.
Port disruptions compounded the mine curtailments
The mines were only half the problem. Rough maritime conditions at Chilean ports restricted vessel movements at the same time, creating logistics bottlenecks entirely separate from the mine-level curtailments.
Those port delays held up concentrate and cathode shipments, which meant the disruption arrived in two stages rather than one: metal that could not be produced, followed by metal that could not be shipped. That two-stage failure is part of why the export value fell as sharply as it did.
Structural demand versus cyclical overshoot: where analysts actually disagree
Strip away the tariff flows and the Chilean storm, and a genuine disagreement remains about whether USD 14,000-plus copper is justified at all. This is not a settled question. It is a live split between credible institutions with real numbers on both sides.
On one side sits the structural tightness case. The International Energy Agency (IEA), alongside DWS and several major miners, argues that electrification, electric vehicles, renewables, grid infrastructure, and AI data centre buildout are creating sustained demand growth that existing supply pipelines cannot match. New large mines are difficult and slow to bring online, and concentrate supply is chronically tight. In that reading, today’s high prices are an early signal of a longer-term supercycle, amplified by lower interest rates, a softer US dollar, and speculative capital.
On the other side sits the cyclical overshoot case, and it comes armed with revised forecasts.
The forecast that flipped The International Copper Study Group (ICSG) revised its 2026 outlook from a 150,000-tonne deficit to a refined copper surplus of about 96,000 tonnes, and it projects a larger 377,000-tonne surplus in 2027 as demand growth slows and secondary scrap production rises. That is a swing from shortage to glut in a single revision.
Goldman Sachs sits in the same camp, forecasting a global surplus of roughly 300,000 tonnes in 2026 and expecting LME copper to settle in a USD 10,000-11,000 per ton range as high prices curb demand.
| Institution | 2026 balance view | Price expectation | Key risk to thesis |
|---|---|---|---|
| IEA / DWS / miners | Structural tightness | Supercycle, higher for longer | Near-term surplus data |
| ICSG | 96,000-tonne surplus | Softening, 377k surplus by 2027 | Faster electrification demand |
| Goldman Sachs | ~300,000-tonne surplus | USD 10,000-11,000 | Supply shocks persisting |
| ING / Saxo Bank | Tariff-driven distortion | Unwind risk if tariffs narrow | Structural demand floor holding |
The scepticism is loudest where it counts. Chinese traders have held net short positions on the Shanghai Futures Exchange, and Chinese spot premiums temporarily flipped to discounts, which is the world’s largest copper consumer signalling that it does not view current levels as sustainable.
Here is the number that should anchor your view before adding exposure at these levels. LME 3-month copper settled at USD 14,705 per ton on 8 September 2026 and USD 14,632 the following day. Goldman’s target sits at USD 10,000-11,000. That is not a rounding error; it is a 30-40% valuation gap, and knowing which analytical camp a given piece of commentary belongs to tells you far more than any single price target.
What record copper prices are doing to downstream industries and commodity investors
A price record is never neutral. Somebody is booking the free cash flow, and somebody else is absorbing the cost, and the gap between those two groups is widening in real time.
The winners are visible first. Record prices near and above USD 13,000-14,000 per ton have generated historic free cash flow and operating leverage for low-cost producers, which has flowed straight into copper-linked funds.
| Fund | Ticker | 30-day gain | Focus |
|---|---|---|---|
| Global X Copper Miners ETF | COPX | ~15-18% | Miners |
| United States Copper Index Fund | CPER | ~15-18% | Futures index |
| Sprott Copper Miners | COPP | ~15-18% | Miners |
| Sprott Junior Copper Miners | COPJ | ~15-18% | Junior miners |
| HANetf Copper Miners ETF | CPPR | ~15-18% | Miners |
Now the cost side, ordered from most immediate transmission to most deferred:
- Electric vehicles. An EV can contain up to 80 kg of copper. As prices move from USD 10,000 to USD 15,000 per ton, the raw copper cost per vehicle rises from roughly USD 800 to USD 1,200, and that lands on the sticker fast.
- Renewables and grids. A single 1-GW offshore wind farm requires upwards of 3,000 tonnes of copper, so project economics turn acutely sensitive at sustained USD 14,000-plus pricing, raising the risk of deferrals and redesigns.
- Mining equities. The leveraged funds above have delivered strong short-term gains, but that leverage cuts both ways, exposing them to outsized drawdowns relative to the spot move if prices correct.
The consumer-facing pinch Manufacturers including Tesla and Rivian have reportedly raised sticker prices on long-range models by an estimated USD 1,500-2,000 to offset rising copper and rare-earth input costs, a move that pressures mass-market EV adoption directly.

There is a self-correcting mechanism buried in this. Prolonged prices well above fundamental value invite substitution toward aluminium and the deferral of infrastructure projects, which is precisely the demand destruction the cyclical camp expects. Whether you sit on the beneficiary side or the cost-absorption side of this ledger, the transmission mechanism is what you should be tracking, not the spot price in isolation.
What happens next depends on which force retreats first
Four forces built this record, and the price holds, extends, or reverses depending on which one gives way first. You do not need to call the top to position sensibly. You need to know which variable to watch, and in what order.
- Tariff policy. This is the highest-impact near-term binary. Analysts at ING and Saxo Bank caution that much of the rally is tariff-driven, and if implementations prove narrower than expected or refined copper wins exemptions, the front-running flows reverse. Liquidating 767.5 thousand short tons of COMEX inventory would be a serious price headwind.
- Chilean supply recovery. As winter conditions ease and Escondida and the other disrupted mines normalise, one of the two acute upward pressures fades. This resolves on a timeline of weeks.
Longer-range structural variables that set the floor
- Structural demand. The IEA and DWS case for electrification, EVs, grids, and AI data centres does not depend on this quarter. If those timelines accelerate as projected, the structural price floor rises over a multi-year horizon regardless of near-term corrections.
- Speculative positioning. LME speculative length has amplified the move, and any catalyst that triggers an unwind could produce price swings disproportionate to the physical market. Chinese spot premiums slipping to discounts is an early demand-destruction signal from the largest consumer already pulling back.
The sequencing itself is the takeaway. Goldman’s USD 10,000-11,000 target implies a potential 25-30% correction, and the ICSG expects a 377,000-tonne surplus by 2027, but the variable most likely to resolve in either direction on a timeline of weeks is tariff policy. Watch that first.
Investors exploring the multi-year structural thesis in more depth will find our deep-dive into copper and battery metals as long-cycle infrastructure bets, which covers the demand growth projections through 2040, the ore grade deterioration trend since 1991, and why resource equities trade at a valuation discount relative to the technology sector despite similar demand drivers.
This article is for informational purposes only and should not be considered financial advice. Investors should conduct their own research and consult with financial professionals before making investment decisions.
Past performance does not guarantee future results. Financial projections are subject to market conditions and various risk factors, and forward-looking statements are speculative and subject to change based on market developments.