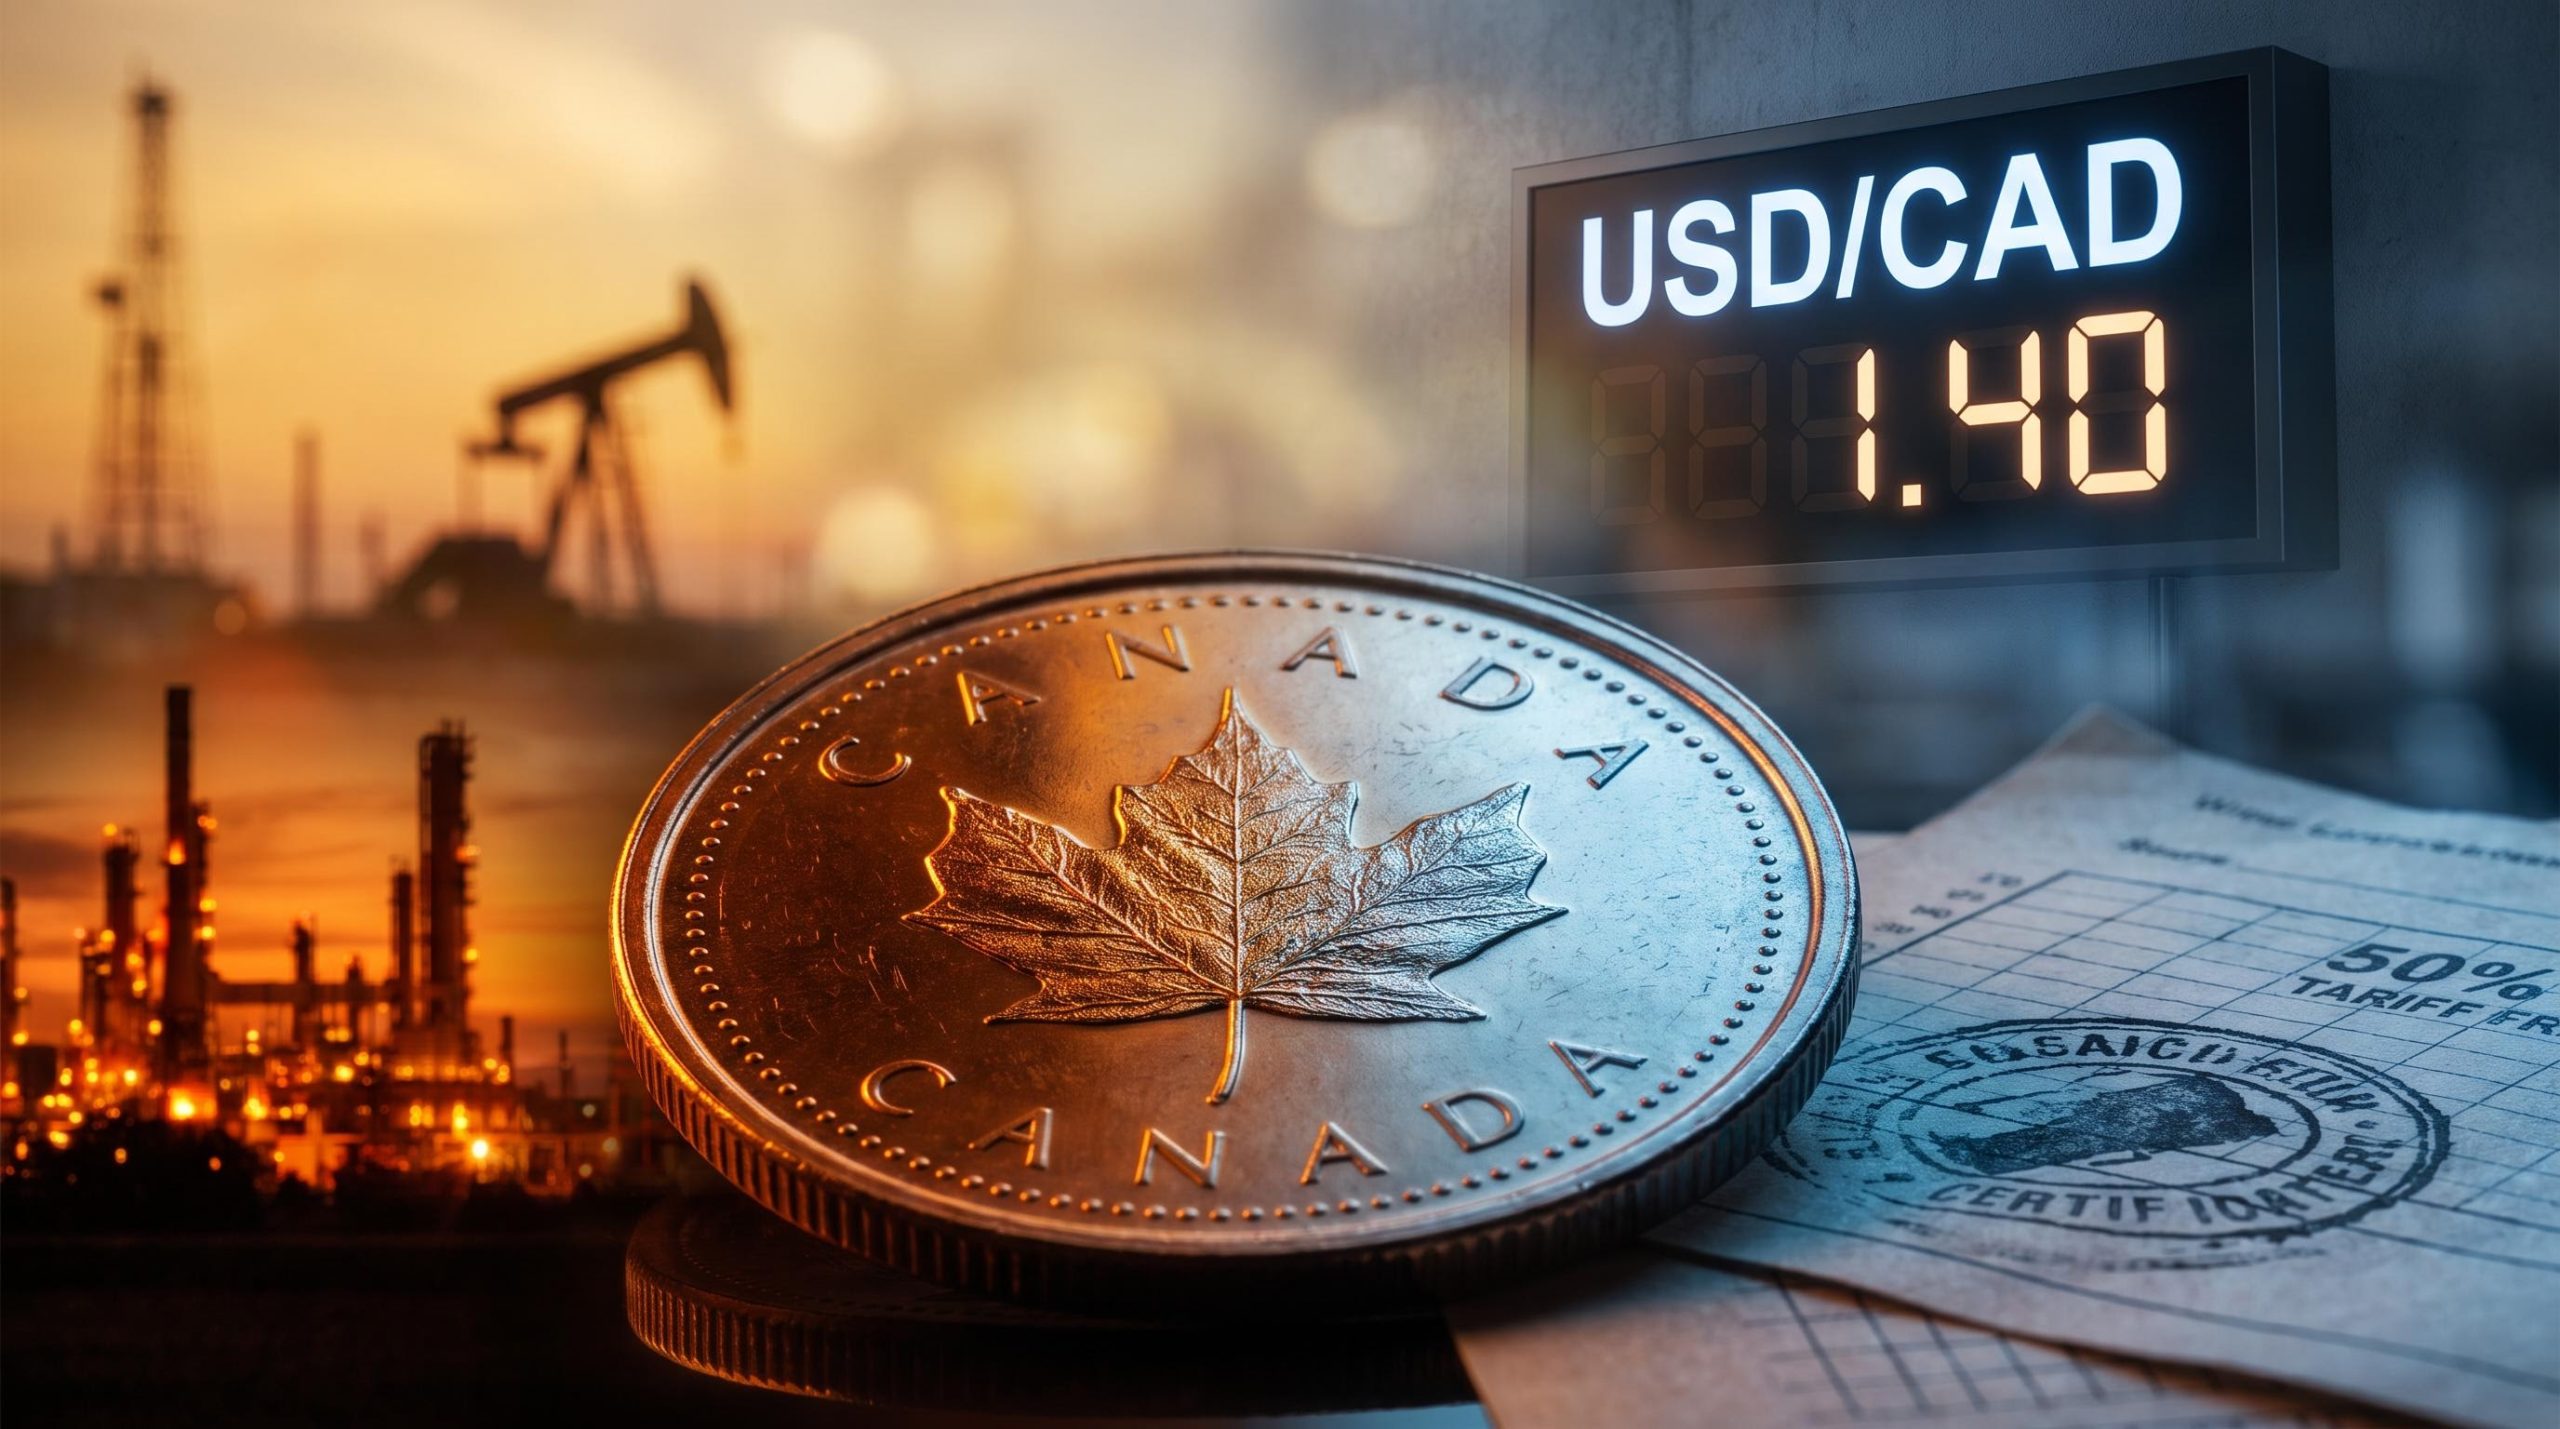
The Canadian dollar just posted one of its strongest quarterly runs in years, and National Bank of Canada is now pointing toward it giving much of that back. The bank projects USD/CAD retracing toward 1.40, and it is doing so in the same week that crude oil delivered its sharpest weekly gain since mid-July.
That is the tension worth sitting with. Two large macro forces are pulling the currency in opposite directions at once, and the outcome will be decided not by which force is bigger today, but by which one proves more durable over the coming weeks.
Here is what each force actually means for where CAD goes next, and the single variable most likely to settle the outcome. Treat it as a live case study in how a commodity-linked currency responds when a trade policy shock and an energy shock hit through entirely separate channels.
What a near-10% oil surge actually does for the Canadian dollar
Canada is one of the world’s largest crude exporters, and that single fact is why its currency behaves differently from a pure manufacturing economy’s. When oil moves, the loonie tends to move with it.
The mechanism runs through terms of trade, which is the ratio of what a country earns on its exports versus what it pays on its imports. Higher crude improves that ratio in Canada’s favour, and the effect shows up across three distinct channels.
The CAD-oil correlation has weakened materially over the past decade, collapsing from 0.88 before 2018 to near zero by 2025-2026, which is precisely why a near-10% WTI surge translates into a more muted loonie response than the commodity-currency framework would predict.
- Export revenues rise as the same barrels sell for more, strengthening the current account.
- Provincial fiscal balances in energy-producing regions improve, since royalty and tax revenue tracks the oil price.
- Portfolio flows rotate into Canadian energy assets, and those inflows require buying CAD.
That transmission was working hard last week. WTI crude settled at US$91.48 per barrel on 4 September 2026, up roughly 9.7% from the US$83.40 close the prior Friday, a gain corroborated across four independent reports. Brent rose about 7.6% over the same stretch. Some coverage cited WTI trading nearer US$97.20 intraday, but the settlement figure is the cleaner reference point.
WTI posted its strongest weekly gain since mid-July, rising approximately 9.7% to settle at US$91.48 per barrel.
Critically, Canadian energy exports remain explicitly exempt from tariffs on both sides of the border. That means the terms-of-trade channel from crude is not being eroded by the trade dispute at all. The oil tailwind and the trade headwind are, quite literally, operating on separate tracks.
When the commodity-currency link weakens
Here is the caveat that decides how much weight to give the rally. The source of an oil price rise matters as much as its size.
When crude climbs on genuine demand growth, the currency support tends to be sturdy, because the underlying economic story is intact. When it climbs on a supply-disruption premium, the support is borrowed. The moment the disruption resolves, the premium unwinds, and the currency lift disappears with it.
For anyone building a CAD view, that distinction is the whole game. An oil-driven tailwind resting on a supply scare is structurally less reliable than one resting on demand, because it can evaporate precisely when the trade-war headwinds are still fully in force.
When big ASX news breaks, our subscribers know first
The Strait of Hormuz premium: durable support or borrowed time?
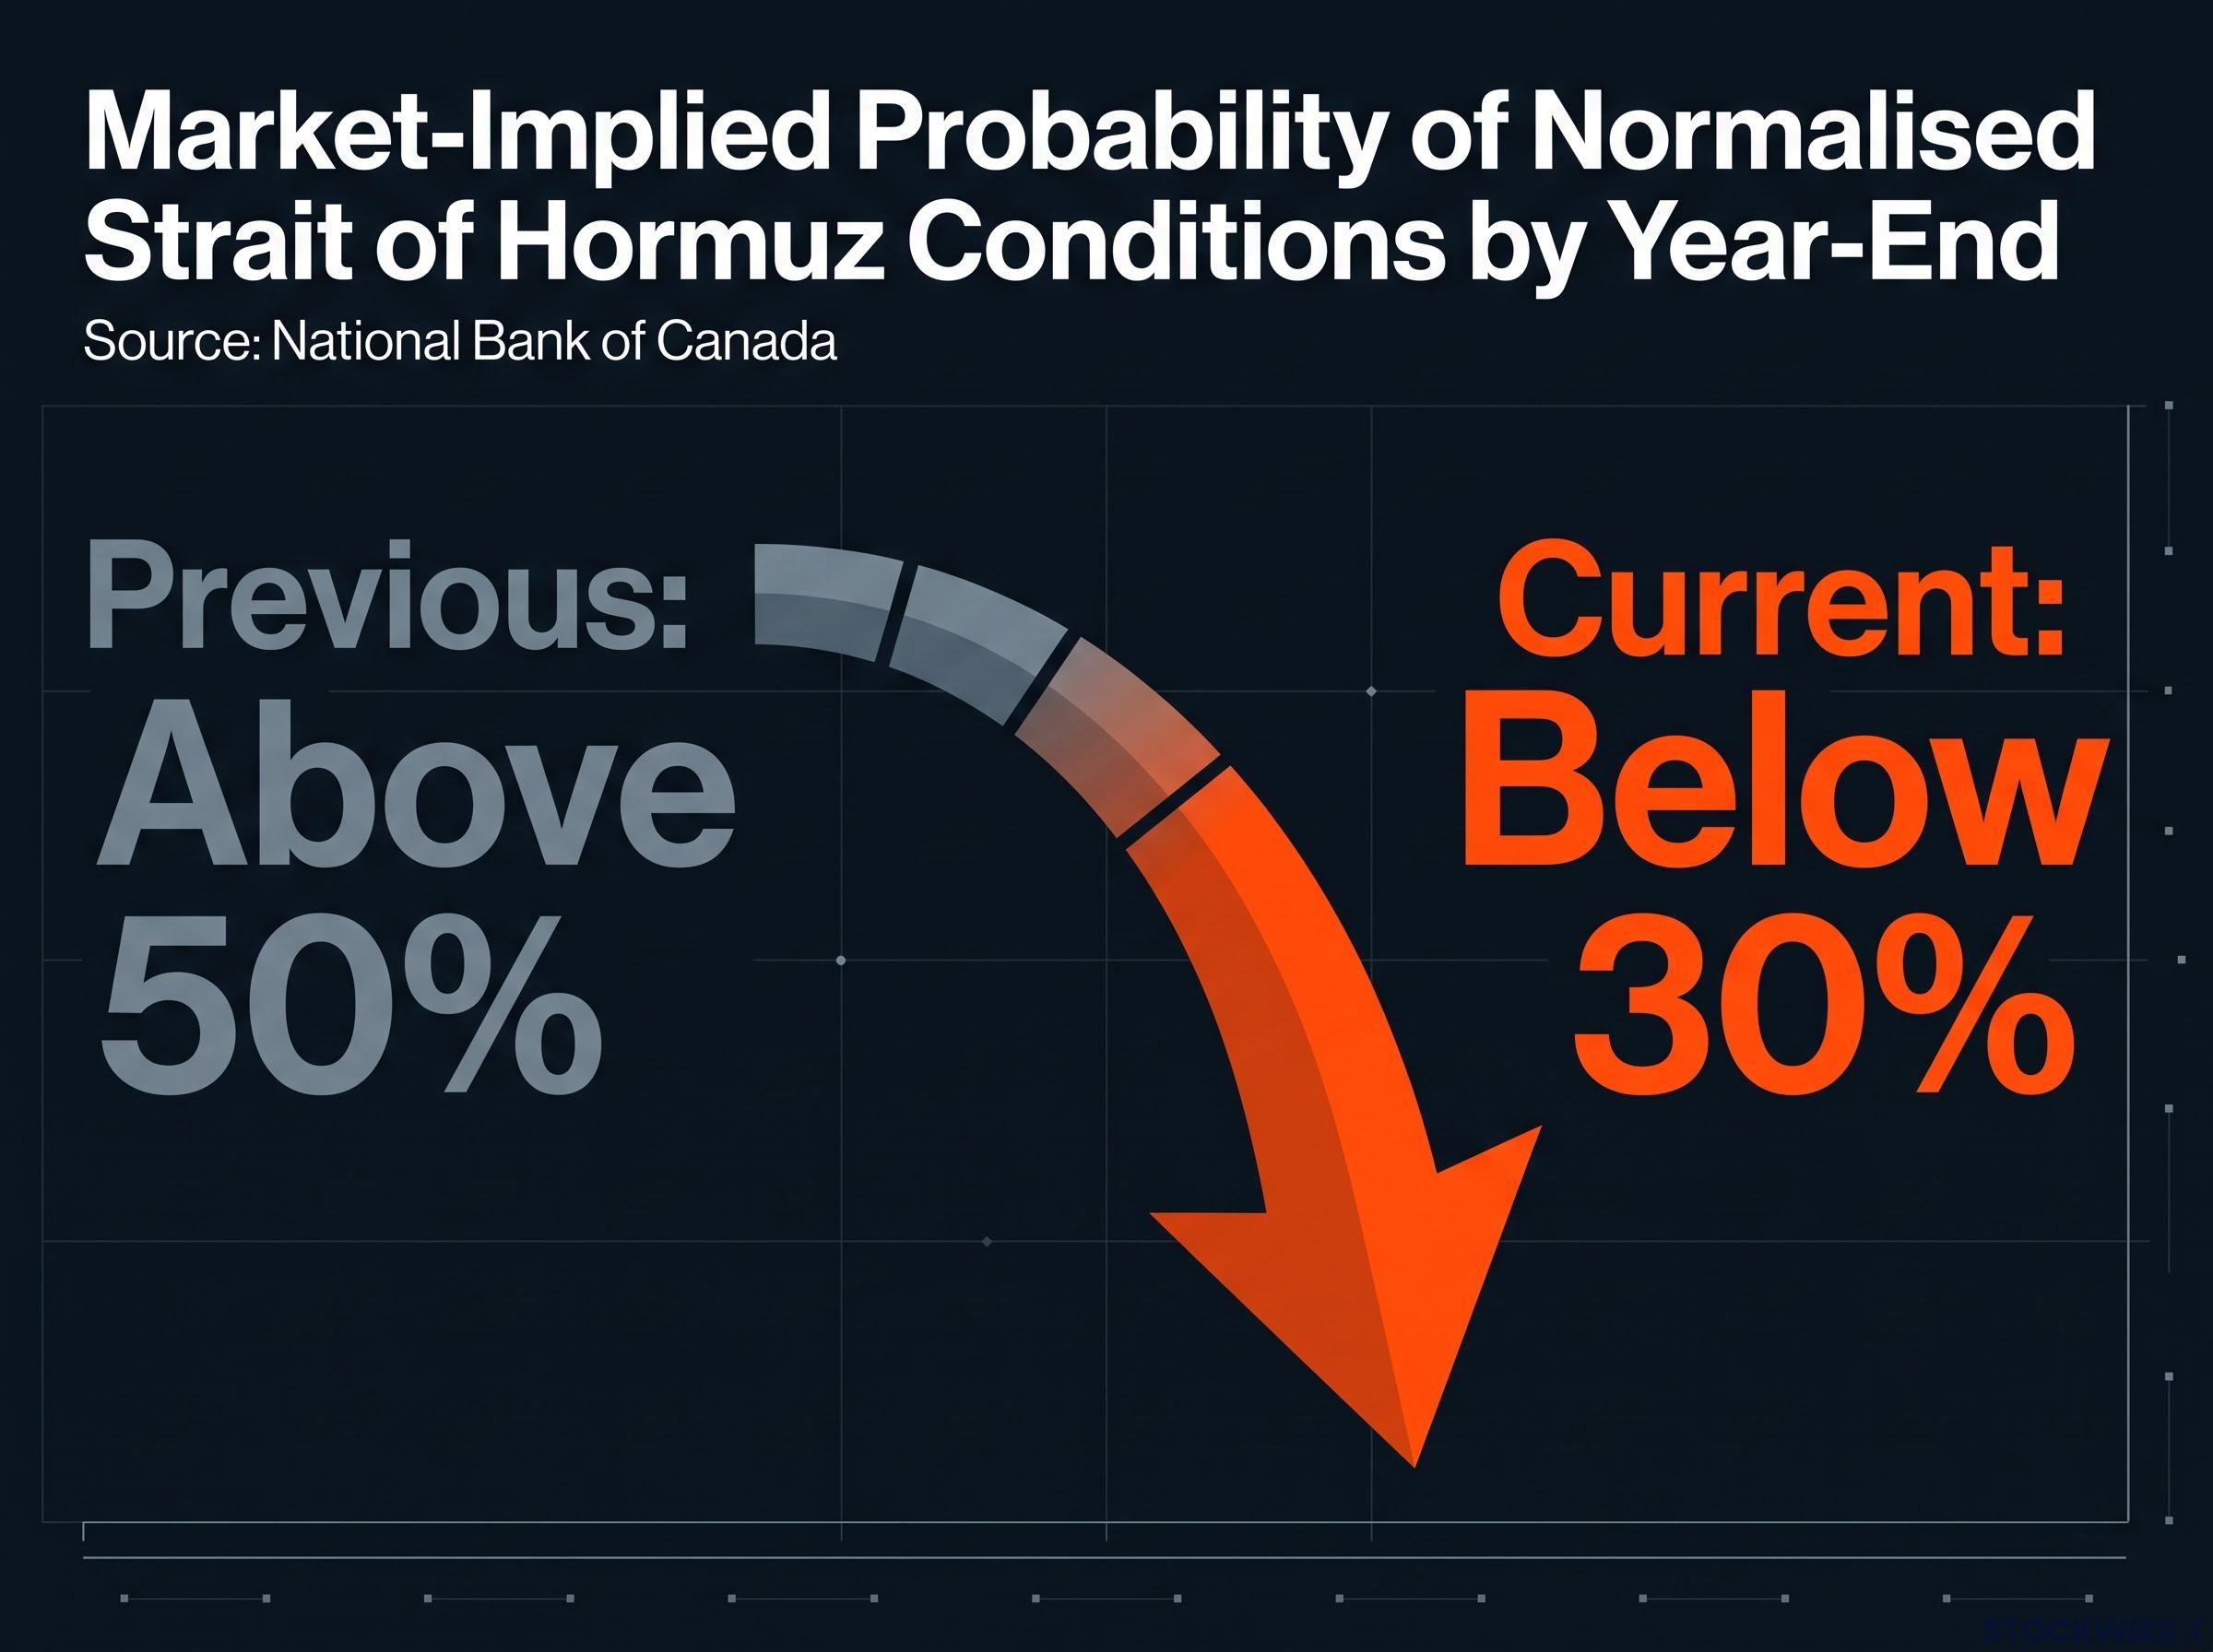
Right now, the market is pricing a real chance that this crisis does not resolve quickly. According to National Bank of Canada, the market-implied probability of normalised conditions in the Strait of Hormuz by year-end has fallen below 30%, down from above 50% earlier.
That repricing is not abstract. It means traders have raised their estimate of a sustained disruption, and that shift is now embedded in both crude and precious metals prices. NBC identified the resulting premium as a source of indirect support for the Canadian dollar during August.
| Scenario | Market implication |
|---|---|
| Normalisation probability above 50% | Prior baseline, thin risk premium in oil and gold |
| Normalisation probability below 30% | Current embedded premium supporting CAD indirectly |
| Rapid de-escalation | Premium unwind risk, sudden loss of CAD support |
The problem is durability. TradingNEWS characterised the conflict as continuing with little prospect of resolution as of early September, and Reuters tied WTI’s weekly gain directly to supply routes still impaired by war. So far, the premium is holding.
The market-implied probability of normalised Strait of Hormuz conditions by year-end has dropped below 30%.
But holding is not the same as anchored. The bull case is that hostilities persist with no clear diplomatic path, keeping the premium structurally sticky and CAD supported. The bear case is that a single credible de-escalation signal emerges, at which point the premium could unwind abruptly.
That asymmetry is the section’s uncomfortable conclusion. The oil premium is doing heavy lifting for CAD, but on borrowed confidence. A diplomatic breakthrough could strip it out far faster than the trade war could ever be resolved, which is why anyone holding a CAD view should treat Hormuz not as background noise but as a live input to their thesis.
Middle East tensions function as a geopolitical dual-channel for USD/CAD: supply disruption threats lift oil and support CAD while the same uncertainty drives safe-haven flows into the dollar, compressing the pair from both directions and explaining why the Hormuz premium produces a more muted exchange rate response than headline oil moves imply.
How the Canada-US tariff war became a structural CAD headwind
The trade dispute did not arrive as one headline. It built through a sequence of escalating decisions, and the weight comes from the accumulation.
It began when the United States imposed 50% tariffs on roughly US$27.6 billion of Canadian goods, effective 22 August 2026, under Section 338 and Section 232 authorities. CNBC characterised the breakdown of negotiations as the direct trigger for the Canadian dollar’s slide.
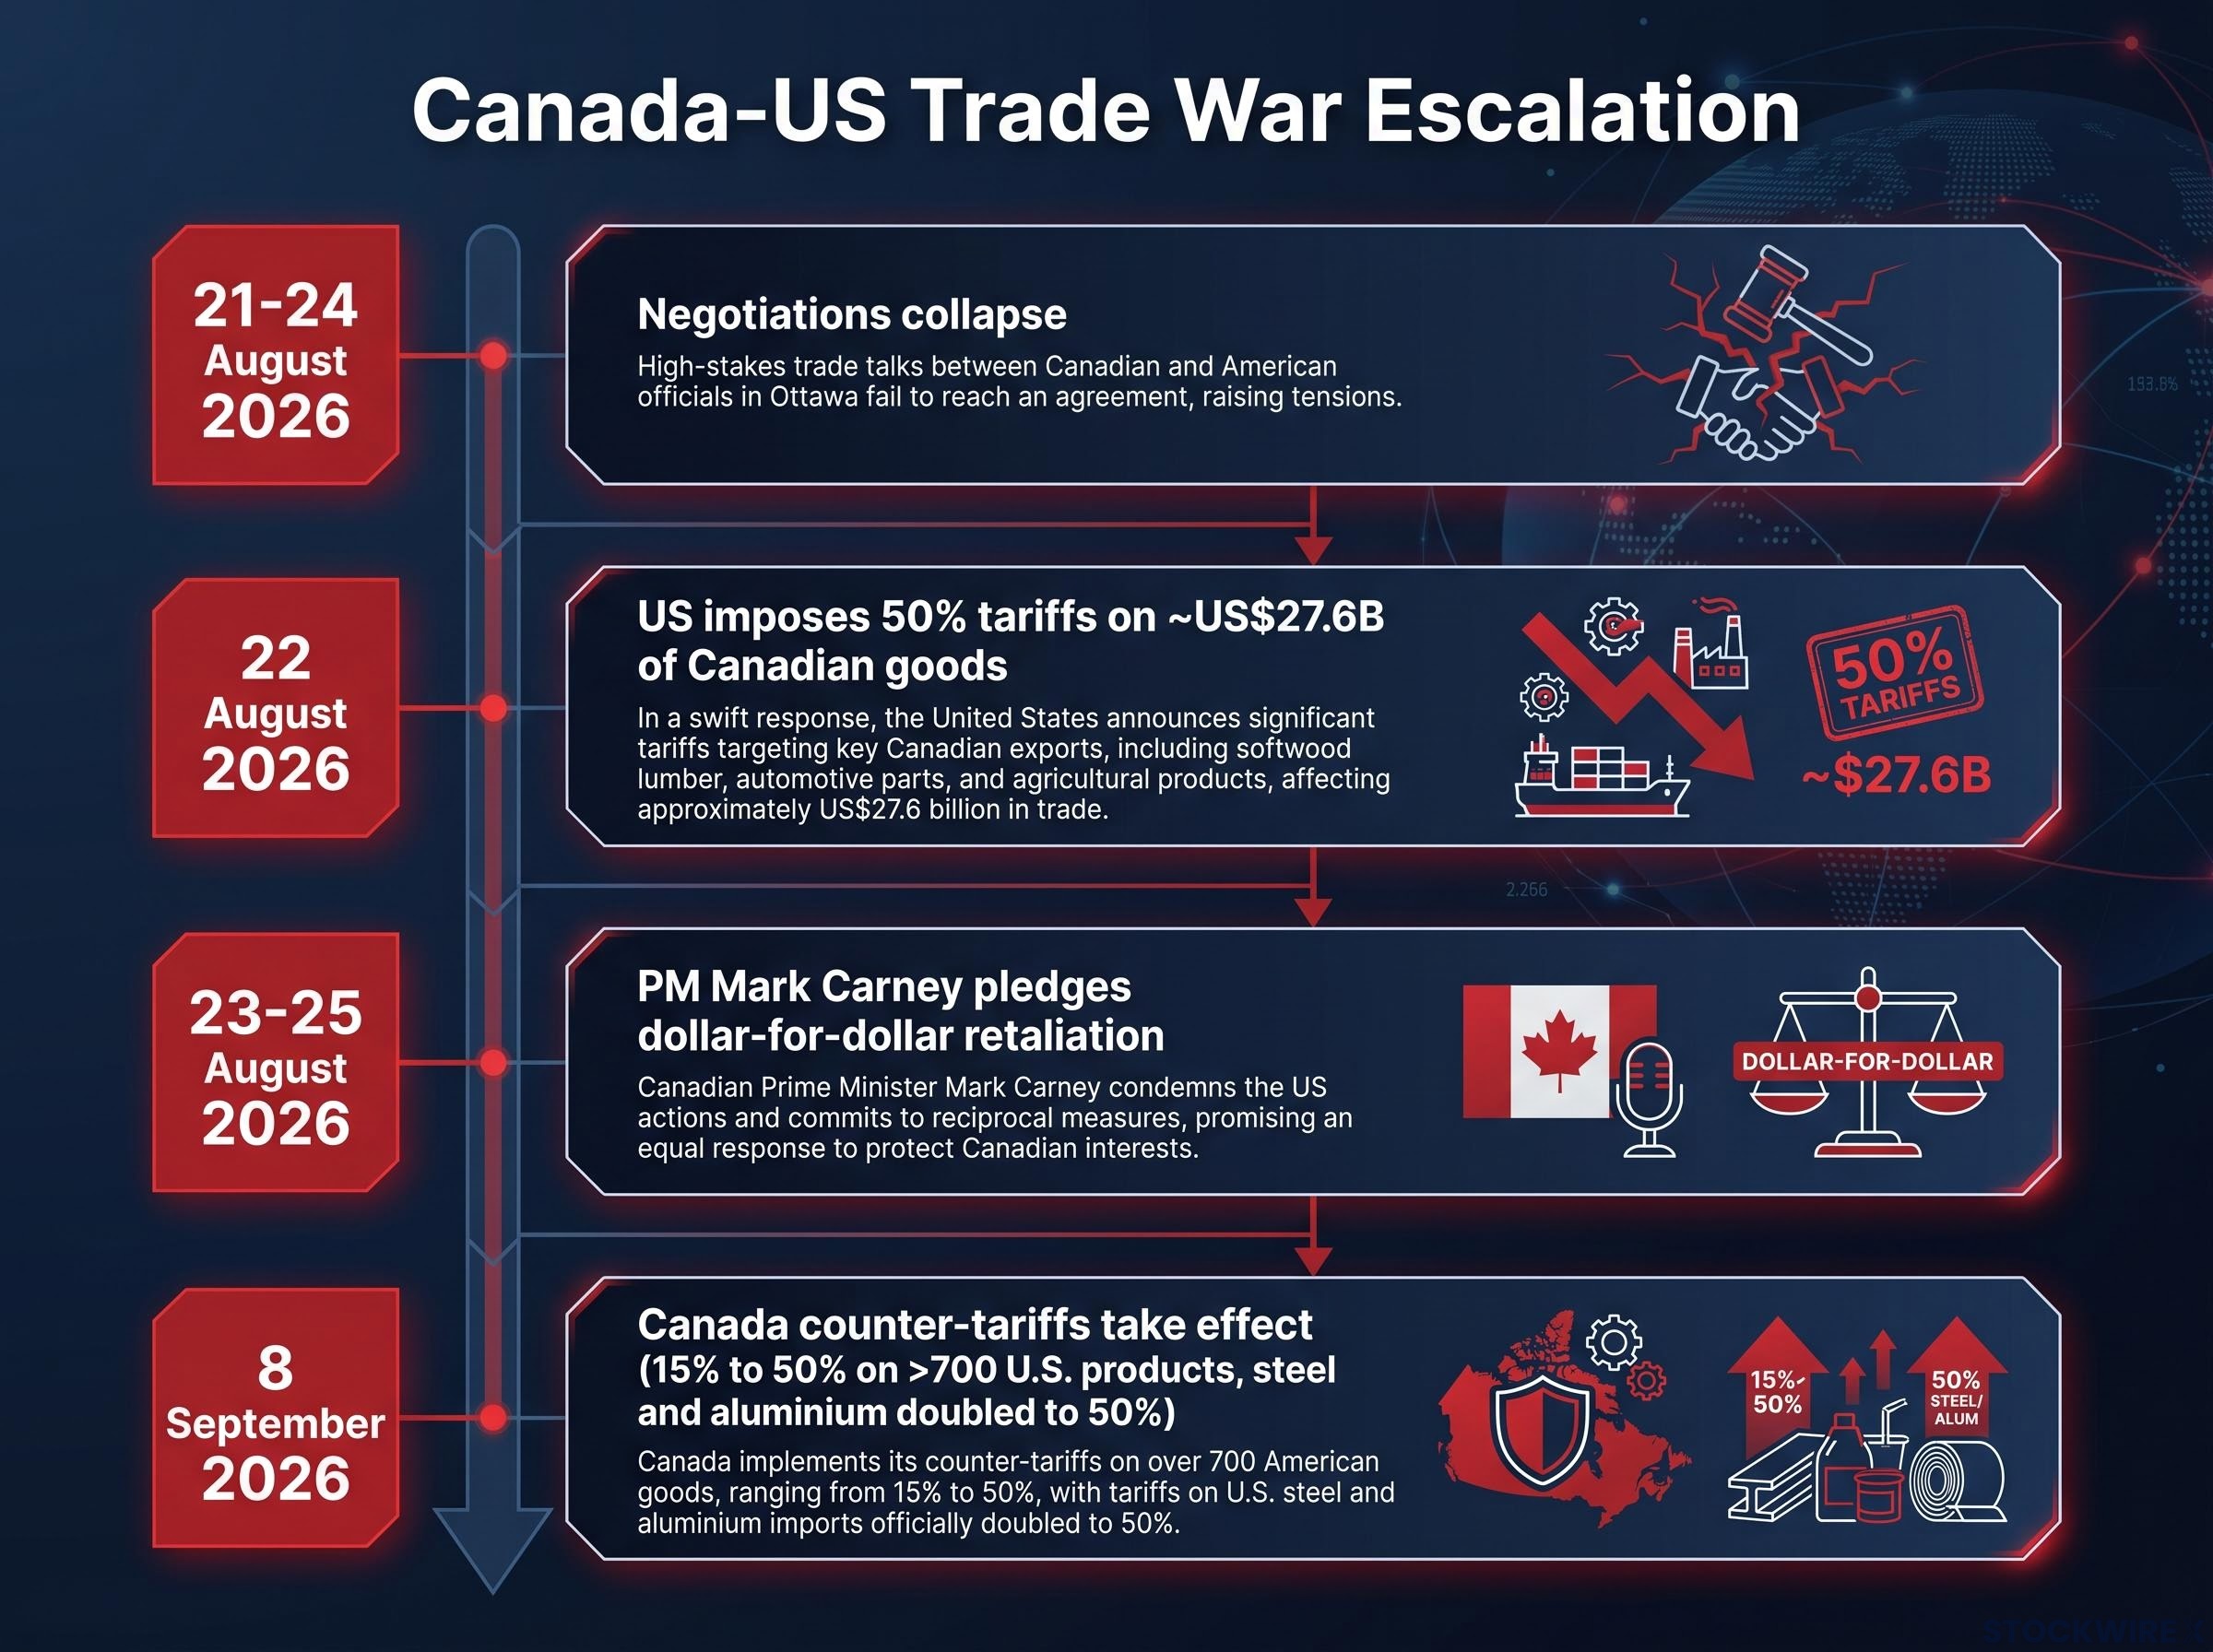
Canada answered in kind. Prime Minister Mark Carney pledged to retaliate dollar for dollar, and counter-tariffs took effect at 12:01 a.m. on 8 September 2026, covering more than 700 U.S. product categories at rates of 15% to 50%, with steel and aluminium tariffs doubled to 50%.
| Event | Date | Detail | CAD implication |
|---|---|---|---|
| U.S. tariffs imposed | 22 August 2026 | 50% on ~US$27.6B of Canadian goods | Raises growth risk, pressures CAD |
| Negotiations collapse | 21-24 August 2026 | Talks fail, per CNBC | Direct trigger for the CAD slide |
| Canada announces retaliation | 23-25 August 2026 | Dollar-for-dollar pledge | Signals prolonged standoff |
| Canada counter-tariffs take effect | 8 September 2026 | 15-50% on 700+ U.S. products | Cements escalation, keeps risk premium elevated |
The scale of what this exposed is the real story. According to BBC analysis, Canada’s average effective U.S. tariff rate now exceeds Mexico’s and approaches levels applied to partners like the UK and Vietnam. That is a country with deep, integrated trade ties suddenly facing tariff severity comparable to nations with no preferential relationship at all.
The shock is concentrated by sector, which sharpens the split between the two forces at work.
The Section 338 product exclusions covering crude oil, critical minerals, and potash were driven by US domestic supply chain self-interest rather than diplomatic concession, which is why the energy-exempt carve-out is more structurally reliable than it might appear and why the tariff headwind and the oil tailwind continue operating on genuinely separate tracks.
- Exposed to the tariff shock: steel, dairy, farm equipment, appliances, pulp and paper, and electronics, all with dense cross-border supply chains.
- Exempt on both sides: oil, natural gas, and critical minerals.
The Canadian Federation of Independent Business and the Department of Finance Canada both confirm broad-based disruption to cross-border supply chains. What this signals to investors matters more than any single sector number: a prolonged standoff would suppress growth expectations and keep a risk premium on CAD regardless of where oil trades, because this is not a one-off tariff but a self-reinforcing escalation loop.
Why oil and gold cannot fully insulate CAD from a 1.40 retracement
Bring both forces together and the outlook turns asymmetric. National Bank of Canada projects USD/CAD retracing toward 1.40 in the near term, having recently traded below 1.38 on the strength of better-than-expected Q3 economic results and firmer commodity prices before the trade escalation shifted the balance.
The oil and gold premiums provide a partial buffer. They cannot provide a complete one, and the reason is structural: they run through different channels than the trade shock and carry a different durability profile.
Energy tailwinds reach CAD through terms of trade and portfolio flows, and they depend on a geopolitically contingent premium that could vanish on a single headline. Trade-war headwinds reach CAD through growth expectations and risk premium, and they show no sign of resolving. One buffer is fragile; the other pressure is entrenched.
Any resumption of Canadian dollar appreciation is contingent on a constructive resolution to Canada-US trade discussions.
That NBC conditional is the analytical hinge. The bank explicitly ties any CAD recovery to progress in trade talks, which makes the negotiation track the primary catalyst to watch.
The bull and bear cases sit unevenly against each other.
- Bull case for CAD: the Hormuz premium holds, and trade talks find a constructive path. Two positive developments, required concurrently.
- Bear case for CAD: the premium unwinds, and escalation continues. Two negatives, either of which is already in motion.
For anyone holding CAD exposure, the read is this. The 1.40 projection is not a worst case; it is the baseline if current conditions simply persist. Getting back toward 1.38 or stronger needs two independent things to go right at the same time, while getting worse needs only one thing to go wrong. That is what asymmetry looks like in practice.
What decides the CAD direction from here
Rather than a static forecast, the useful posture here is a watchlist. Three variables, tracked in priority order, will tell you which scenario is unfolding before it shows up in the spot rate.
- Hormuz normalisation probability. Currently below 30%. If it recovers toward 50%, the oil premium begins to deflate, and it would do so before trade talks reach any conclusion. This is the leading indicator for the energy pillar.
- Canada-US trade negotiation signals. The primary determinant of medium-term direction. A credible de-escalation framework would shift NBC’s 1.40 projection; further escalation would accelerate the retracement. As of 10 September 2026, the most recent move was Canada’s counter-tariffs on 8 September, with no resolution signal visible.
- WTI price action relative to the supply-disruption premium. Watch whether crude holds its gains on genuine tightness or slips as the war premium fades.
Tariff legal fragility is a live variable in the Canada-US standoff: the Supreme Court’s February 2026 IEEPA ruling removed the administration’s broadest trade lever, and each replacement statute, including Section 338 used against Canadian goods, carries increasing judicial exposure that could narrow or reverse specific measures before any negotiated resolution arrives.
Understanding these two anchors, the Hormuz probability and the trade-talk track, lets you update a CAD view in real time as events develop, rather than reacting to each headline in isolation.
The asymmetric downside case
The scenario to respect is the compounding one: Hormuz de-escalates, the oil premium unwinds, and the trade standoff grinds on. That would leave CAD with no meaningful support pillar intact and the path toward 1.40 wide open.
This article is for informational purposes only and should not be considered financial advice. Investors should conduct their own research and consult with financial professionals before making investment decisions.
Past performance does not guarantee future results. Financial projections are subject to market conditions and various risk factors, and the forward-looking scenarios described here are speculative and subject to change based on geopolitical and policy developments.