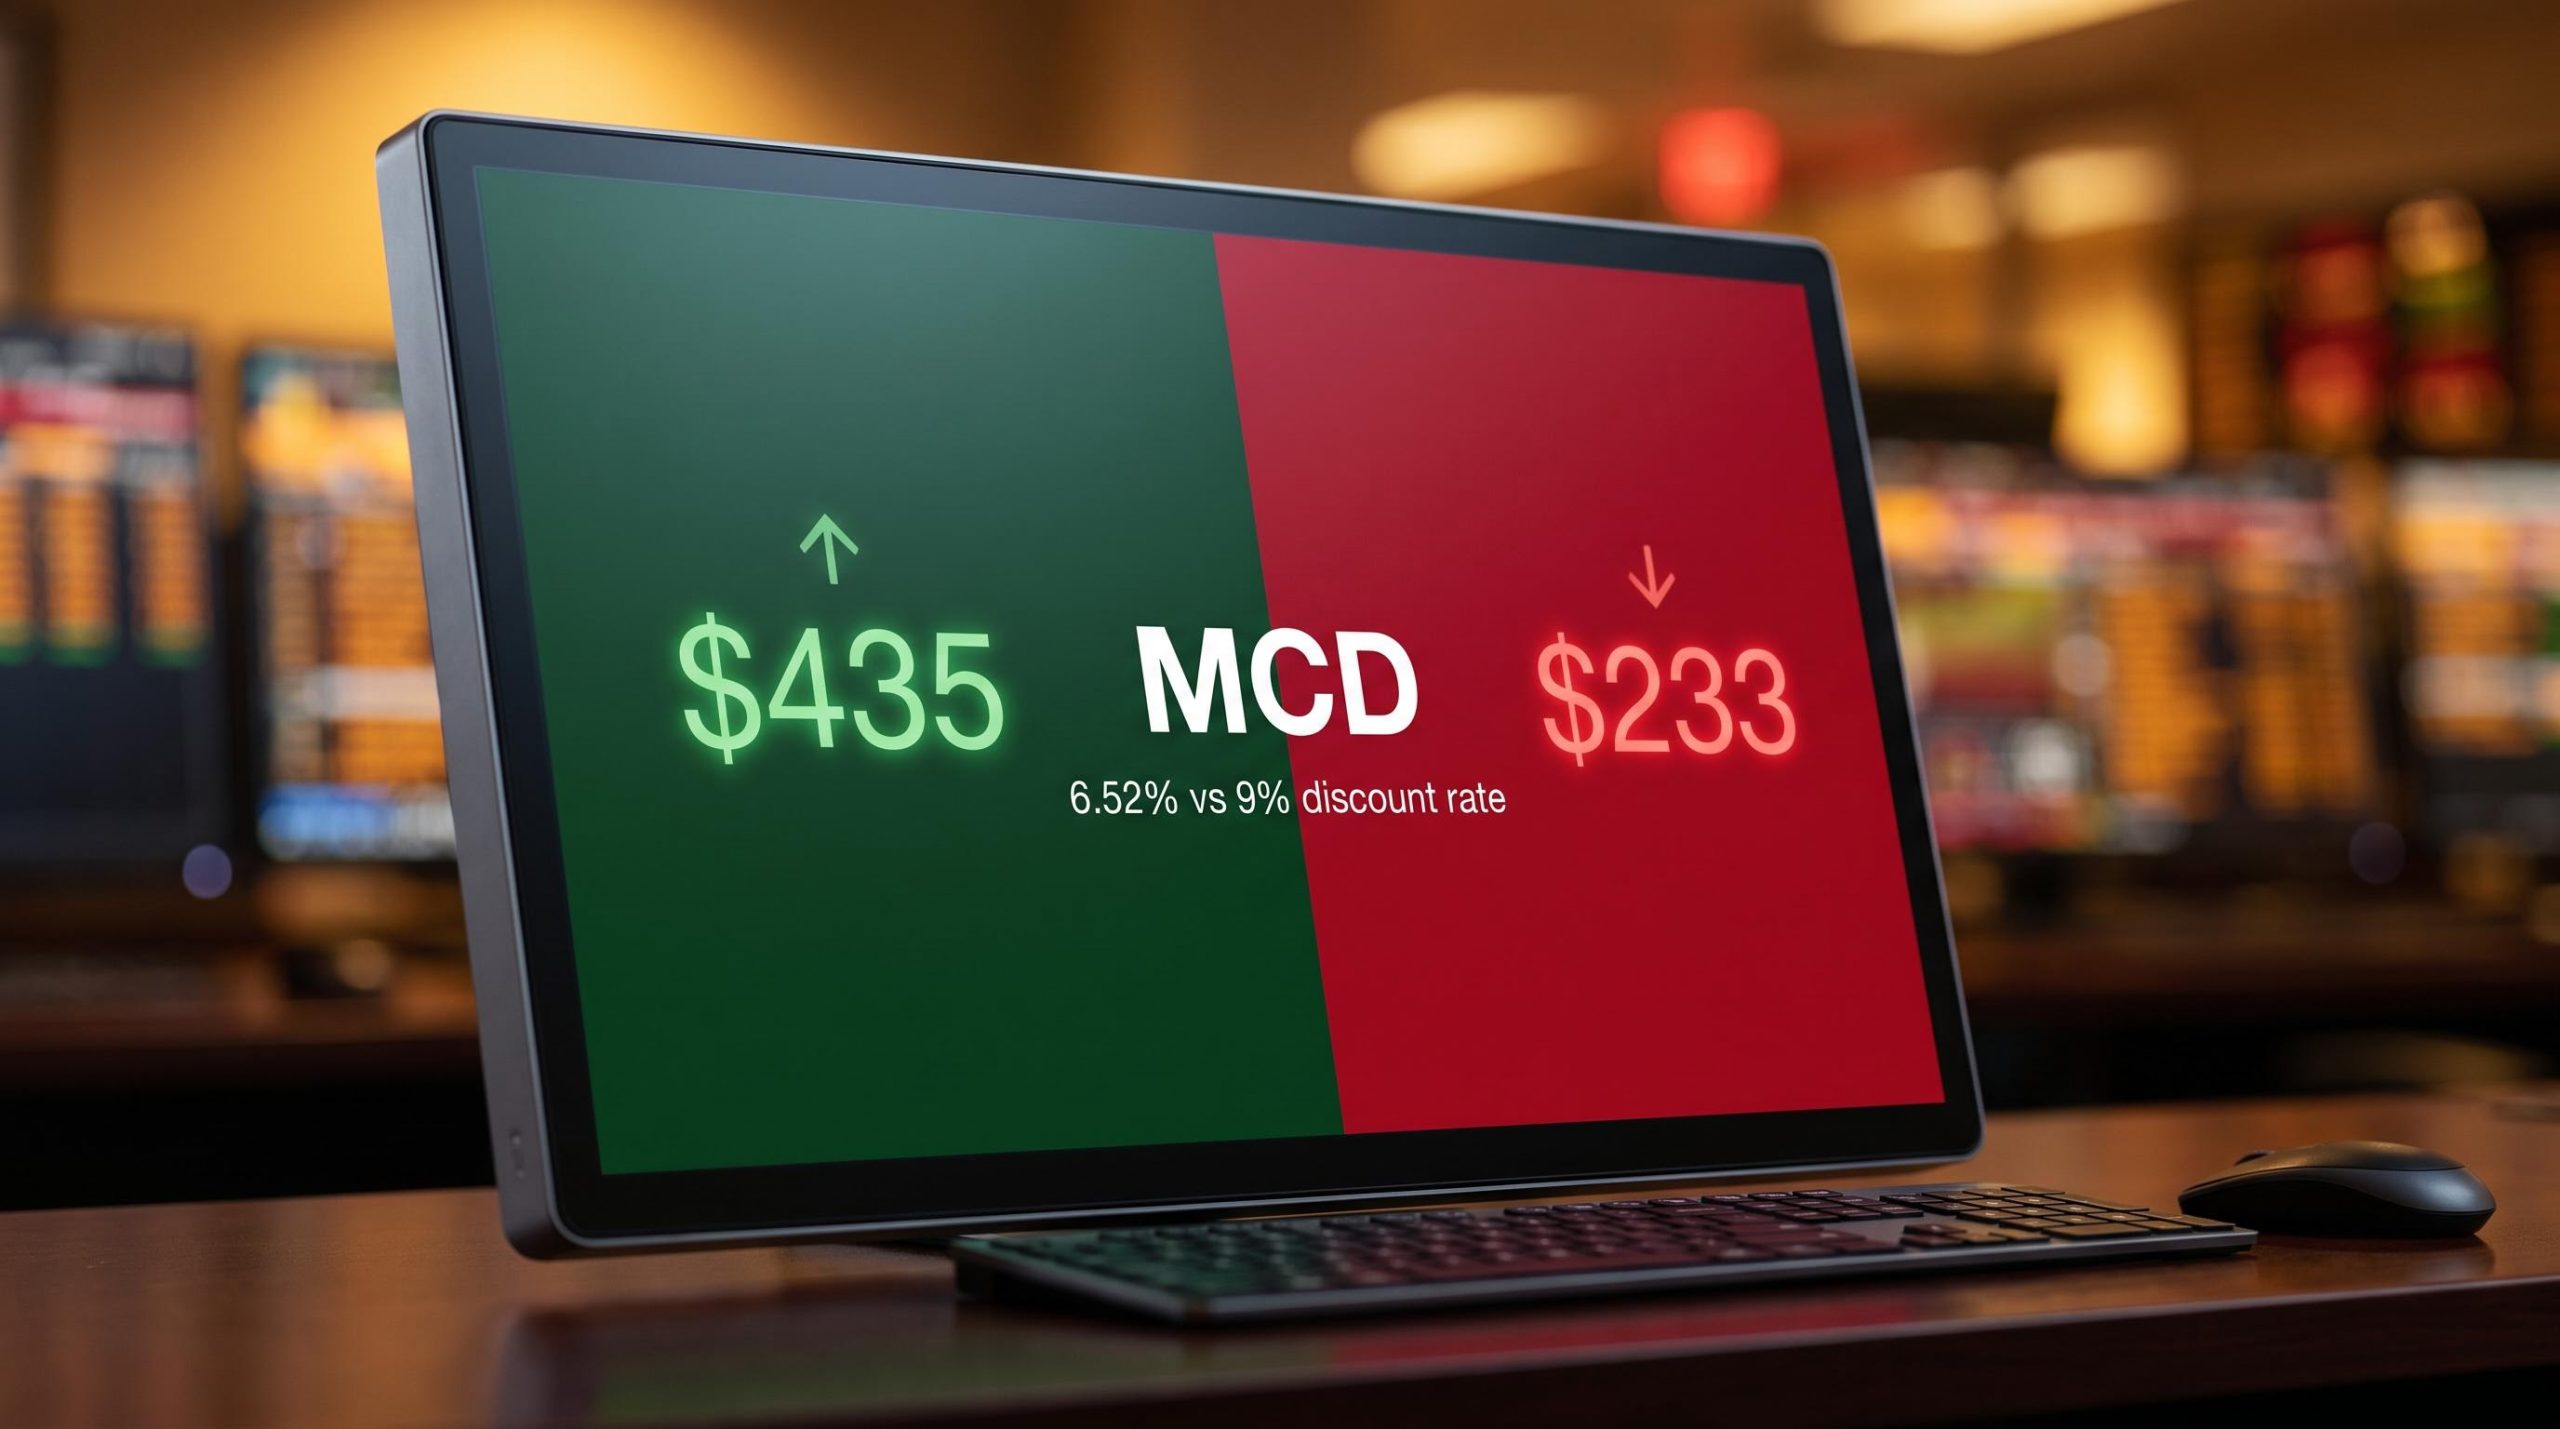
Depending on which valuation model you run and which discount rate you plug in, McDonald’s stock in September 2026 is either a compelling buy sitting 23% below fair value or a stock trading roughly 40% above where it should be priced. Both conclusions rest on defensible assumptions. That gap is the entire problem.
The stock trades in the mid-$250s with a trailing price-to-earnings ratio of around 20.6x, below its own historical norms and well off recent highs. For investors conditioned to read lower multiples as an opening, this looks like one. But the same company carries nearly $40 billion in long-term debt, franchisees facing real margin compression, and a discounted cash flow model whose output is exquisitely sensitive to the single number you choose as your required return.
The question of whether McDonald’s is undervalued is not a case of sloppy analysis on one side. It is a genuine methodological fork. What follows walks through the four frameworks that matter most for pricing this stock, what each one tells you, where each one breaks down, and what the combination actually suggests for a US investor making a real allocation call in 2026.
What McDonald’s multiple actually tells you at 20.6x earnings
Relative valuation is the first screen most investors apply, and at first glance the reading flatters McDonald’s. The trailing P/E of roughly 20.6x to 20.8x (for the twelve months ended 30 June 2026) sits toward the lower end of the company’s historical range. On a blue-chip name with decades of compounding behind it, that looks like a discount.
The forward P/E of 18.32x to 19.79x reinforces the impression, implying that analysts expect earnings to grow into the current price. But the picture shifts the moment you set the earnings multiple beside the cash flow multiple.
Price-to-free-cash-flow, measured over the same trailing period, sits at 23.51x. That is a meaningful spread. When a company’s earnings look cheaper than its cash flow, it is worth pausing on why.
The usual culprit is capital structure. McDonald’s has spent years buying back its own shares, and much of that has been funded through debt issuance rather than surplus operating cash. Fewer shares outstanding lifts earnings per share mechanically, which compresses the P/E without the underlying business becoming any cheaper.
That is the critical caveat here. A P/E that has drifted lower can reflect genuine value, or it can reflect financial engineering flattering the denominator. The cash flow multiple, harder to manipulate through buybacks, tells the less generous version of the story.
| Metric | Current Reading | Historical Context | What It Implies |
|---|---|---|---|
| Trailing P/E | 20.6x-20.8x | Toward lower end of own range | Optically cheap versus history |
| Forward P/E | 18.32x-19.79x | Assumes mid-single-digit growth | Prices in earnings expansion |
| Price-to-free-cash-flow | 23.51x | Less flattering than P/E | Buyback-supported EPS possible |
Consensus puts 2026 earnings per share at roughly $12.80 to $13.04, rising toward $14.90 to $15.10 by 2028. Steady, but not the kind of acceleration that would justify paying up on the multiple alone.
The implied growth rate embedded in McDonald’s forward P/E of 18.3x to 19.8x converts the current share price into a mathematical requirement: the minimum annual earnings expansion the company must deliver for investors to earn their target return, a figure the multiple itself never directly shows.
A practitioner benchmark worth holding: a genuinely comfortable entry point on McDonald’s would sit below a 20x P/E, which means a further pullback from current levels rather than an entry here.
When big ASX news breaks, our subscribers know first
Why the same DCF model produces a 40% overvaluation and a 23% margin of safety simultaneously
Here is where the valuation debate stops being about McDonald’s and starts being about arithmetic. A discounted cash flow model estimates what future cash is worth today, and it does that by discounting those future flows back at a required rate of return. Change that one rate, and the fair value swings by tens of dollars per share.
McDonald’s has a low beta, meaning its share price moves less violently than the broader market. Beta feeds directly into the Capital Asset Pricing Model (CAPM), the standard method for deriving a required return, and a low beta produces a low output. For McDonald’s, that CAPM-derived rate lands at roughly 6.52%.
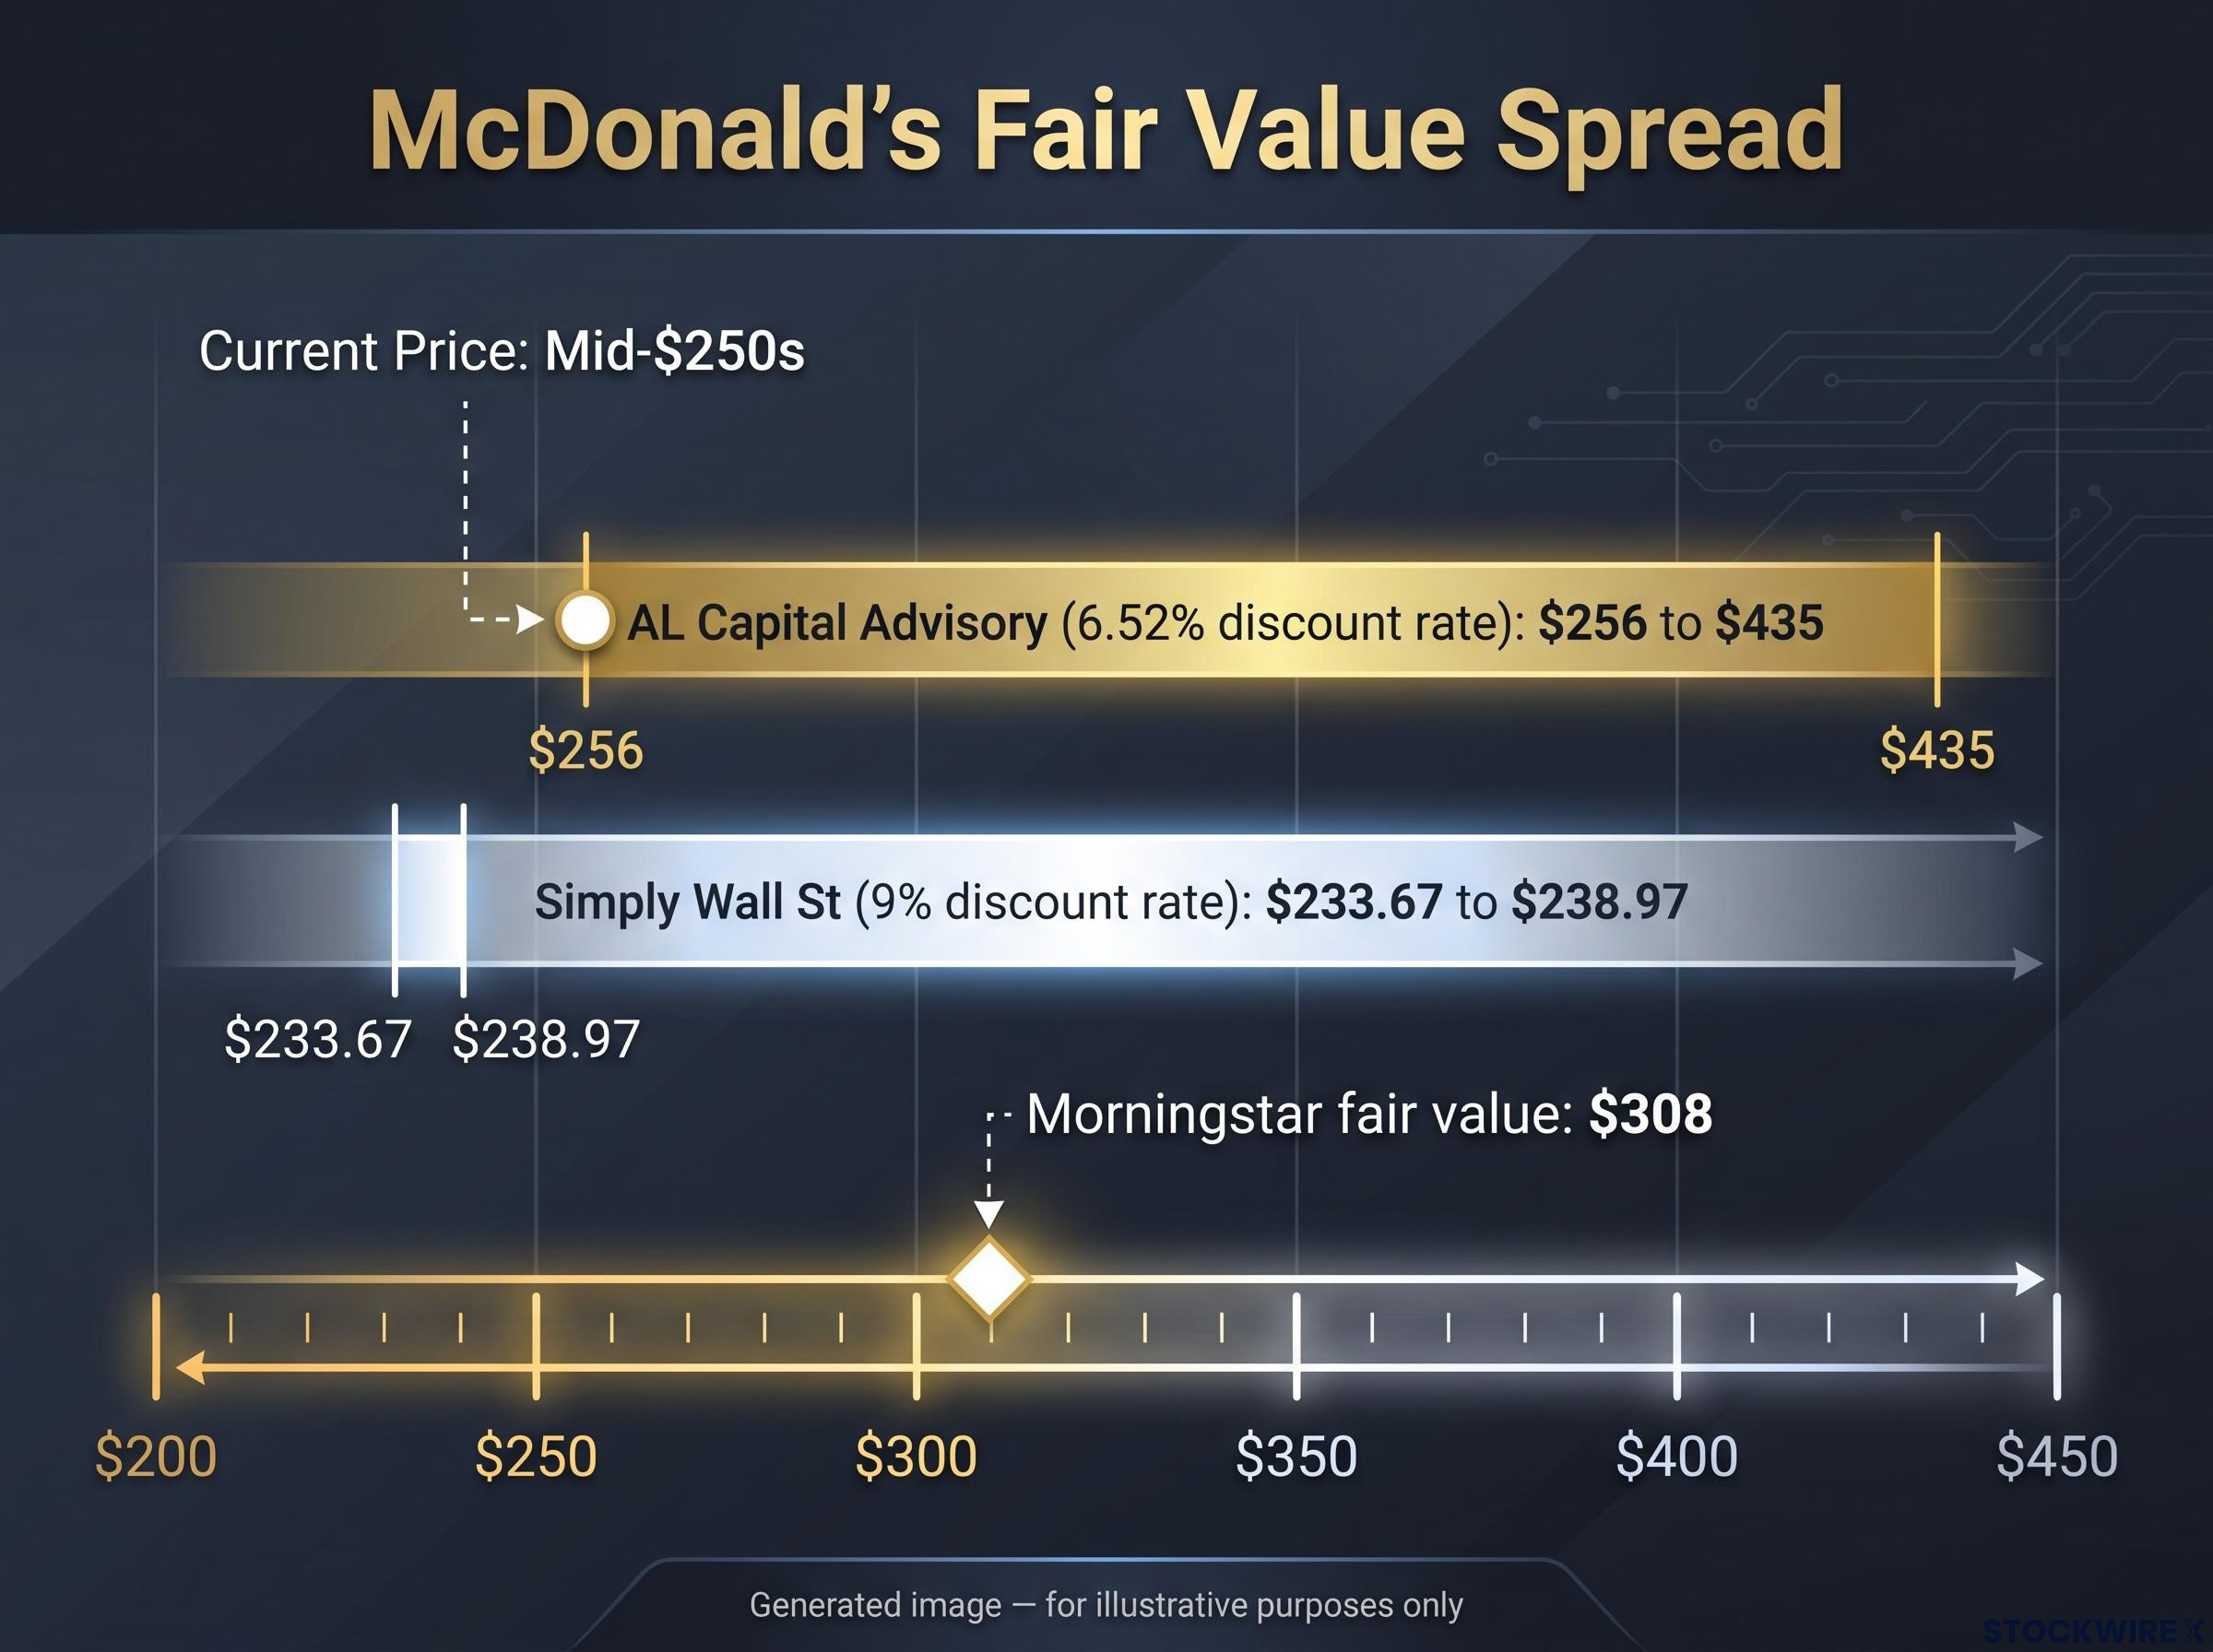
Run the DCF at 6.52% and the model concludes the stock is moderately undervalued. AL Capital Advisory, working from the asset-light model and roughly 32% net margins, presents a blended fair-value range of $256 to $435 and argues for something like a 23% margin of safety at current prices.
Now change the number. Standard discount rate bands for stable large-caps run 8% to 10%. Apply a 9% required return, described as a slight premium above AAA corporate bond yields, and the same model concludes the stock is approximately 40% overvalued.
The independent fair values scatter accordingly:
- 6.52% discount rate: fair value spanning $256 to $435, implying modest undervaluation at the mid-$250s price.
- 9% discount rate: fair value pulled down to the low-to-mid $230s, with Simply Wall St estimates near $233.67 to $238.97 (flagged as unverified), implying meaningful overvaluation.
For anyone running or reading a McDonald’s DCF, this is the takeaway. The most consequential decision is not the growth rate you assume. It is the discount rate you choose, because a 2.5 percentage point difference in that single input reverses the buy-or-avoid signal entirely.
The terminal value assumption alone typically drives 60-80% of a DCF model’s total implied value, which is precisely why a 2.5 percentage point shift in the discount rate reverses the buy signal entirely: the compounding effect of that rate change on the terminal component dwarfs any adjustment to near-term cash flow projections.
For balance, Morningstar’s fair value sits at roughly $308, with the shares frequently classified as fairly priced to expensive depending on the day. That lands between the two DCF extremes and is a useful sanity check when the models pull so hard in opposite directions.
When does a low beta justify a low discount rate, and when does debt change the answer?
Beta measures price volatility against the market. It says nothing directly about financial risk. Those two things can diverge sharply when a company carries significant fixed obligations, and McDonald’s does.
The BBB+ credit rating from S&P Global Ratings and a Debt/EBITDA target of 3.3x to 3.4x suggest leverage that is manageable rather than dangerous. But manageable is not zero. That gap between a placid beta and a real balance sheet is precisely the argument valuation professionals make for adding a risk premium above the raw CAPM output.
Nearly $40 billion in debt: a real constraint or a well-managed capital structure?
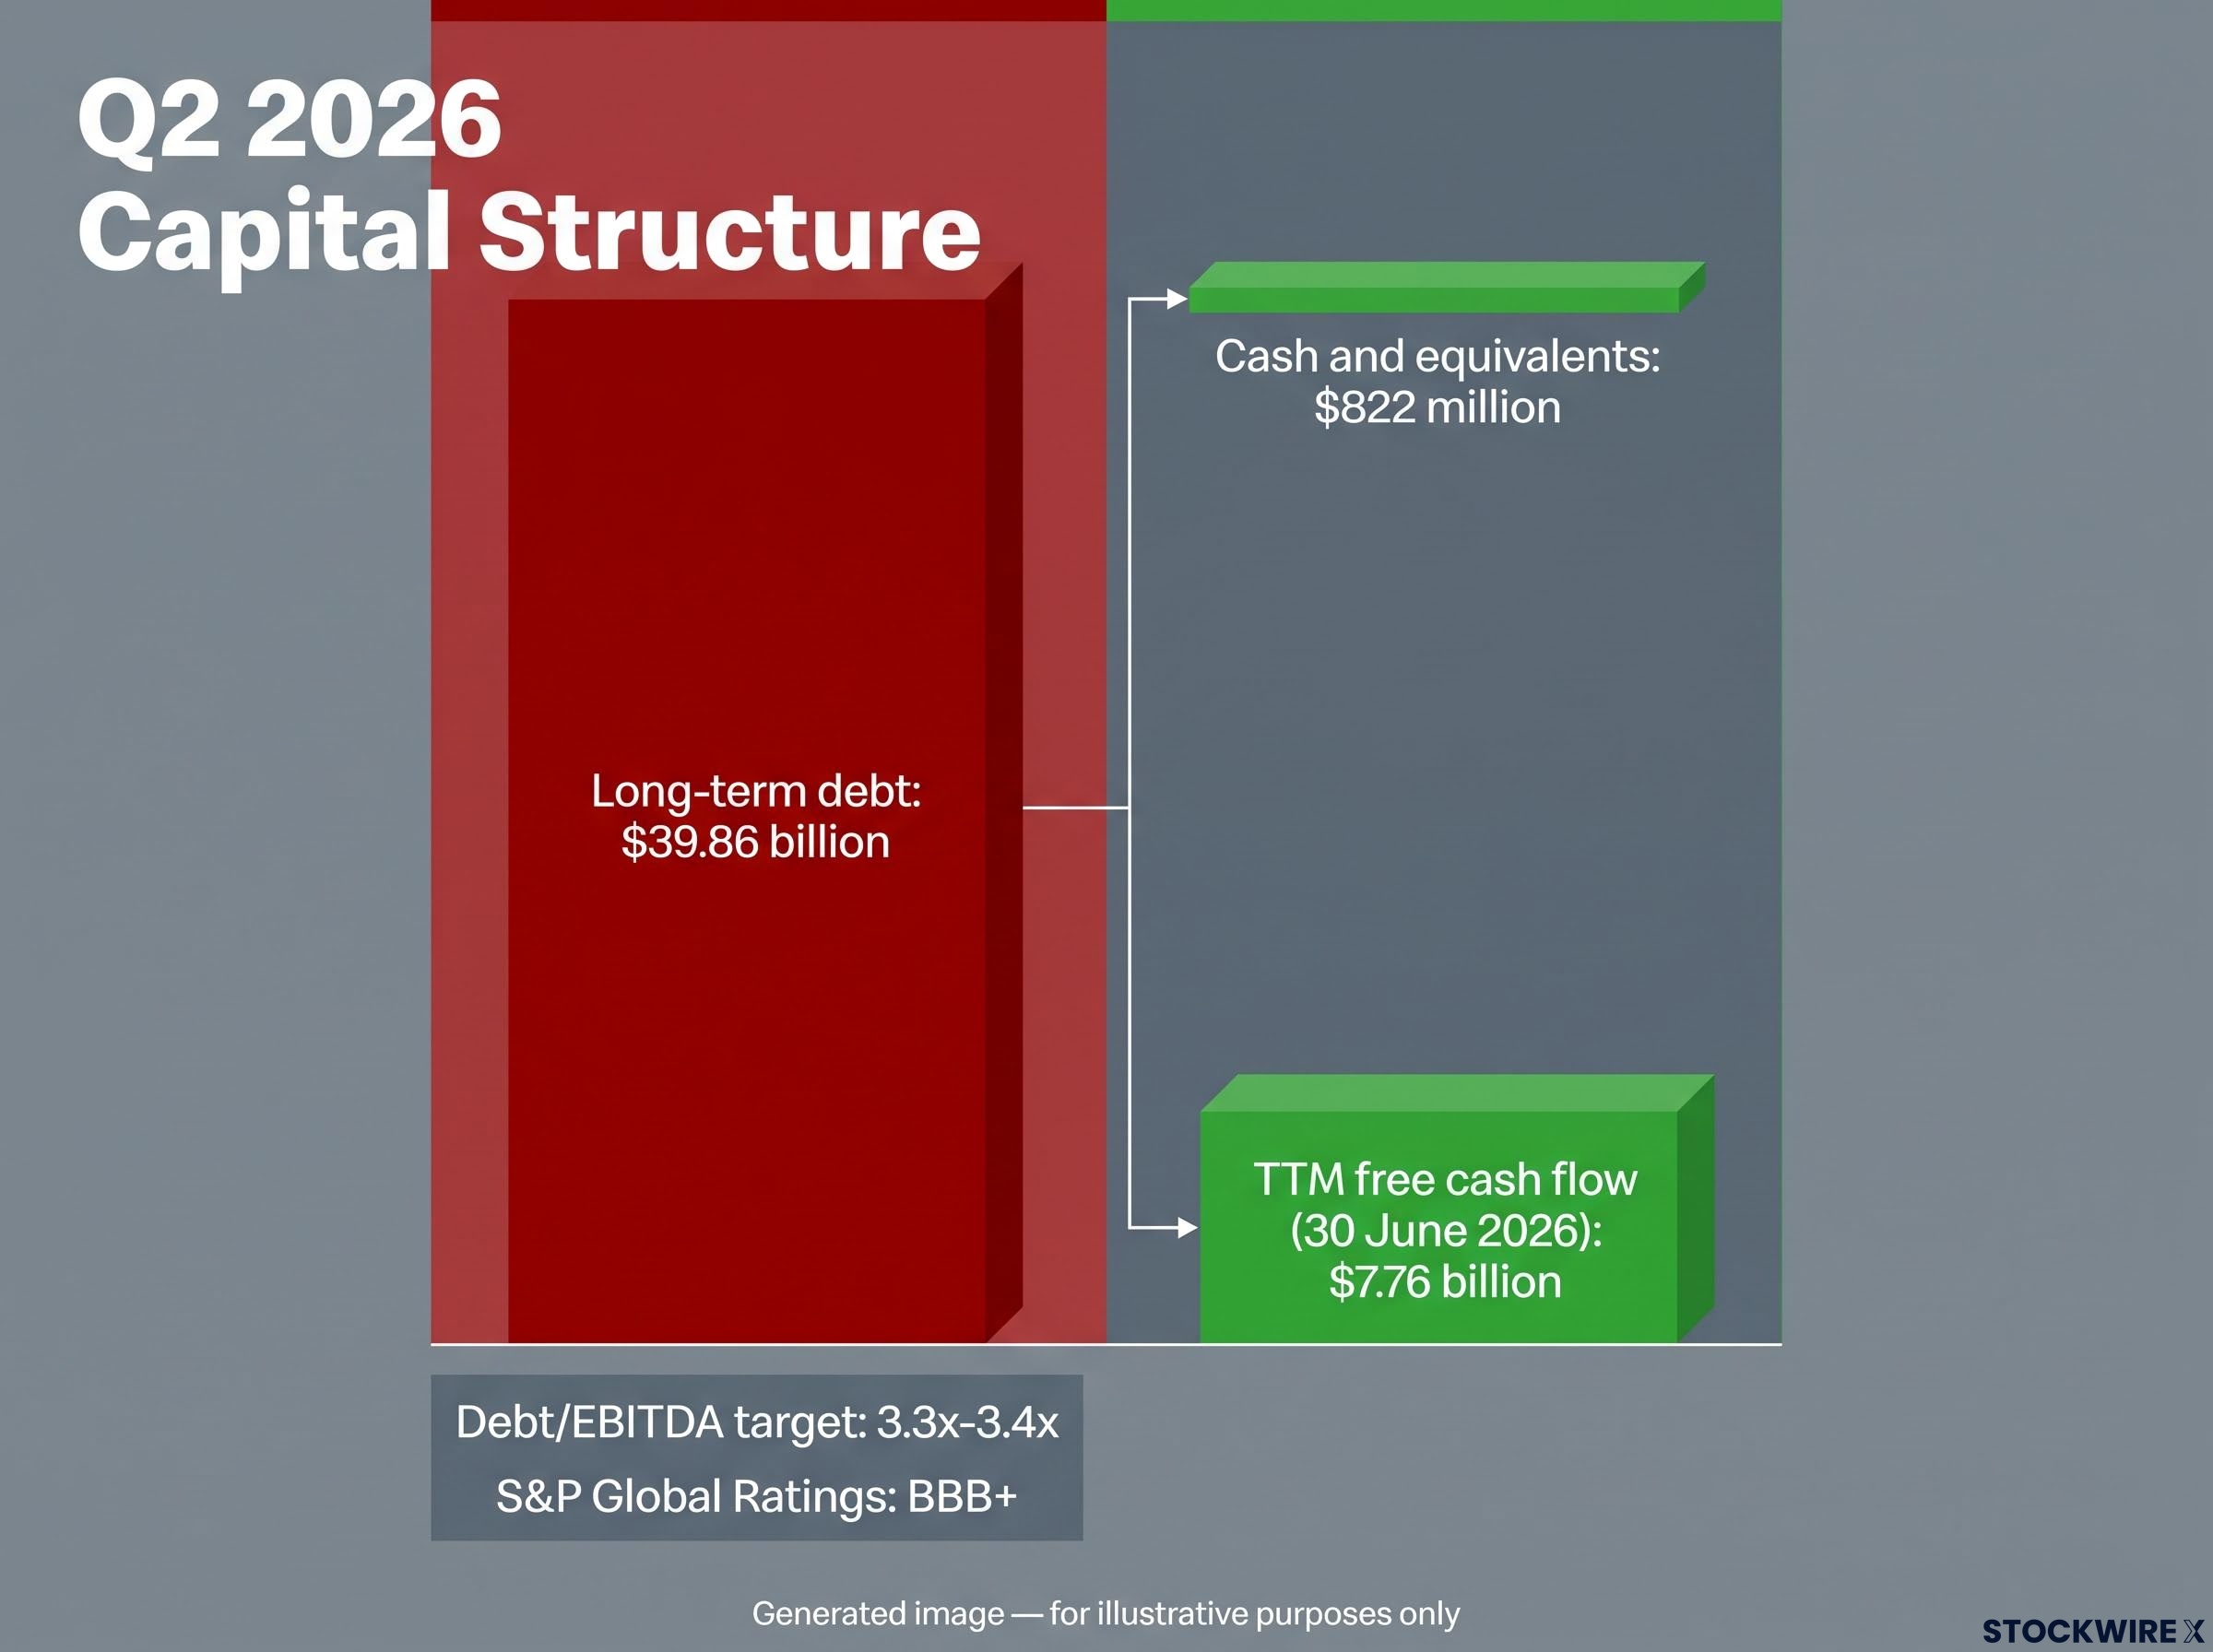
The number that most retail analysis skips over is the one that deserves the most attention. As of Q2 2026, McDonald’s carried long-term debt of approximately $39.86 billion, up materially from prior years. Against that sits cash and equivalents of just $822 million.
That debt did not accumulate through distress. It is the by-product of a deliberate capital-allocation strategy: funding share buybacks, dividends, and growth capital expenditure, much of it issued during a period of historically low interest rates. Credit analysts treat it as consistent with the BBB+ rating precisely because the asset-light franchise model throws off reliable, high-margin cash.
The S&P Global Ratings BBB+ assessment, issued in March 2026, pegs adjusted Debt/EBITDA at approximately 3.2x for the year, providing the most direct authoritative anchor for the leverage assumptions that underpin bull-case DCF models of McDonald’s franchise cash flows.
And the cash generation is real. Trailing free cash flow reached roughly $7.76 billion through 30 June 2026, comfortably covering interest and shareholder returns under current conditions.
| Balance Sheet Metric | Q2 2026 Reading | What It Implies |
|---|---|---|
| Long-term debt | $39.86B | Large fixed obligation to service |
| Cash and equivalents | $822M | Thin liquidity buffer |
| TTM free cash flow | $7.76B | Strong coverage under normal conditions |
| Debt/EBITDA target | 3.3x-3.4x | Leverage held within stated band |
So where does the debt turn from managed feature into valuation headwind? Three specific conditions. A sustained rise in refinancing rates that lifts interest costs as low-rate notes mature. A same-store sales deterioration that pressures royalty income. Or a scenario where franchisee stress forces corporate concessions on royalties or rents.
The contrast is worth sitting with: $822 million in cash against $39.86 billion in debt. The coverage comes from the income statement, not the balance sheet.
That distinction matters for what you are actually buying. The debt is not a crisis, but it does mean McDonald’s has limited room to absorb a prolonged revenue shock. Investors who assume the franchise model fully insulates them from balance sheet risk are pricing in a protection the numbers do not entirely support.
How franchisee stress flows upstream to corporate valuation
The genius of the McDonald’s model is that corporate barely touches an operating cost. The company predominantly collects royalties and rent, which make up around 60% of certain income streams, while franchisees absorb the labour and food inflation on their own profit and loss statements. That structural insulation is what produces corporate operating margins of 44% to 46% and net margins near 31% to 32%.
For years that arrangement has looked bulletproof. Franchisees carry the volatility, corporate collects the steady cut. But insulation is not the same as immunity, and the current cost environment is testing where the seams are.
Franchisee margins typically sit at 10% to 15% after labour, food, rent, and royalties. Squeeze that thin margin, and the strain eventually travels upstream through a clear mechanism.
- Operator economics compress. Higher minimum wages, such as California’s $20/hour rate effective 2024, and commodity inflation erode already-slim franchisee profits.
- Investment and expansion slow. Strained operators become less willing to fund new units, remodels, or digital rollouts, which caps system-wide growth.
- Corporate growth assumptions break. Slower unit growth and potential royalty or rent concessions in weaker markets undercut the smooth compounding that bull-case models take for granted.
The point for valuation is direct. Anyone valuing McDonald’s purely on corporate cash flows is pricing in a royalty stream that assumes franchisee economics stay viable, and the current data suggests that assumption deserves more scrutiny than most models give it.
What the same-store sales trend signals about system health in 2026
There is directional evidence the pressure is already showing. An August 2025 analysis pointed to US same-store sales declines, including a reported drop in Q1 2025 (flagged as unverified). Softening comparable sales hint that the pricing ceiling may be closer than the growth consensus assumes.
Consumer price sensitivity in the quick-service restaurant category is cyclically elevated, and the public perception that McDonald’s has become expensive compounds the supply-side franchisee squeeze. Geographic variation makes it uneven: pricing in high-cost regions such as the New York and New Jersey area runs noticeably higher, concentrating the strain rather than spreading it evenly across the system.
Consumer demand contraction across the quick-service restaurant category is not a McDonald’s-specific phenomenon: Q1 2026 earnings from across the sector confirmed a widening income fault line, with value-tier operators holding volumes through trade-down behaviour while mid-tier and premium operators sacrificed margins to retain price-sensitive customers.
Putting the frameworks together: what a disciplined valuation conclusion actually looks like
Line the four frameworks up and the shape of the disagreement becomes clear. The P/E says optically cheap versus history. The price-to-free-cash-flow says less so. The DCF says whatever your discount rate tells it to say. And the debt and franchisee dynamics are the risks most bull cases underweight.
| Method | Current Reading | Bull Case Implication | Bear Case Implication |
|---|---|---|---|
| Trailing P/E | 20.6x | Below historical norms | Buyback-flattered, not cheaper |
| Price-to-FCF | 23.51x | Reasonable for quality | Less flattering than P/E |
| DCF fair value | Rate-dependent | $256-$435 at 6.52% | $233-$239 at 9% |
| Debt / franchisee | $39.86B debt | Managed, high coverage | Limited shock absorption |
The decision, then, is really a function of your own required return. Accept a sub-7% hurdle for a defensive holding and the case for modest undervaluation holds together coherently. Demand 9% and the stock has real downside to fair value, with consensus 12-month price targets in the low-to-mid $320s and Morningstar’s $308 sitting well above the bear-case $233 to $239 range.
The most honest conclusion a disciplined analyst can reach is that McDonald’s is fairly priced for a patient investor with a low required return and genuinely risky for anyone applying a standard 9% hurdle. The right answer depends less on the company than on the investor’s own framework.
Three variables will tip the balance from here:
- Same-store sales trend. A recovery validates the growth consensus; continued weakness confirms the pricing ceiling is near.
- Refinancing rate environment. Rising rates lift the cost of servicing that near-$40 billion debt as low-rate notes mature.
- Franchisee royalty negotiation signals. Any move toward corporate concessions would confirm operator stress is flowing upstream.
That is more useful than a single price target, because it tells you exactly what to watch and what to decide for yourself.
Making a call on McDonald’s when the models disagree
You are the missing variable. The price target spread runs from $233 on the bear DCF to $435 on the bull blended case, against a current price in the mid-$250s, and where you land inside that range is set by your own required rate of return.
- The defensive income investor with a genuinely low required return can view McDonald’s as fairly to modestly attractively priced, a stable compounder to hold rather than trade.
- The standard return investor applying an 8% to 9% hurdle should treat the stock as fully valued to overvalued, with the forward P/E of 18.3x to 19.8x the most relevant near-term relative-value gauge.
- The growth investor weighing opportunity cost will likely find the mid-single-digit earnings trajectory too slow to justify the capital.
If you do not have an explicit view on your own required return, resolve that first. Without it, every DCF you read on this stock is noise dressed up as precision. The 9% rate is the standard professional reference point for making the bear case internally consistent, and it is worth understanding why before you dismiss it.
A framework that sets a 15% minimum return hurdle on every position, well above the 8-12% WACC range used in conventional models, would classify McDonald’s as materially overvalued at current prices, illustrating why the choice of required return is not a technical detail but the central value judgment the investor makes before any spreadsheet work begins.
The ambiguity is itself the signal. A stock that can look 40% cheap or 40% expensive on a single assumption is a bet on continued low rates, stable franchise economics, and a resumption of same-store sales growth. Stress-test all three before committing capital.
This article is for informational purposes only and should not be considered financial advice. Investors should conduct their own research and consult with financial professionals before making investment decisions. Past performance does not guarantee future results. Financial projections are subject to market conditions and various risk factors.