Here is one of the strangest-looking facts in global business. In 2025, McDonald’s rang up roughly $139 billion in sales across its restaurants worldwide, yet the company reported only about $27 billion in corporate revenue. That is a gap of more than five to one.
Most people who spot that number assume something is wrong. It looks like an accounting error, a sign of hidden losses, or a company giving away most of its sales somewhere. It is none of those things. That gap is the single clearest expression of how the business is actually built: McDonald’s owns the system, not the restaurants.
Once you understand that distinction, the financial statements stop looking confusing and start looking deliberate. After reading this, you will know which McDonald’s numbers actually matter, which ones mislead you, and why the reported revenue line is probably the least useful figure on the entire income statement for judging how the business is doing.
Why McDonald’s reported revenue is the wrong number to start with
Most of us carry one instinct into any company’s accounts: revenue tells you how big the business is. Bigger revenue, bigger company. With McDonald’s, that instinct actively works against you.
Here are the two numbers side by side for the full year ended 31 December 2025. Systemwide sales, the total rung up across every McDonald’s restaurant on the planet, came in at approximately $139.4 billion. Reported corporate revenue under standard accounting rules (GAAP) was approximately $26.89 billion.
$139.4 billion in systemwide sales. $26.89 billion in reported revenue. The gap is the business model.
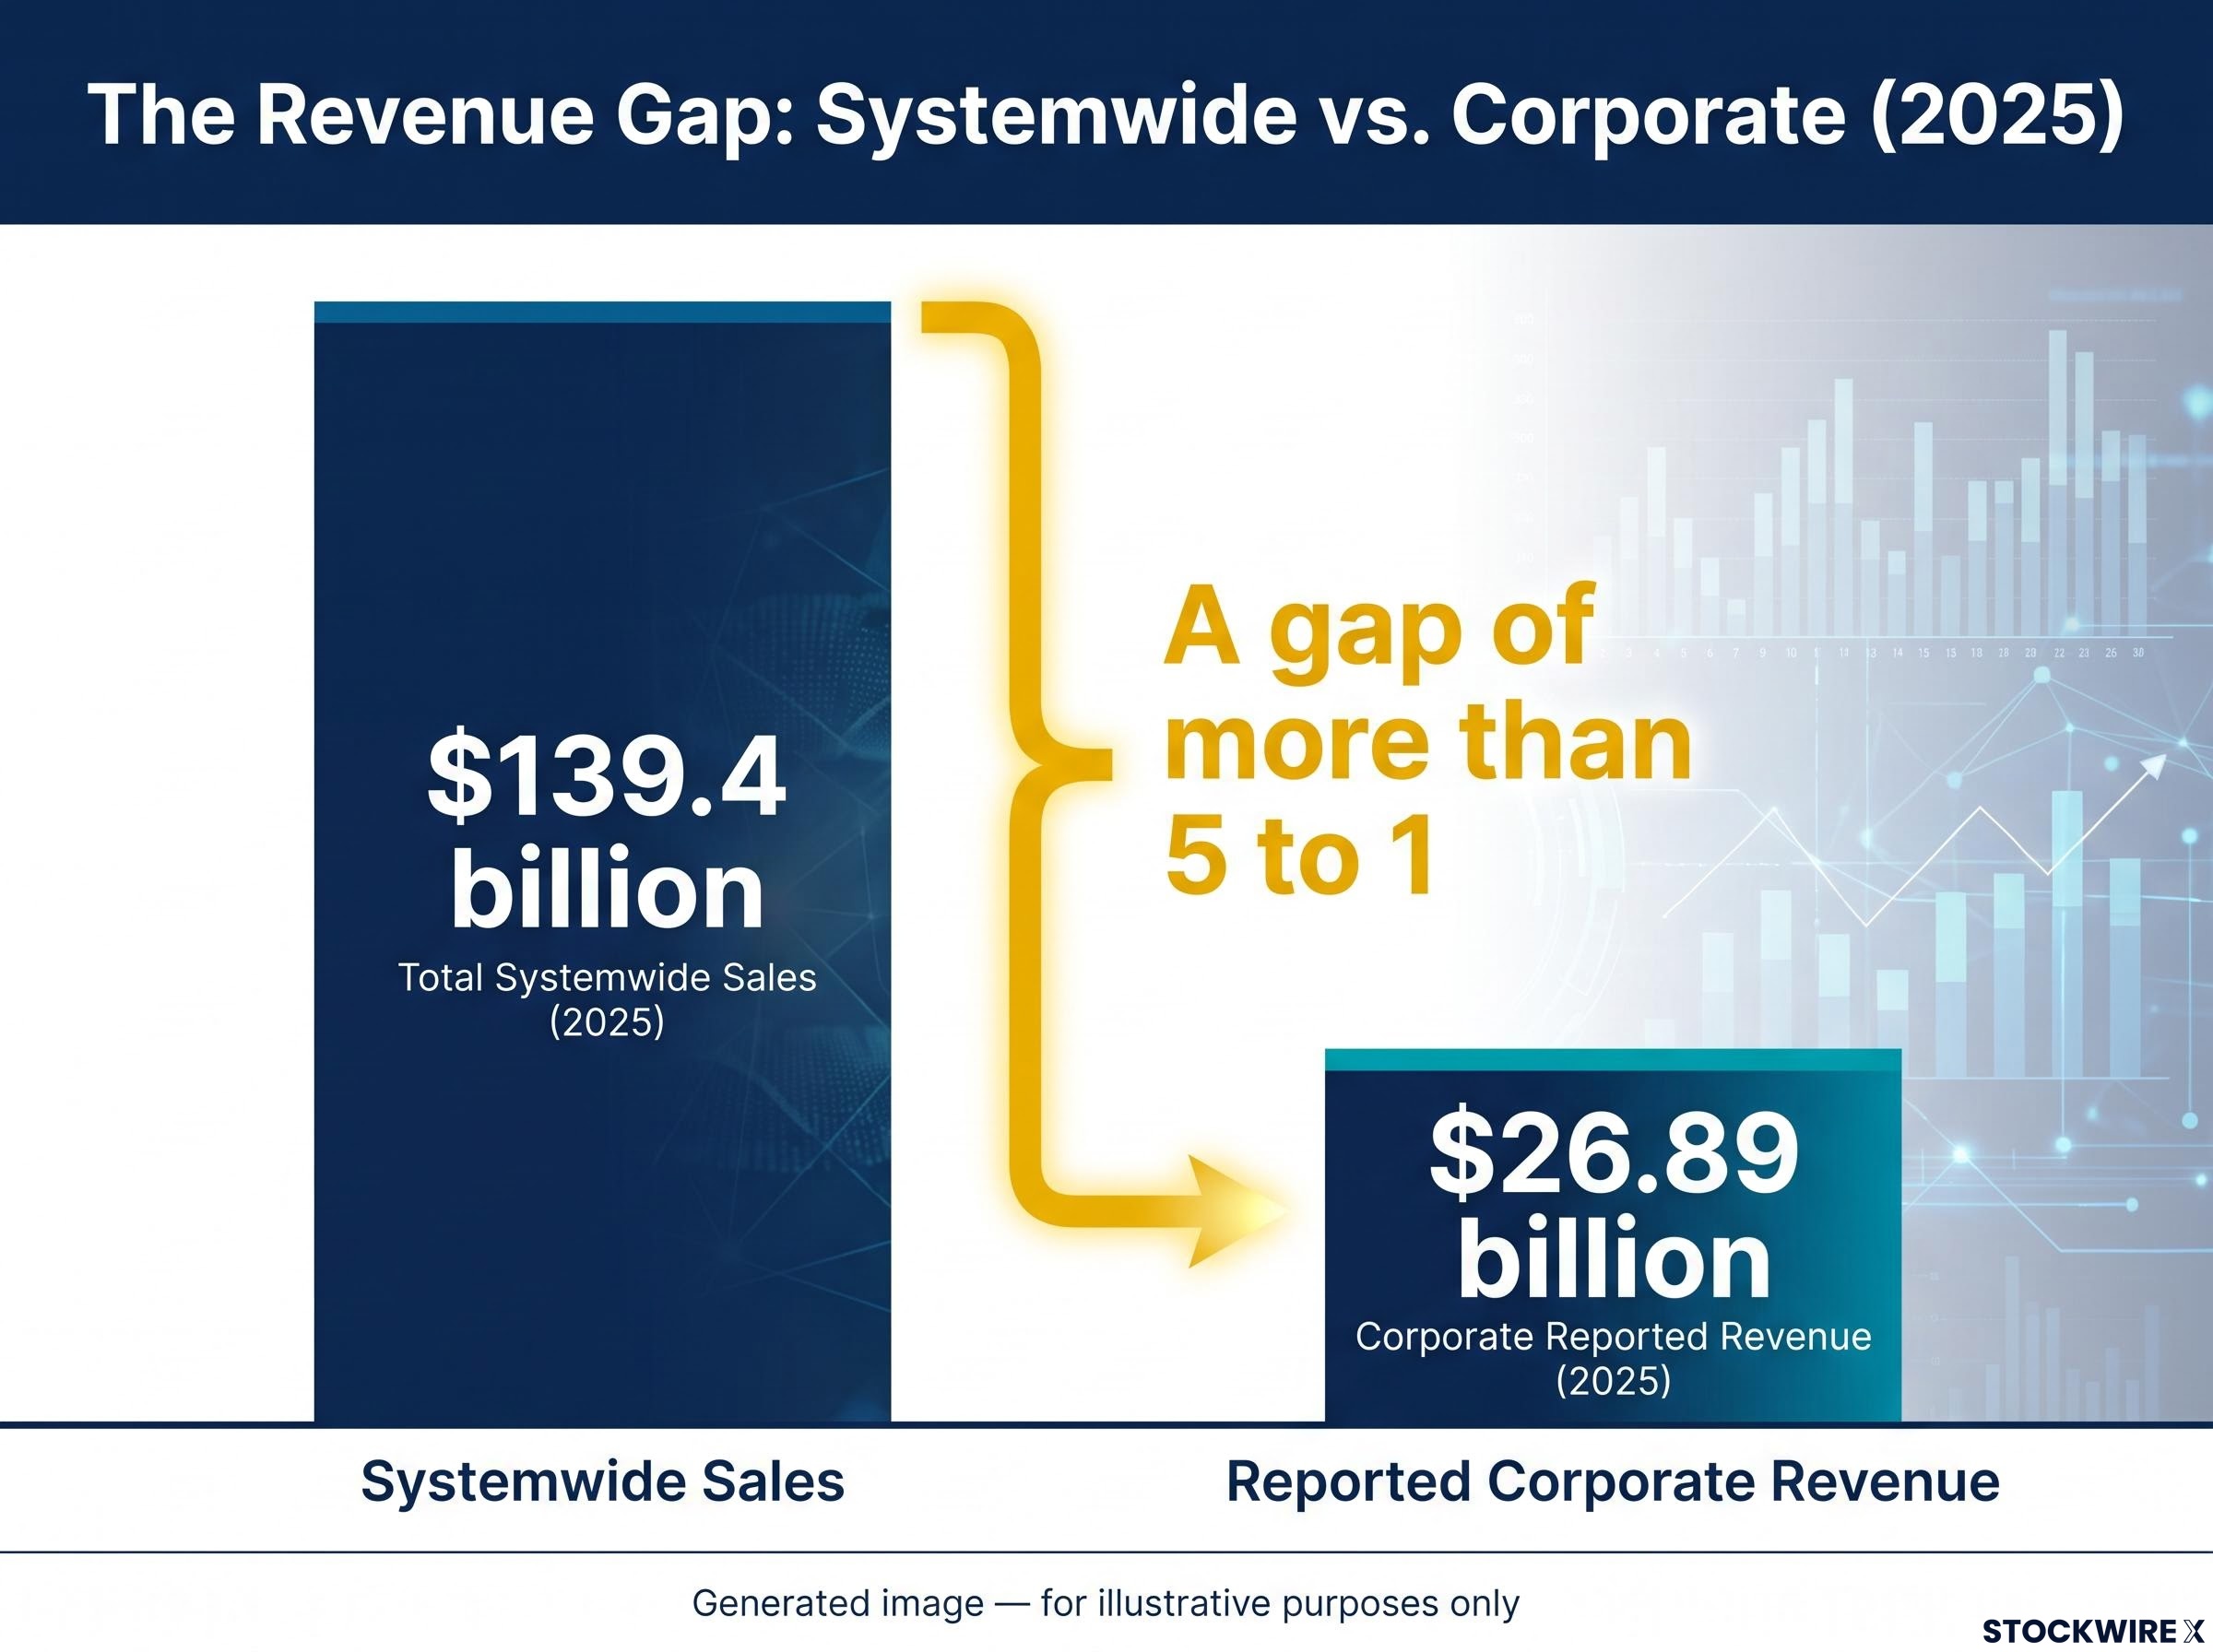
The reason for the gap is structural, not accounting trickery. GAAP revenue only records what actually flows into McDonald’s corporate bank account: royalties, rent, and fees paid by franchisees, plus the full sales from the small pool of restaurants the company runs itself. It does not include the billions in burgers, fries, and drinks sold by franchisees, because that money lands on the franchisees’ books, not McDonald’s.
And nearly every McDonald’s is a franchise. At the end of FY2025, the company had roughly 45,356 restaurants worldwide. Around 43,300 of those, close to 95%, were franchised. Only about 2,000 were company-operated.
So when you look at systemwide sales, you are seeing the true scale of the brand’s consumer footprint. When you look at reported revenue, you are seeing only the thinner stream that McDonald’s corporate collects from that footprint. They measure two different things.
Systemwide sales is what McDonald’s calls a non-GAAP measure, meaning it sits outside the official accounting statements and is used to show brand scale. Understanding what it represents is the entry point to reading the whole business correctly.
Systemwide sales is what McDonald’s calls a non-GAAP measure, meaning it sits outside the official accounting statements, and the SEC guidance on non-GAAP financial measures sets out the disclosure rules public companies must follow when presenting these figures alongside their GAAP results.
The divergence is not a one-off. It has held steadily for years, as the trajectory below shows.
| Fiscal Year | Systemwide Sales | Reported Corporate Revenue |
|---|---|---|
| 2021 | $112.5 billion | Materially below systemwide sales |
| 2025 | $139.4 billion | $26.89 billion |
The takeaway is uncomfortable but important. A single revenue figure on a traditional income statement will mislead anyone trying to gauge McDonald’s real economic size. That roughly five-to-one ratio is not a warning light. It is the model working exactly as designed.
When big ASX news breaks, our subscribers know first
How McDonald’s actually makes money from a restaurant it does not run
If McDonald’s does not book the sales from most of its restaurants, how does it actually get paid? The answer is a set of fees that flow from each franchisee up to corporate, and the arithmetic is more interesting than it first looks.
There are three main ongoing streams. First, a royalty fee of roughly 4-5% of the franchisee’s gross sales each year, paid simply for the right to operate under the McDonald’s system. Second, rent, typically 8-15% of gross sales, charged where McDonald’s owns or leases the underlying property. Third, advertising contributions of around 4% of gross sales, pooled to fund the marketing that keeps customers walking in.
| Fee Type | Basis | Approximate Rate |
|---|---|---|
| Royalty | Franchisee gross sales | 4-5% annually |
| Rent | Franchisee gross sales (where McDonald’s holds the property) | 8-15% |
| Advertising | Franchisee gross sales | Approximately 4% |
Stack those together and a single restaurant becomes far more valuable to McDonald’s than the royalty rate alone suggests. Before an operator collects a single one of these ongoing fees, there is also a one-time upfront charge of $45,000 for new franchisees. Think of that as the entry ticket to a licensed operating system that then carries recurring revenue obligations for years.
Now look closely at what all three streams have in common. Every one is calculated on the franchisee’s gross sales, not the franchisee’s profit.
Fees calculated on sales, not profit, is the mechanism that decouples McDonald’s corporate income from franchisee cost risk.
This is the structural point that most casual observers miss, and it changes everything about how you should read the business. When a franchisee’s costs climb, whether it is wages, beef prices, or the electricity bill, McDonald’s corporate income from that restaurant does not budge. As long as the tills keep ringing, corporate keeps collecting its percentage of the top line.
That is a deliberate risk allocation decision. The variability in day-to-day operating costs sits with the franchisee, while McDonald’s locks in a stable, revenue-linked cut.
Franchisee economics are the variable that corporate margins alone cannot capture: Domino’s FY26 results illustrate this directly, with average franchisee EBITDA rising 11.3% to $105.7k even as network sales fell, because cost savings were passed through to franchise partners rather than retained at the corporate level.
For you as an investor, this is why McDonald’s corporate earnings are structurally more resilient than those of a conventional restaurant operator. When food or labour costs spike across the whole industry, a company running its own kitchens absorbs that hit directly. McDonald’s corporate, collecting fees on sales rather than profit, is largely shielded from it.
What the 2017 refranchising push actually did to McDonald’s financials
Here is a corporate decision that looks like a mistake until you see the full picture. Around 2017, McDonald’s deliberately shrank its own reported revenue. On purpose. And it was one of the smartest moves the company made.
How reported revenue changed when McDonald’s refranchised
Before the shift, McDonald’s ran roughly 6,000 company-operated restaurants itself. Over the following years, it sold most of those locations to franchisees, cutting the company-operated count to around 2,000 by FY2025.
Every restaurant handed to a franchisee took its full restaurant sales off McDonald’s income statement, because those sales now belonged on the franchisee’s books. Predictably, reported corporate revenue dipped at the time.
But that revenue decline was a feature, not a fault. In place of the full restaurant sales, each transferred location left behind high-margin royalty and rent income. McDonald’s swapped a large, low-quality revenue line for a smaller, far more profitable one.
What the margin data shows about the trade-off
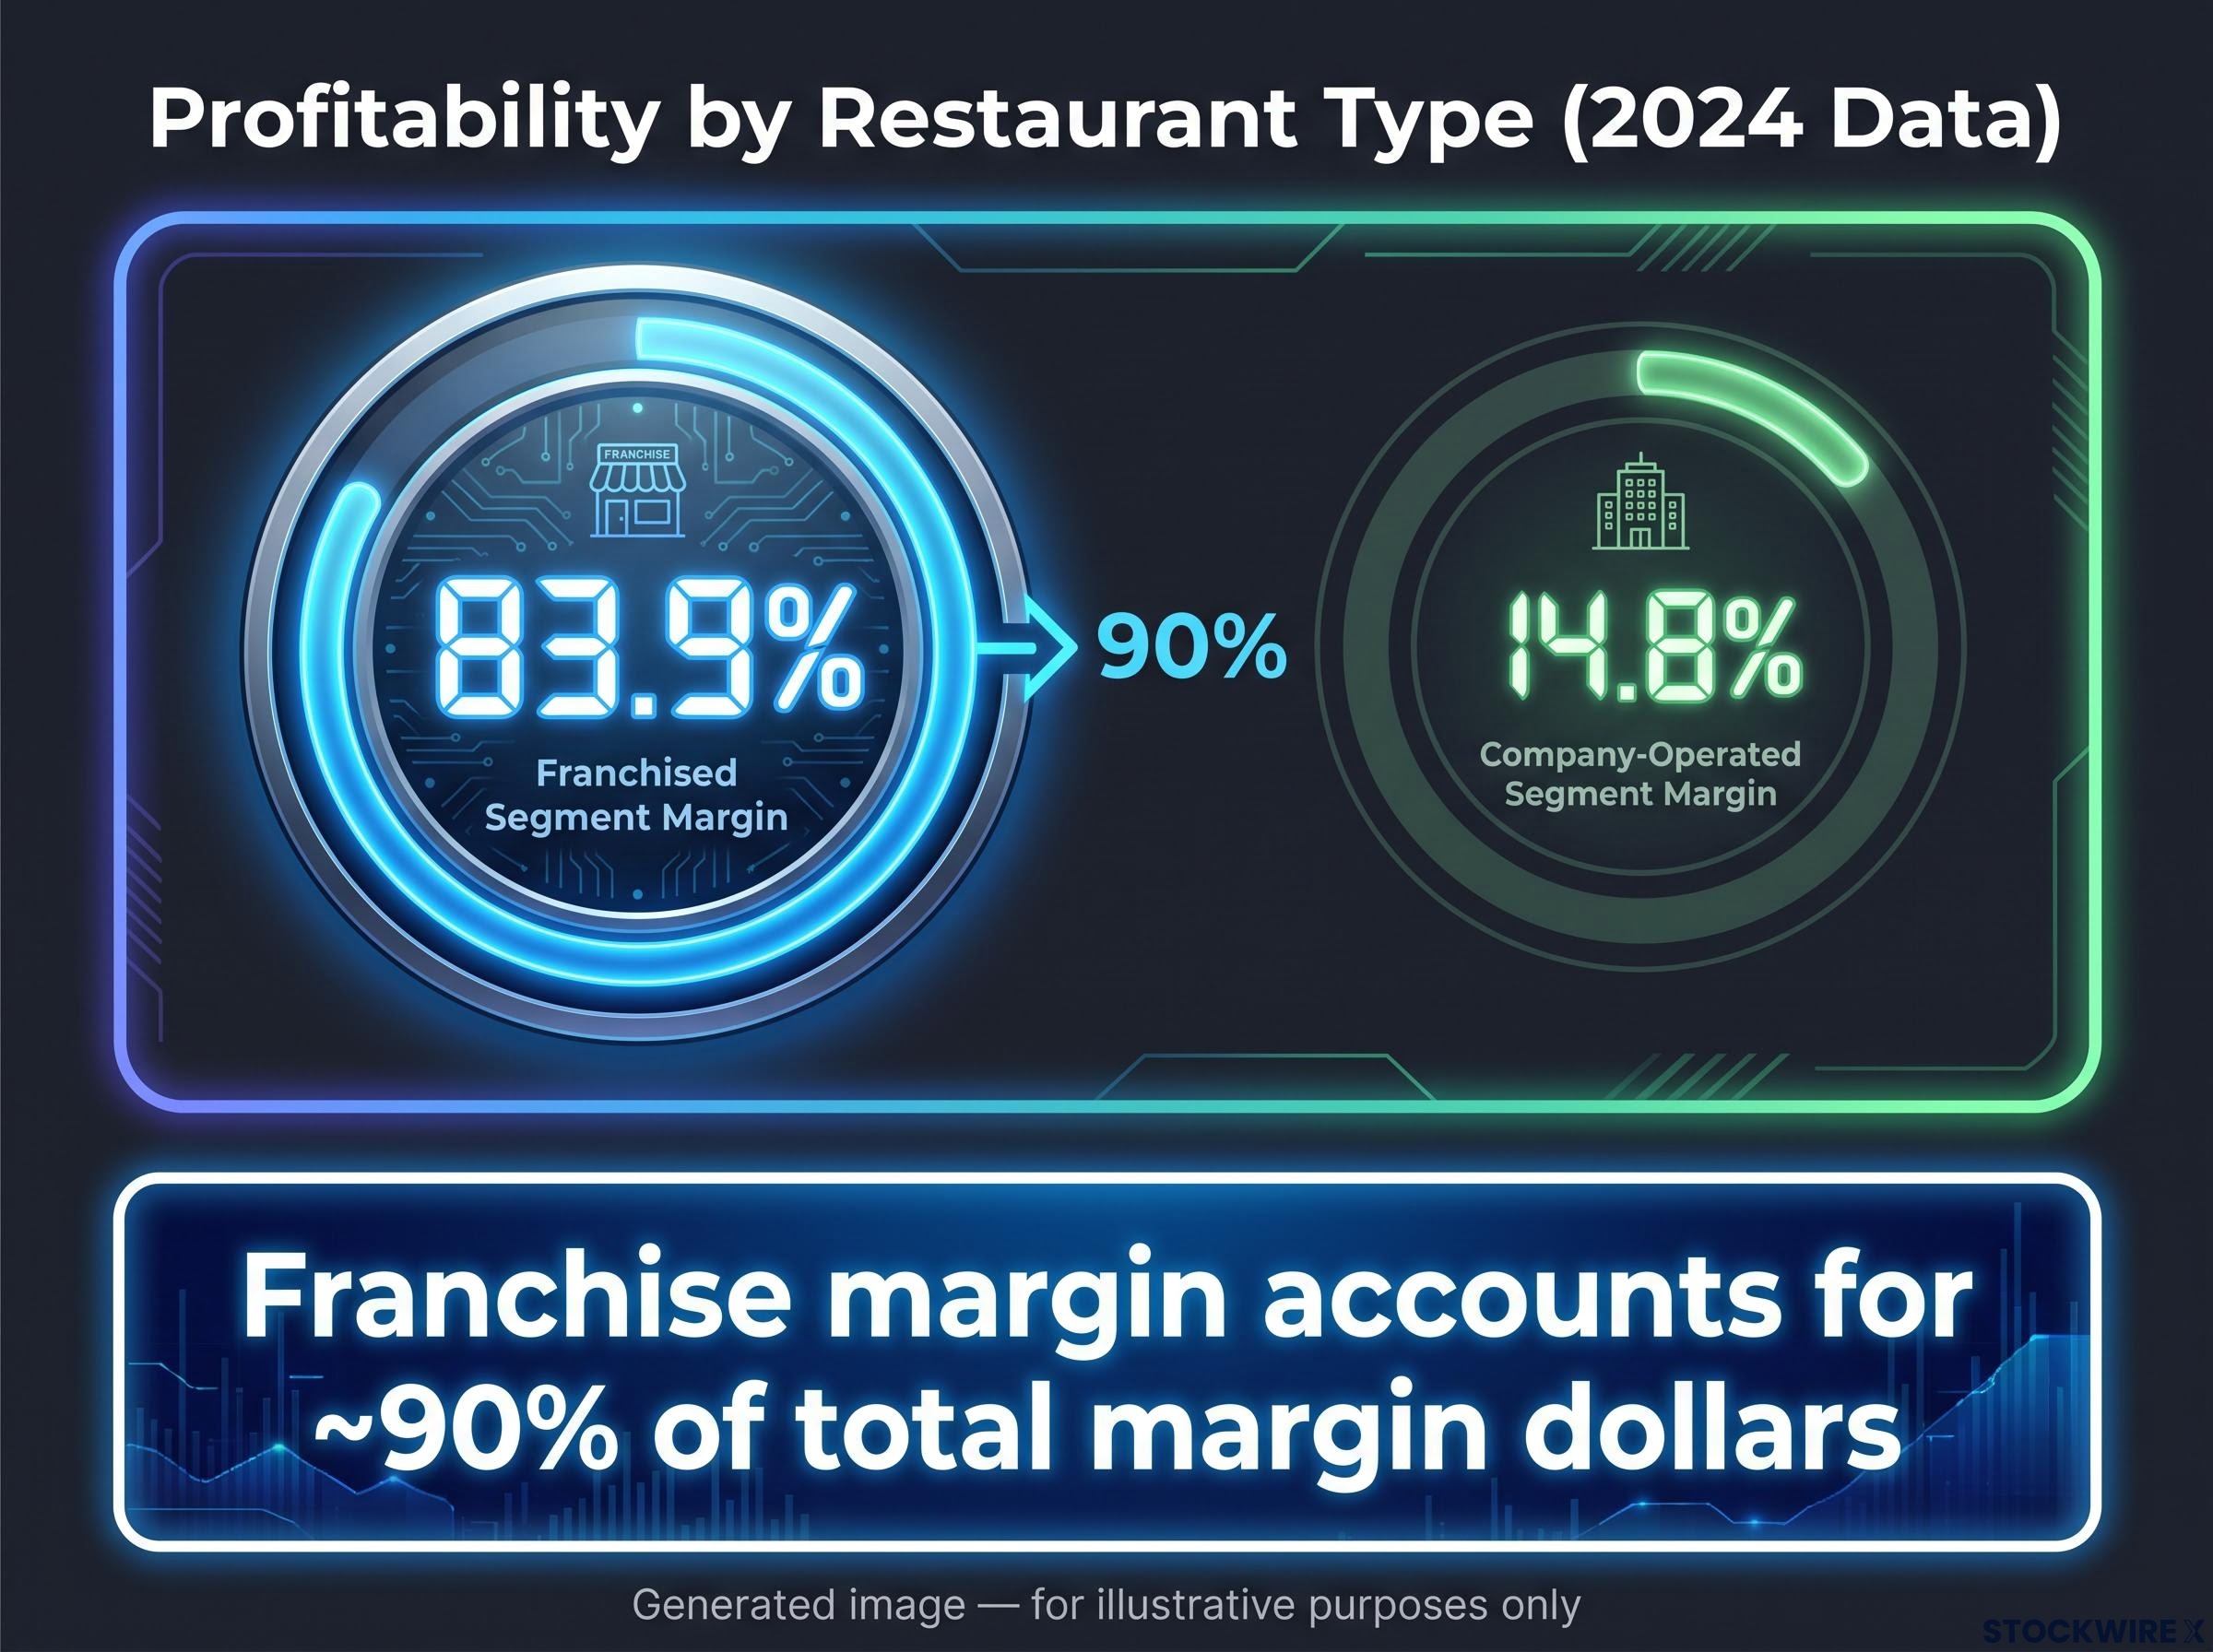
The reason this trade made sense is written into the margin data. Consider the profitability of the two types of restaurant, based on 2024 segment figures disclosed in McDonald’s Investor Overview Deck dated 2 December 2025:
- Franchised segment margin: 83.9%
- Company-operated (McOpCo) segment margin: 14.8%
- FY2025 consolidated operating margin: approximately 46.1%
The accounting reason for that enormous gap is straightforward. A franchised restaurant carries only occupancy and depreciation costs on McDonald’s books. A company-operated restaurant carries the food, the payroll, the utilities, and every other operating cost in full.
So a dollar of franchised revenue keeps far more of itself than a dollar of company-operated revenue. By moving thousands of restaurants from the low-margin column to the high-margin column, McDonald’s improved the quality of every dollar that stayed on its statements.
The result by FY2025 speaks for itself. With around 95% of locations franchised, the business generated a consolidated operating margin of roughly 46.1% on $26.89 billion of revenue and about $12.39 billion in operating income. Franchise margin accounted for approximately 90% of total margin dollars.
That level of profitability would be structurally impossible if McDonald’s were still running 6,000 restaurants itself. So the lesson for you is worth holding onto: a company reporting lower revenue after a restructuring is not automatically a red flag. In McDonald’s case, the revenue that disappeared was exactly the revenue worth losing.
Which numbers actually tell you how the McDonald’s business is performing
If reported revenue understates the real business by roughly a factor of five, you need a different set of gauges. Analysts and investors who follow McDonald’s closely consistently lean on a handful of metrics instead of the headline revenue line, and each one tells you something the revenue figure hides.
- Systemwide sales growth. This is the total sales across every restaurant, the true measure of consumer demand for the brand. It grew from $112.5 billion in 2021 to $139.4 billion in 2025, roughly 7% year-on-year growth in FY2025.
- Comparable sales. This strips out new-restaurant openings to show whether existing restaurants are selling more, which is the cleanest read on underlying brand health.
- Franchised segment margin. At 83.9% on 2024 data, this shows where the profit is actually generated and whether that profitability is holding up.
- Free cash flow. FY2025 free cash flow of approximately $7.19 billion shows how much genuine cash the model throws off after investment, which matters more than accounting revenue.
- Return on invested capital (ROIC). Estimated in the high-teens for FY2025, this measures how efficiently McDonald’s turns the capital it deploys into profit, and it is where the capital-light model really shows its hand.
Comparable sales are also the central metric in Starbucks’ turnaround story, where new CEO Brian Niccol’s strategy is being tracked primarily through same-store performance rather than headline revenue growth, reinforcing why the metric is broadly preferred by analysts over reported top-line figures when assessing branded consumer chains.
McDonald’s ROIC in the high-teens on a capital-light model with 95% franchised locations tells a different story than the revenue line alone.
Put those together and you can see why the metrics matter more than the headline. FY2025 net income landed at roughly $8.56 billion, and franchise margin made up about 90% of total margin dollars. That concentration tells you the earnings profile is driven almost entirely by the franchised system, not the small pool of company-run restaurants.
The systemwide sales trajectory is the clearest example of why revenue alone deceives you. Corporate revenue growth can look modest while the brand’s actual sales volume is expanding briskly, because the two numbers move for different reasons.
So the real question is not “did McDonald’s revenue increase?” For this business, that is close to the wrong question. The question that captures the actual economics is: did systemwide sales and comparable sales grow, and is the franchised margin holding? Answer those two, and you know how McDonald’s is genuinely performing.
What the franchise architecture means for investors who want to evaluate McDonald’s properly
You now have the tools to read McDonald’s for what it is. Three structural pillars hold the whole model up, and together they explain nearly every number that looked strange at the start.
The first pillar is the gap between reported revenue and systemwide sales, which exists because McDonald’s books only fees, not restaurant sales. The second is the fee-on-sales architecture, which insulates corporate income from franchisee cost pressure. The third is the margin transformation from the 2017 refranchising push, which lifted the whole business to a 46.1% operating margin and roughly $7.19 billion in free cash flow.
There is a genuine tension worth acknowledging. The very features that make McDonald’s corporate financials so attractive, fees charged on sales regardless of whether the franchisee is making money, concentrate operating cost risk onto franchisees. If you want to track the long-run health of the system, franchisee economics deserve your attention alongside corporate margins.
Franchise network health can diverge sharply from corporate profit figures: Retail Food Group’s FY26 results show a 20.9% half-on-half EBITDA surge at the corporate level while individual brands like Gloria Jean’s and Crust were still in recovery mode, illustrating why monitoring brand-level and franchisee-level data matters alongside consolidated margins.
Here is the mental upgrade to carry with you:
- Most people look at reported revenue as a measure of size. Look instead at systemwide sales, which reveals the brand’s true scale.
- Most people look at revenue growth to judge momentum. Look instead at comparable sales and systemwide sales growth.
- Most people look at McDonald’s as a restaurant company. Look instead at a brand licensor with a real-estate income stream attached.
That last reframe is the one that matters most. With 95% of locations franchised and franchise margin driving around 90% of total margin dollars, McDonald’s earnings are determined by the health of the franchised system, not by the handful of restaurants it runs itself. Apply a restaurant-company lens, revenue-centric and operations-centric, and you will reach the wrong conclusions almost every time. Apply the franchise-economics lens, and the numbers finally make sense.
The asset-light label is not always as clean as it sounds: Dan Loeb’s structural short thesis on homebuilders argues that option contracts with non-refundable deposits and mandatory take-down schedules create fixed-like capital obligations that the label obscures, a dynamic that applies broadly when evaluating any business model marketed as capital-light.
This article is for informational purposes only and should not be considered financial advice. Investors should conduct their own research and consult with financial professionals before making investment decisions. Past performance does not guarantee future results, and financial projections are subject to market conditions and various risk factors.