For decades, one relationship in fixed-income markets held with near-mechanical reliability: when crude oil rose, inflation expectations rose with it. In early July 2026, that relationship broke. Oil climbed, and yet 5-year and 10-year breakeven inflation rates fell to their lowest readings of the year.
The answer to that anomaly does not sit in energy markets. It sits in the US Treasury Department’s expanded bond buyback programme, which has doubled the maximum size of its long-end operations to at least $4 billion each, with the first operation announced at $6 billion. Secretary Scott Bessent’s yield management campaign has quietly become the dominant force shaping how the market reads inflation.
This is a live experiment in Treasury-driven yield control, and understanding it changes which market signals deserve your attention. After this piece, you will know why the old commodity-to-breakeven heuristic has stopped working, which auction and curve data now carry the real information, and what to watch as the programme enters its critical test.
How the Treasury’s buyback expansion actually works
Start with the mechanics, because the whole strategy turns on a single move that is easy to miss.
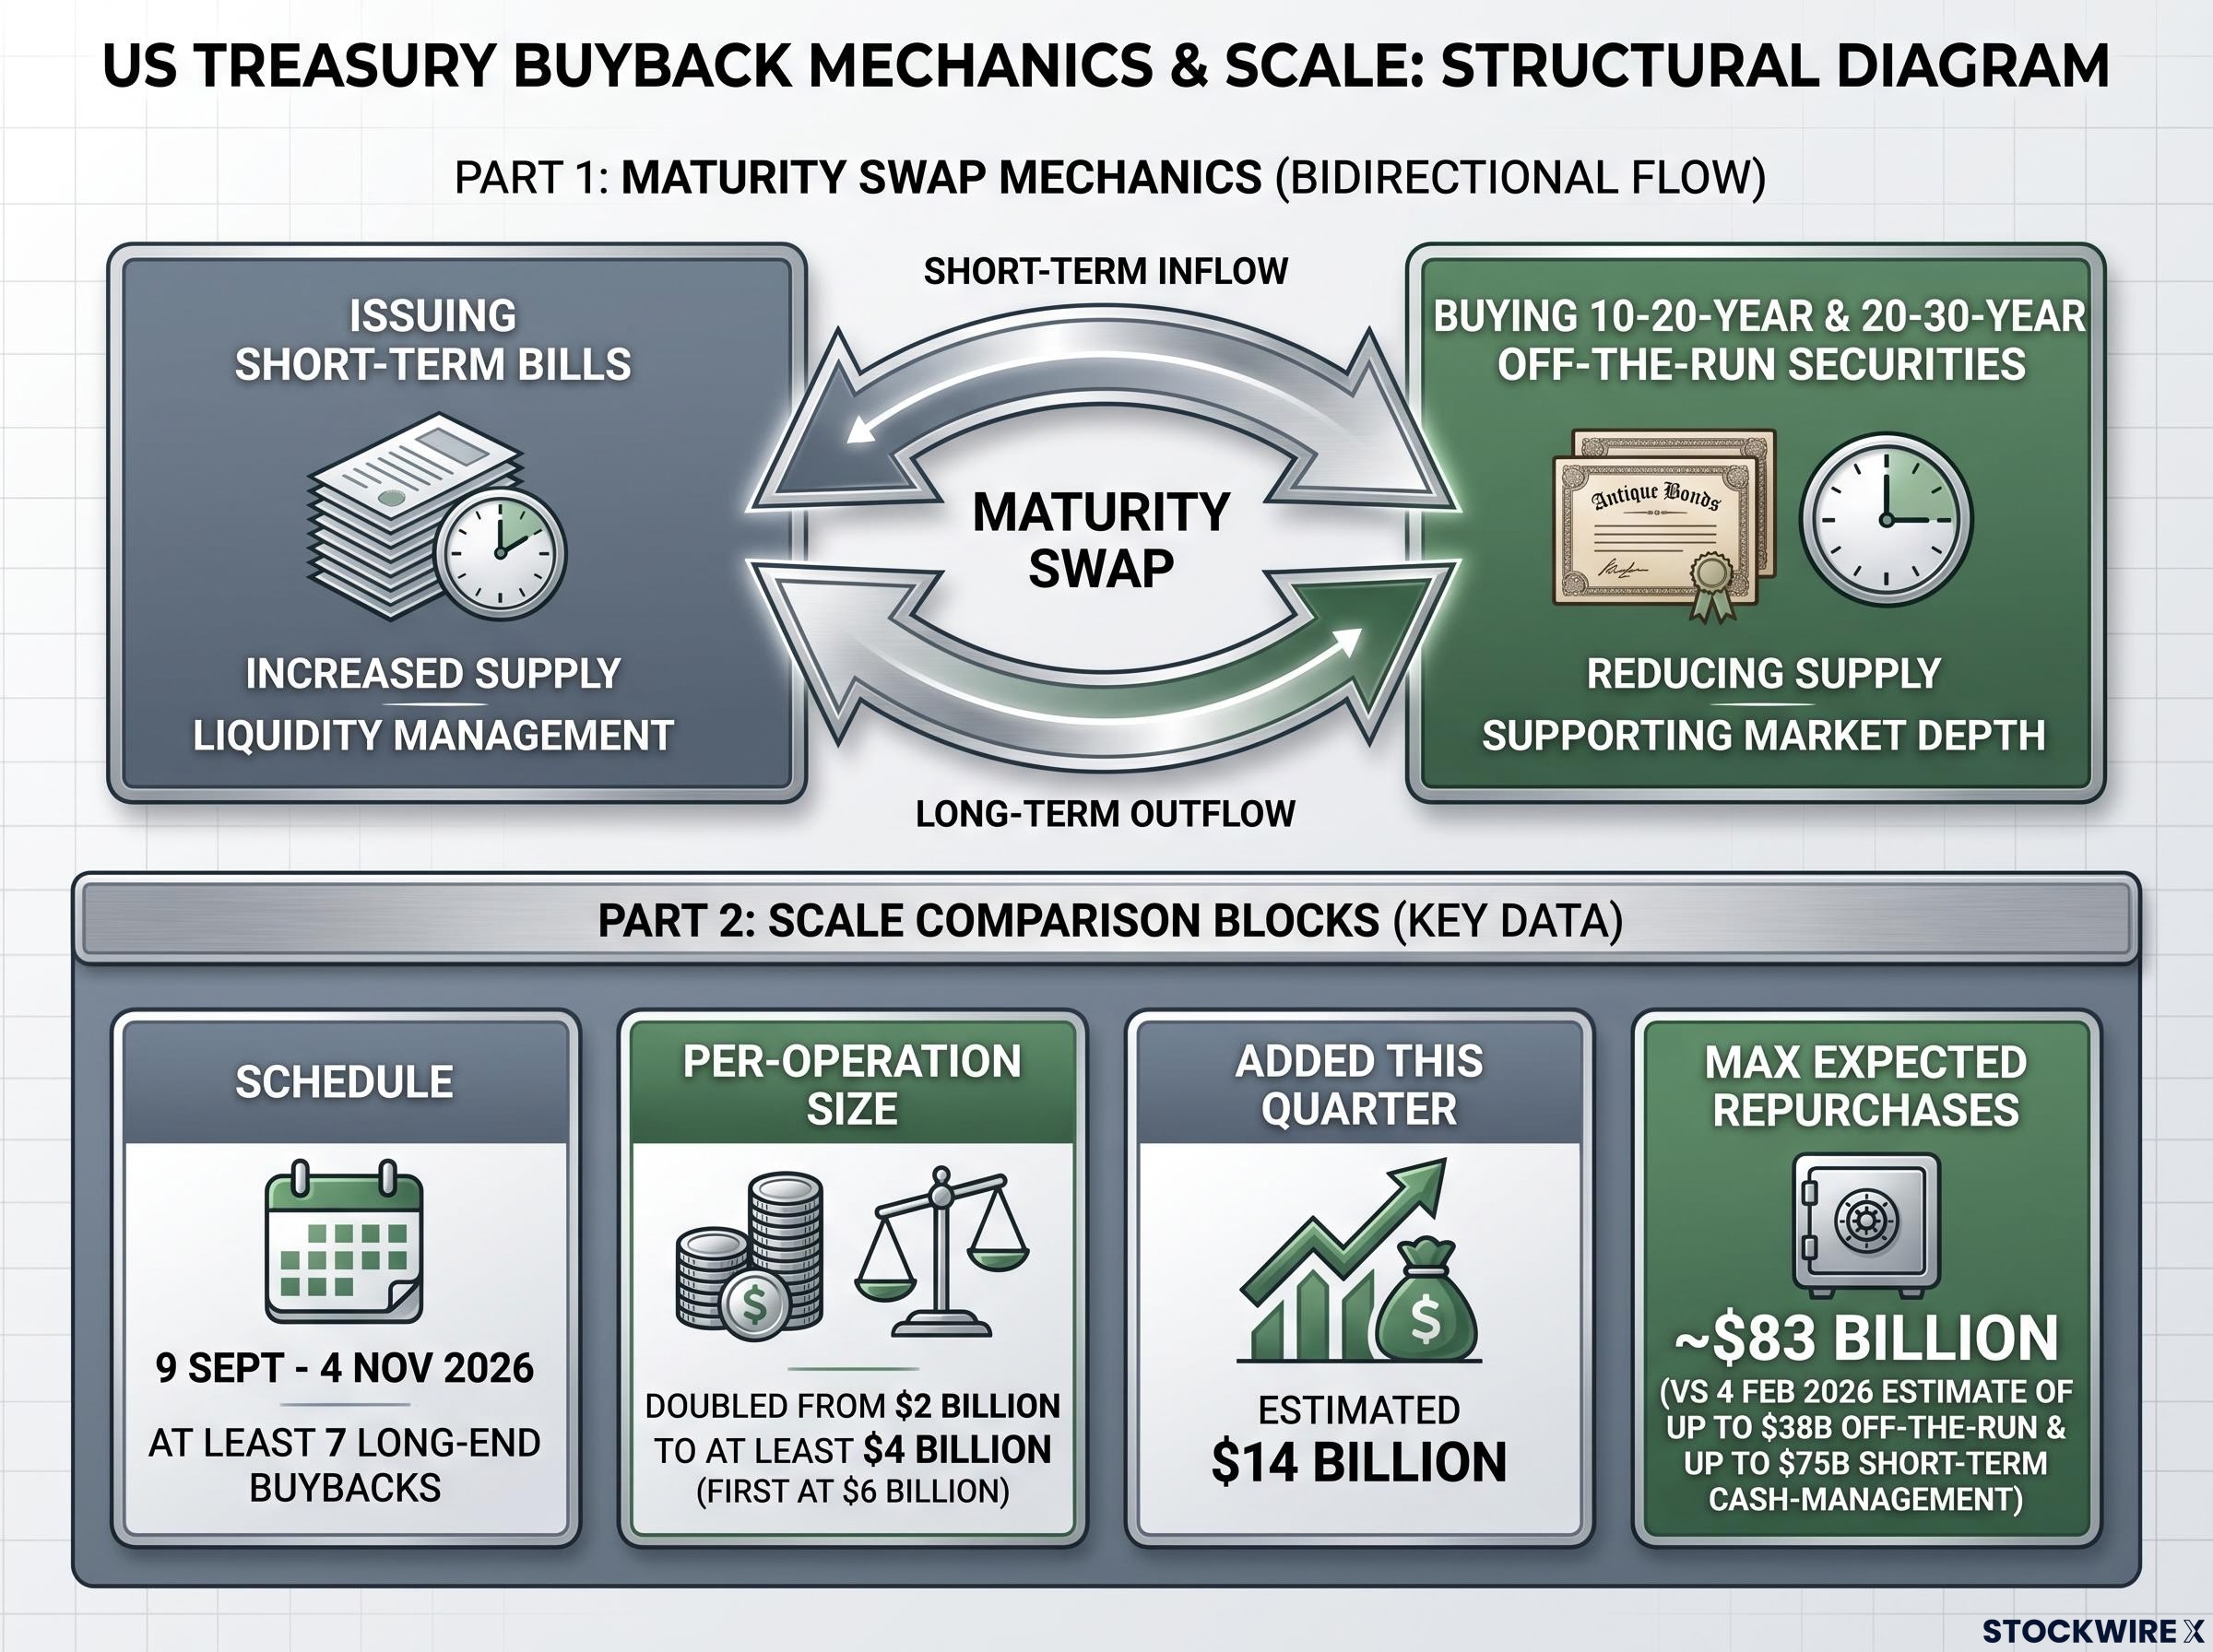
The Treasury buys back off-the-run long-dated nominal coupon securities, meaning older 10-to-30-year bonds that trade less actively. It funds those purchases by issuing short-term bills. That is a maturity swap: long-term debt retired, short-term debt created in its place.
The effect is twofold. Long-end yields get compressed as the government soaks up supply at the far end of the curve, while the short end absorbs a wave of new bill issuance.
The schedule now in effect runs from 9 September through 4 November 2026, covering the 10-20-year and 20-30-year sectors, with at least seven long-end buybacks planned for the quarter. The maximum per-operation size was doubled from $2 billion to at least $4 billion, and the first operation came in at $6 billion, validating Bessent’s remark that operations could exceed the headline figure.
The Treasury’s official buyback announcement confirms that the maximum per-operation size increase to at least $4 billion applies specifically to nominal long-end liquidity support operations, with the stated rationale being improved functioning in longer-dated sectors rather than explicit yield targeting.
On CNBC, Bessent indicated the operations “could be more than the $4 billion per issue” depending on market conditions.
The scale-up adds an estimated $14 billion in long-bond buybacks this quarter, lifting maximum expected repurchases to roughly $83 billion. For context, the 4 February 2026 Quarterly Refunding Statement had anticipated up to $38 billion in off-the-run purchases for liquidity support, alongside up to $75 billion in short-term cash-management purchases.
Here is the interpretive point. This is not money printing, and it is not a central-bank balance sheet expanding. The Treasury cannot create reserves. What it is doing is deliberately shifting interest-rate risk onto the short end of the curve. That is a choice with direct consequences for anyone holding or evaluating rate-sensitive assets, because it changes where the risk in the debt structure actually lives.
The TGA funding source matters enormously for how easing effects transmit: TGA-funded buybacks inject reserves and reduce long-duration supply simultaneously, while bill-funded buybacks are a duration swap with no net cash injection, a distinction that Deutsche Bank, Goldman Sachs, Wells Fargo, and ING all identify as the binding constraint on the programme’s monetary reach.
The official framing calls this liquidity support: improving market functioning and narrowing bid-ask spreads on hard-to-trade issues. Critics, including economist James Broughel, argue the expansion is designed to curb rising rates outright. The mechanics support both readings at once, which is precisely why it works as a signal.
The Treasury bond buyback programme has been running continuously since May 2024, with 85 operations purchasing $228.3 billion in par value after receiving over $1 trillion in offers, a track record that frames the 2026 expansion as an acceleration of routine practice rather than emergency intervention.
How this compares to QE and Operation Twist
Placing the programme against its predecessors sharpens what is genuinely new about it.
| Operation Type | Funding Source | Primary Yield Curve Effect |
|---|---|---|
| Fed QE (LSAPs, post-2008) | Central-bank reserve creation | Compresses term premiums via balance-sheet expansion |
| Operation Twist (1960s, 2011-2012) | Reserve-neutral asset swap by the Fed | Flattens curve by selling short, buying long |
| Treasury Buyback (2026) | Short-term bill issuance (fiscally funded) | Compresses long end, expands short-end supply |
Post-2008 quantitative easing relied on the Fed expanding its balance sheet. The current programme is fiscally funded, which introduces rollover risk that QE never carried. Operation Twist is the closer mechanical cousin, a maturity-targeted swap, but the Fed executed it without shortening the government’s debt profile. The Bank of Japan’s yield-curve control stands as the cautionary case: formalised yield caps can anchor rates for a time, but they invite market dysfunction and painful exits.
When big ASX news breaks, our subscribers know first
What the auction results reveal about market confidence
If the mechanics tell you what the Treasury is attempting, the auctions tell you whether the market is buying it.
Work through the year in sequence. The 8 April 2026 10-year auction, a $39 billion offering, cleared at a high yield of 4.282% with a bid-to-cover ratio of 2.43x, solid but unremarkable. The bid-to-cover ratio measures total bids received against the amount on offer, so a higher number signals stronger demand.
June held steady: a $39 billion offering with bid-to-cover of 2.57x. Then 12 August 2026 brought a $42 billion offering at a high yield of 4.683%, bid-to-cover of 2.53x, with primary dealers absorbing 6.8% and indirect bidders taking 61.0%.
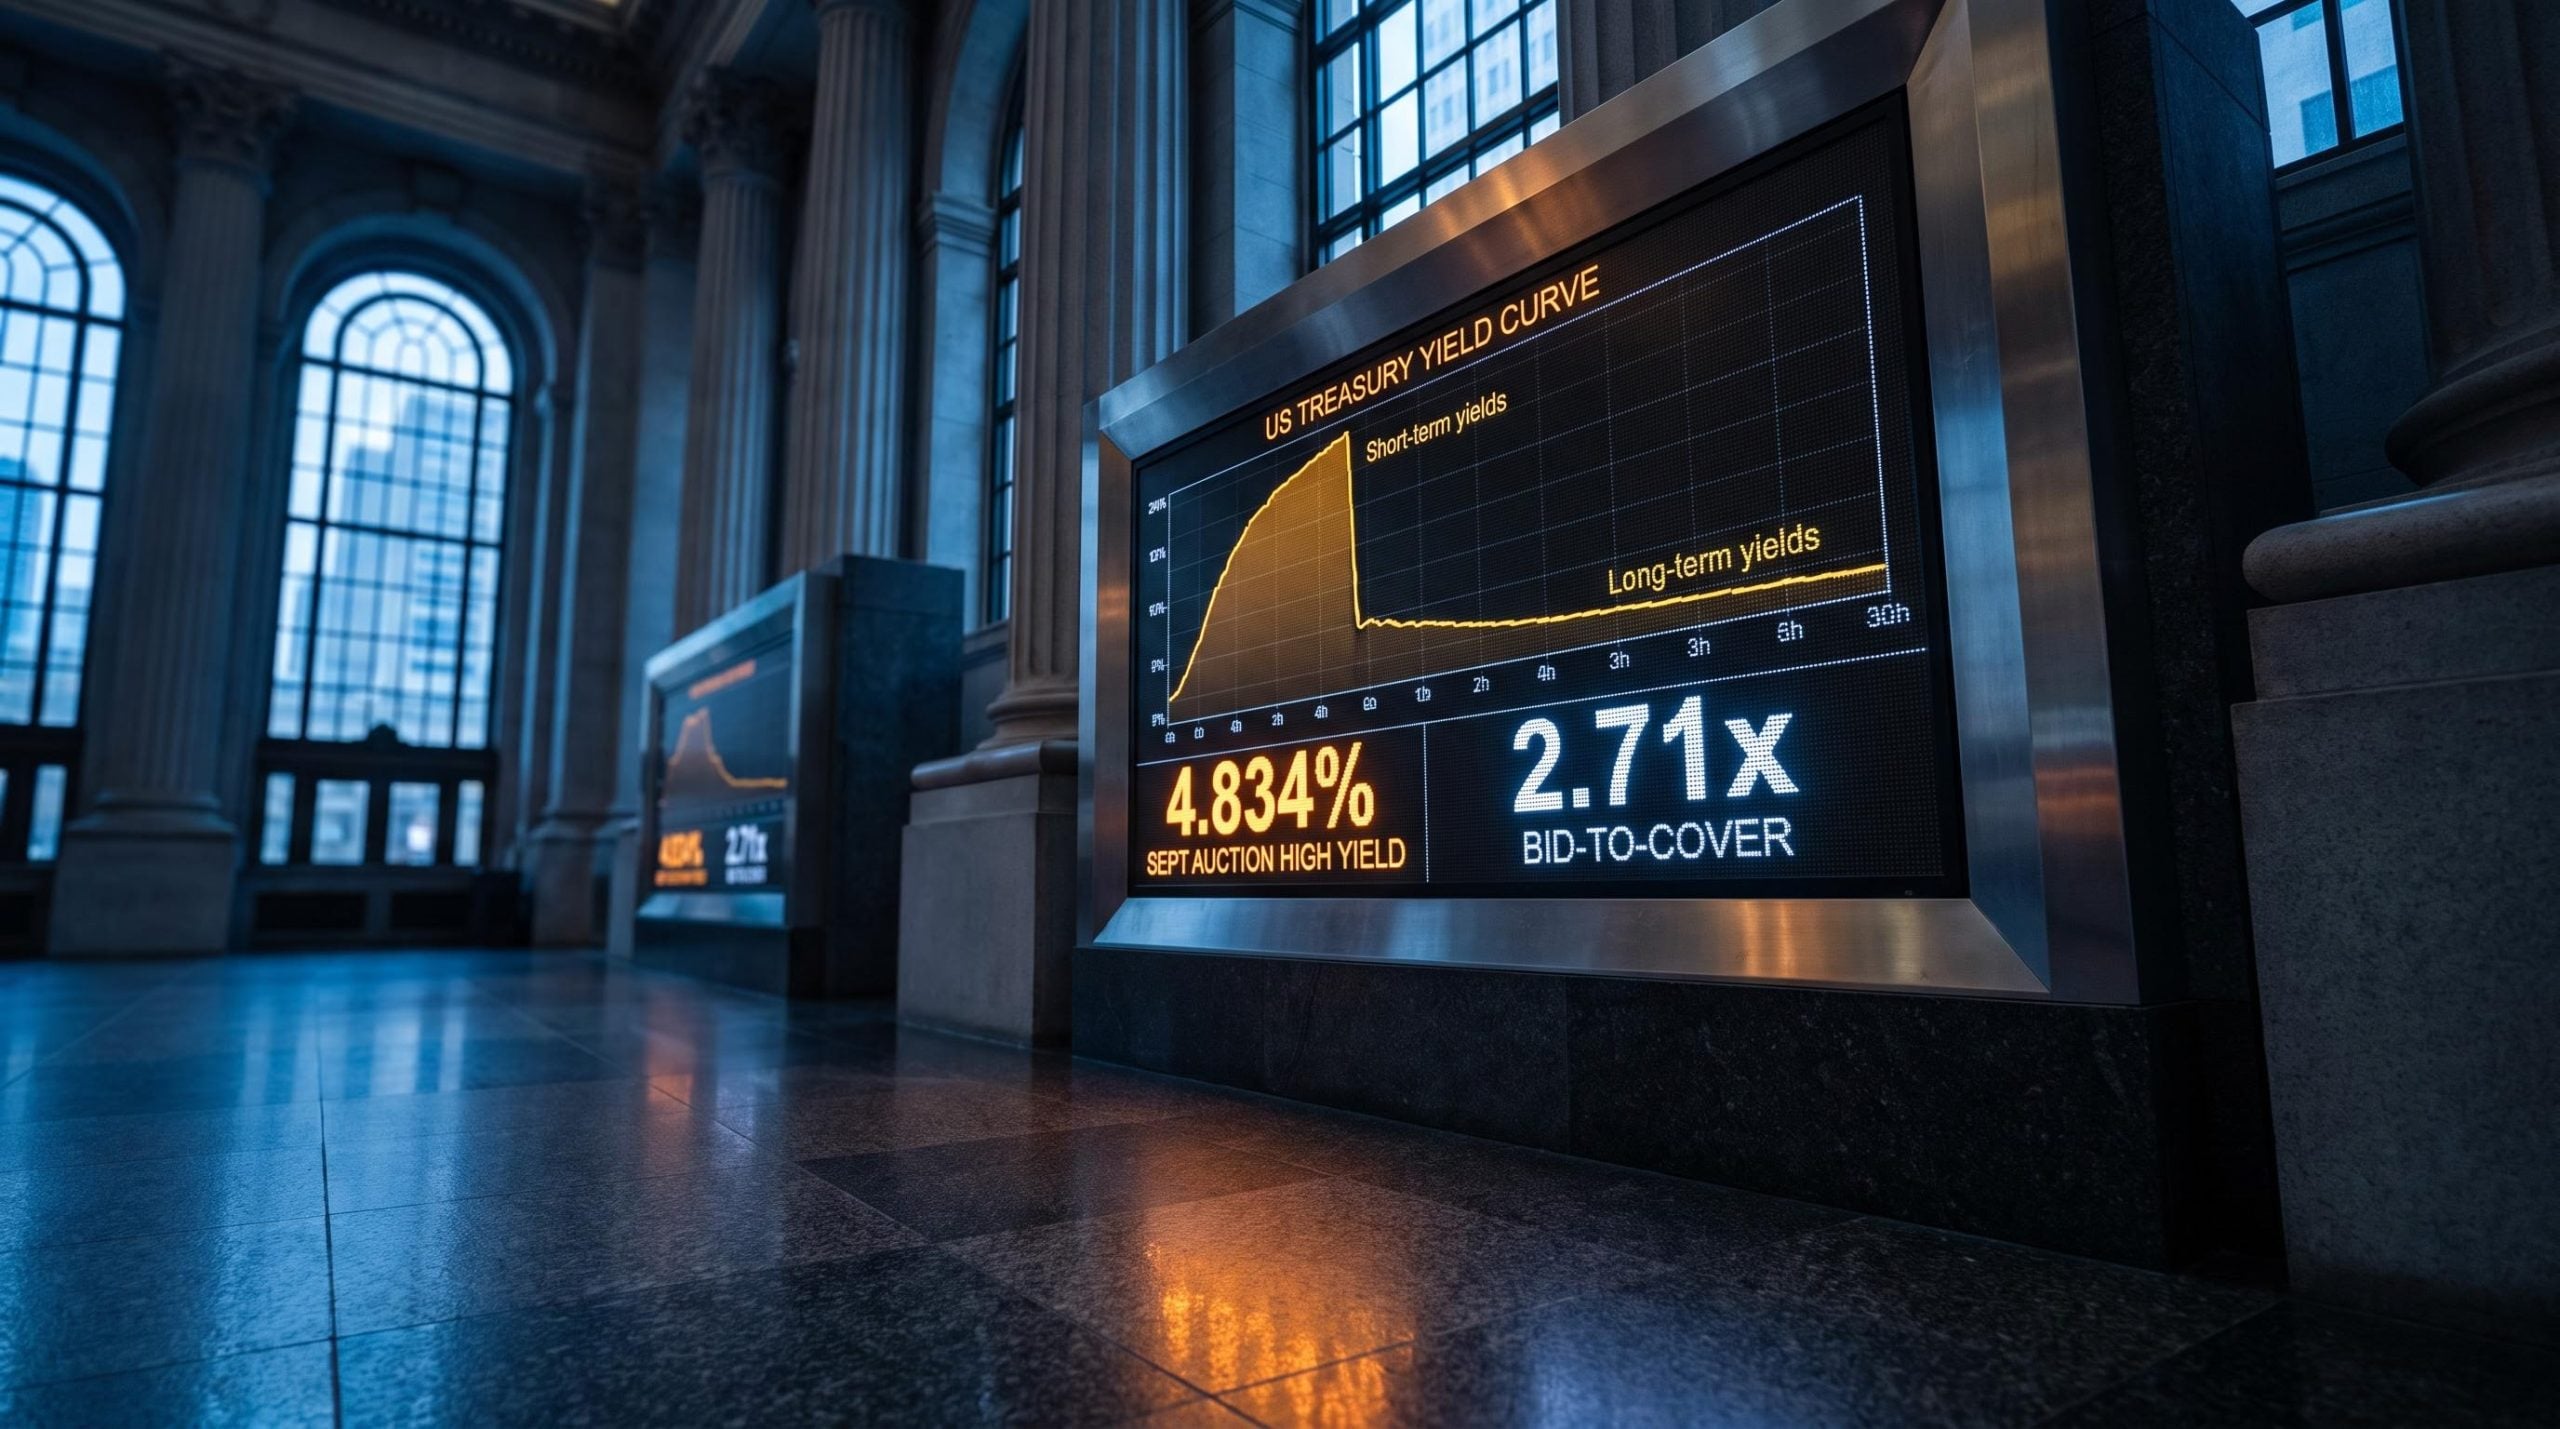
Now the centrepiece. On 9 September 2026, the 10-year auction cleared at a high yield of 4.834%, the highest since 2007. A high yield that steep might suggest weak demand. The opposite happened.
| Auction Date | Offering Size | High Yield | Bid-to-Cover | Dealer Share (%) |
|---|---|---|---|---|
| 8 April 2026 | $39B | 4.282% | 2.43x | Not disclosed |
| 10 June 2026 | $39B | Not disclosed | 2.57x | Not disclosed |
| 12 August 2026 | $42B | 4.683% | 2.53x | 6.8% |
| 9 September 2026 | $42B | 4.834% | 2.71x | 4.3% |
The September auction posted a bid-to-cover of 2.71x, well above the roughly 2.5x average. Direct and indirect bidders took 96%, leaving primary dealers with just 4.3%, their smallest allocation in about a year. The auction stopped through, meaning it cleared at a lower yield than the pre-auction market implied, so the government paid less interest than expected.
That 4.3% dealer share is the tell. Dealers are the buyers of last resort; when they are left holding almost nothing, it means genuine end-demand from institutions cleared the sale. Those are the participants who move the market, and they are treating the yield floor as credible rather than aspirational.
The next data point arrives quickly. A $22 billion 30-year bond sale is scheduled for the Thursday following 9 September, which will show whether long-end confidence extends to the very far end of the curve or stops at the 10-year.
Why breakeven inflation rates stopped following crude oil
For as long as most fixed-income desks can remember, breakeven inflation rates tracked crude oil. A breakeven rate is the gap between a nominal Treasury yield and an inflation-protected one, so it captures what the market expects inflation to average over that horizon. When oil rose, expected inflation rose. The correlation was dependable enough to serve as a working proxy.
That prior regime is what makes July 2026 so striking.
What broke in July and pivoted in August
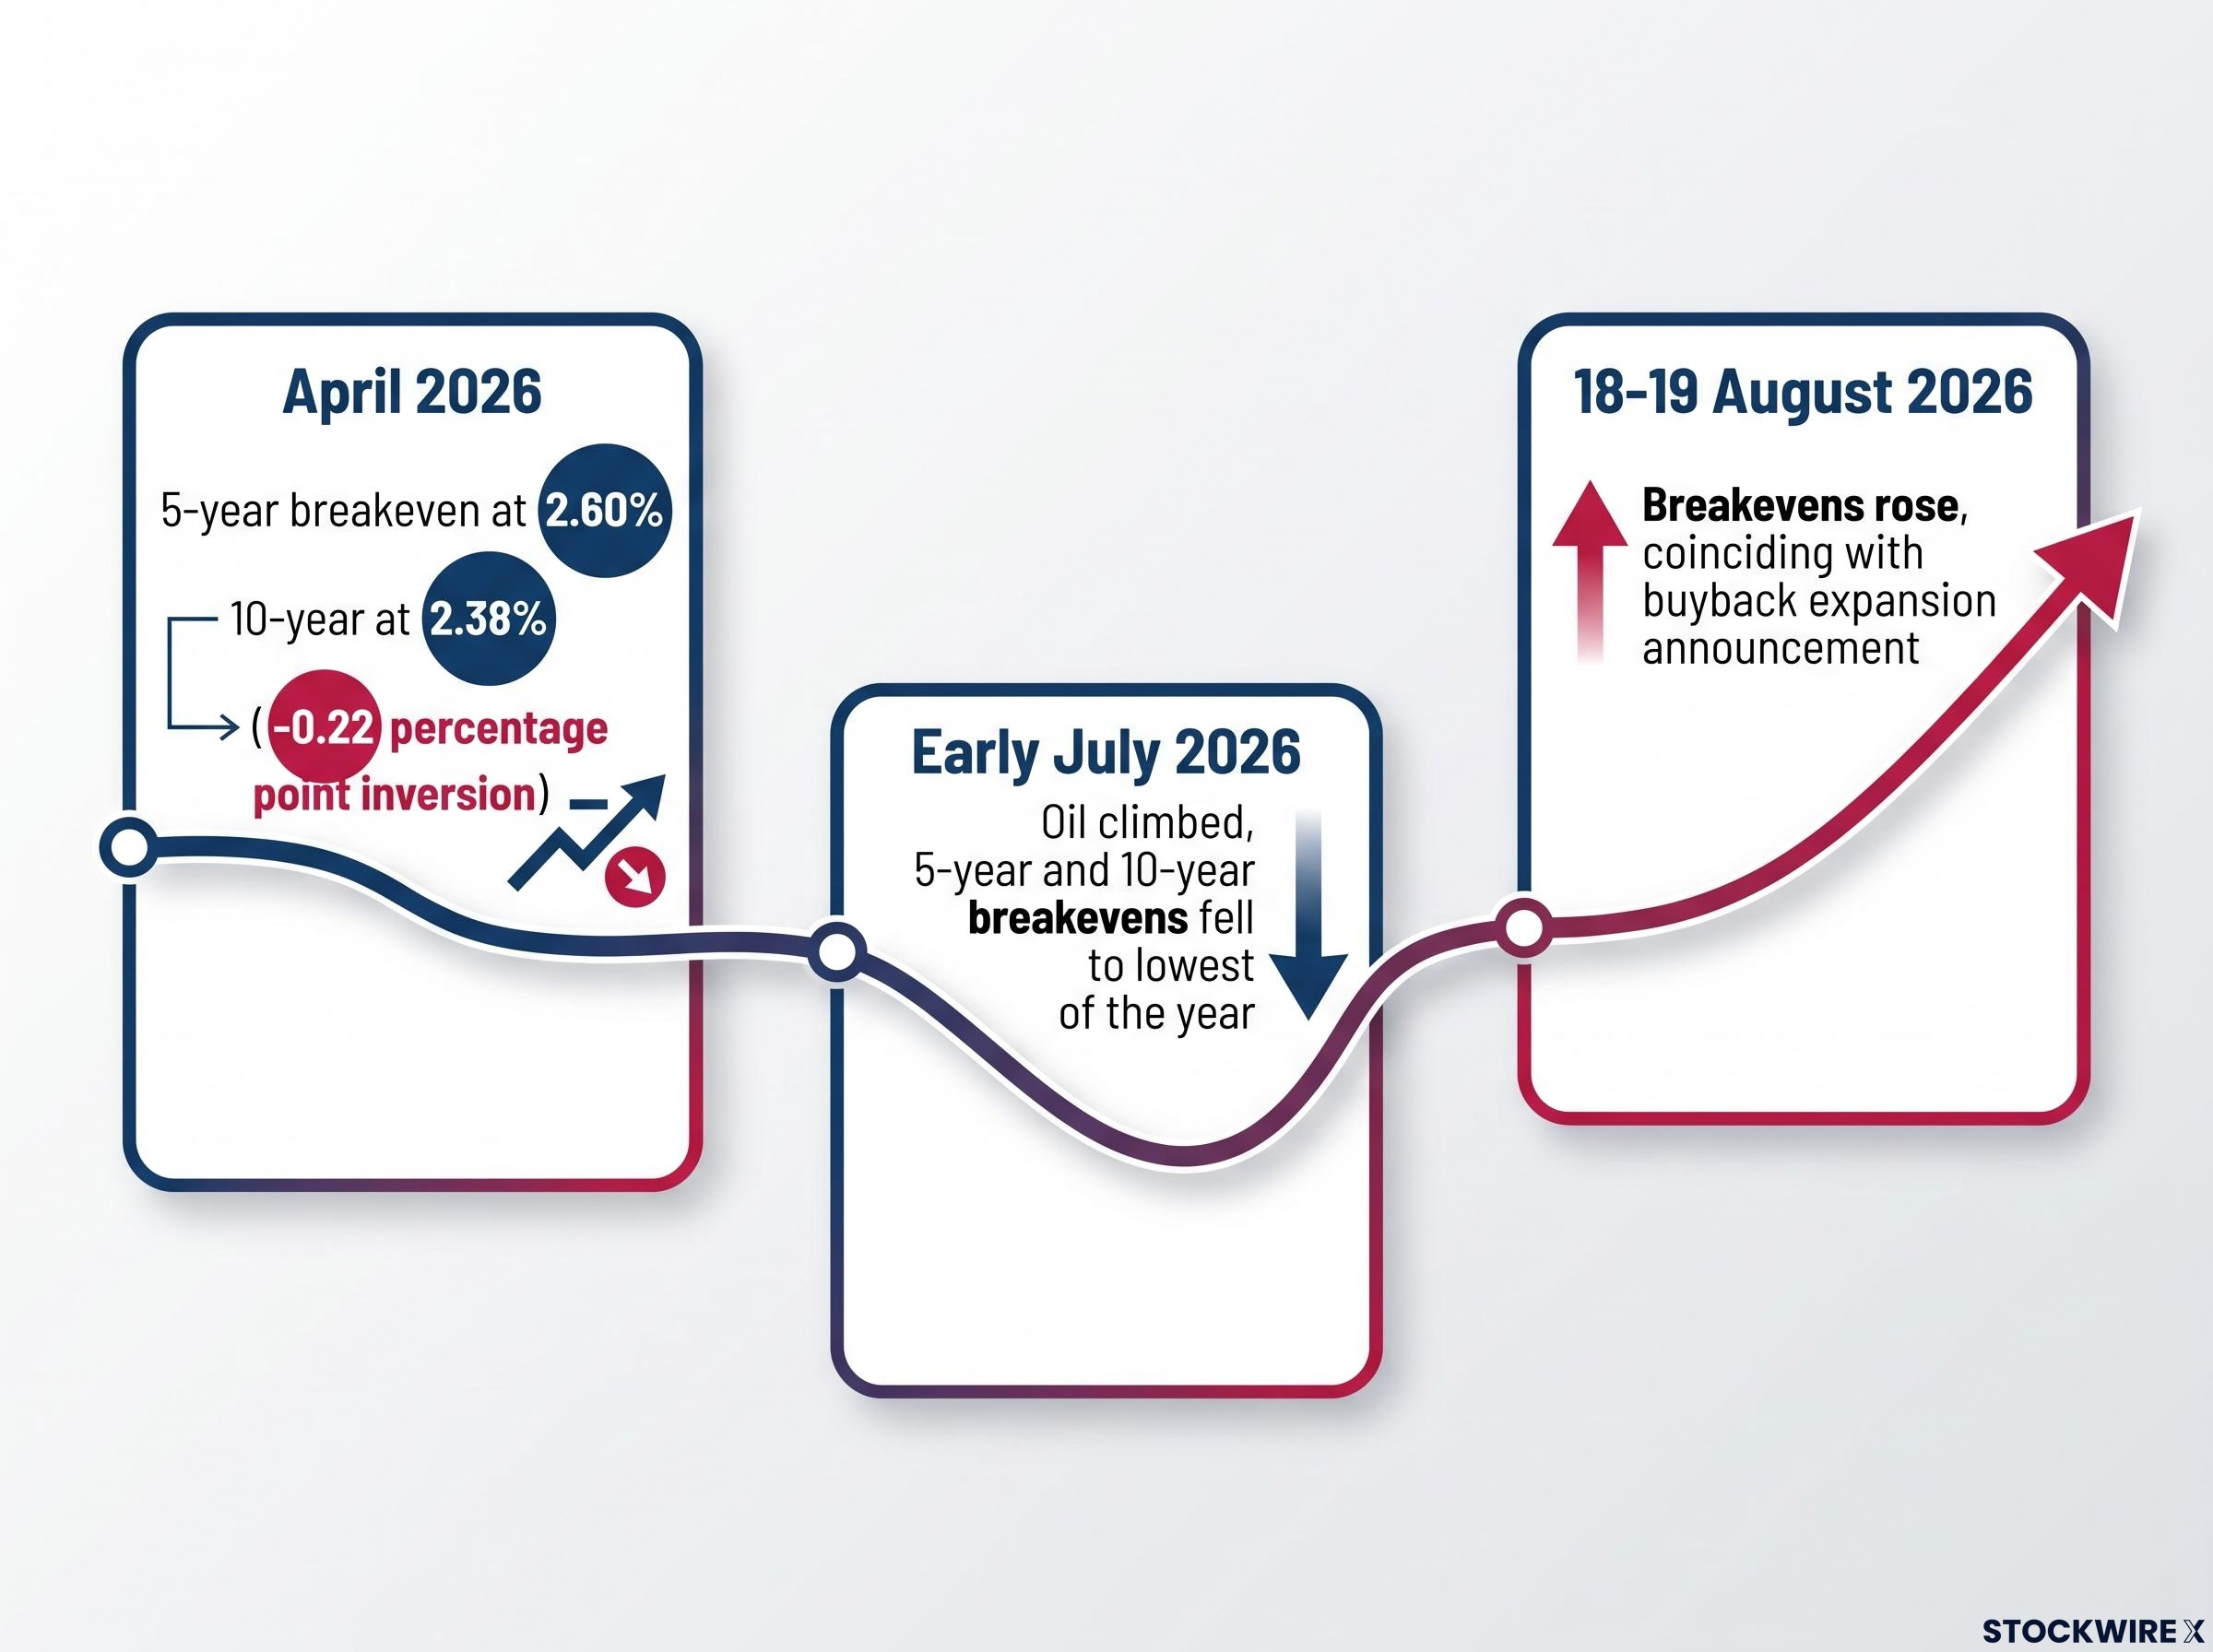
In early July 2026, oil resumed climbing. Under the old relationship, breakevens should have followed. Instead, both the 5-year and 10-year measures fell to their lowest levels of the year, with no energy-market catalyst to explain the divergence.
Then, around 18-19 August 2026, breakevens re-engaged and began rising again. The trigger was not a commodity move. It coincided precisely with the buyback expansion announcement. The market’s inflation gauge had switched its reference point from oil to Treasury policy, and it did so without a press release. The price action was the announcement.
Three mechanisms plausibly link the buybacks to breakeven behaviour:
- Term-premium compression: Removing long-dated supply lowers the extra yield investors demand for holding duration, which feeds into the nominal side of the breakeven calculation.
- Signalling effects: The expansion tells the market something about the Treasury’s future funding intentions, shaping expectations independently of any single operation.
- Portfolio-balance shifts: As investors are pushed out of retired long-dated issues, they rebalance into other assets, moving relative prices across the curve.
The interpretive read is direct. The market’s inflation-expectations machinery has changed its anchor. Any trader or analyst still using oil as a primary inflation proxy is running a framework that no longer matches the conditions in front of them, and that mismatch is where a genuine analytical edge now sits.
What the 5-year/10-year breakeven inversion signals
The curve itself reinforces the point. April 2026 Federal Reserve data showed the 5-year breakeven at 2.60% and the 10-year at 2.38%, a +0.22 percentage point inversion.
An inverted breakeven curve prices higher inflation compensation in the medium term than the long term. That configuration reflects the market’s belief that near-term inflation risk exceeds long-run risk, which is exactly what you would expect when a policy is actively managing the long end. In a commodities-driven inflation regime, the curve would typically slope the other way, upward, so the inversion is structurally different from the old world.
The credibility calculus and where the risks accumulate
The strategy is working. The question worth sitting with is what has to keep holding for it to continue, because the programme succeeds only until it does not.
Start with the cost built into the mechanism itself. Funding long-end buybacks with short-term bills shortens the overall debt maturity profile, which raises rollover risk. The Treasury must refinance a larger share of its debt more frequently, leaving the fiscal position exposed to any sudden spike in near-term rates. This is not an external threat; it is the price of the swap.
Then there is the scale debate, which cuts to the heart of whether this is real or theatre. The signalling view holds that $14 billion in quarterly additions is minute against total outstanding US debt, far too small to mechanically move a market this size. The credibility-premium view holds that it works precisely because market participants believe it will. The auction data currently favours the second reading, but belief is a fragile foundation.
The August announcement validated the principle that signal rather than mechanical scale drives market pricing: the 30-year yield fell 9-14 basis points in a single session while the dollar index dropped roughly 80 basis points, a cross-asset reaction pattern far larger than the $14 billion in incremental liquidity could justify on its own.
Foreign demand is the third condition. If international investors come to see the programme as politicised, quasi-monetary intervention rather than routine liquidity support, their withdrawal would erode the very demand now clearing auctions so comfortably.
Foreign demand for Treasuries has plateaued at roughly 33% of outstanding debt, and the OMFIF Global Public Investor 2026 survey marks the first time more central banks plan to reduce rather than increase dollar allocations over the next decade, a structural shift that gives the foreign-deterrence risk in the current programme far more bite than historical precedent would suggest.
The four primary risk categories worth tracking:
- Rollover and refinancing risk: the shortened maturity profile magnifies sensitivity to near-term rate spikes.
- Front-end steepening from Fed divergence: hawkish monetary policy pushing short-end yields up against a managed long end.
- Foreign demand deterrence: perception of politicisation undermining international appetite for Treasuries.
- Operational execution risk: the transition to the New York Fed’s FedTrade Plus platform could disrupt larger, more frequent operations.
The most important tension is already visible. Fed Chair Kevin Warsh’s hawkish remarks at Jackson Hole pushed short-end yields higher, widening the 2-year to 3-month spread, while the 30-year to 10-year spread has flattened since mid-August under Treasury buying. That divergence tells you the Treasury and the Fed are pulling in opposite directions along the same curve. That single tension is the clearest structural variable to watch for signs the strategy is losing coherence.
The credibility risk is concentrated at one point: if long-end yields breach “managed” support levels despite the expanded buybacks, markets could re-price the programme as ineffective, and the volatility that follows would be difficult to contain.
What investors should watch as the strategy enters its critical test
The window from 9 September through 4 November 2026 is where this gets settled. Seven long-end buybacks are scheduled across it, and the outcome will show whether the expanded programme holds or reveals its ceiling.
The nearest test is the $22 billion 30-year auction following 9 September. A weak result there would be the first crack in the long-end confidence story, signalling that credibility stops short of the very far end of the curve.
The live risk to watch is the Fed-Treasury divergence. Warsh’s hawkish posture is already pushing the front end up while Treasury pins the long end down. A stress event would look like this: short-end yields spiking on hawkish Fed rhetoric while long-end support fails to hold, breaking the flattening in the 30-year to 10-year spread and exposing the coordination gap in plain market terms.
The four-variable monitoring framework
Track these in order, from leading to lagging signal.
- 10-year and 30-year auction bid-to-cover and dealer share. Watch for bid-to-cover slipping below the 2.5x average and dealer share climbing back above 6-7%. Rising dealer absorption means end-demand is fading and the floor is being tested.
- 5-year to 10-year breakeven spread direction. A widening inversion confirms the policy read is intact; a move back toward an upward slope would suggest the market is reverting to a commodity-driven inflation frame.
- 30-year to 10-year yield spread. Continued flattening signals Treasury influence is holding at the long end. A sudden re-steepening would be the earliest sign the buybacks are losing grip.
- Foreign investor allocation trends. Falling indirect-bidder participation across auctions would flag deteriorating international appetite, the risk most capable of unravelling the whole structure.
The reader who tracks these four across the next two months will have a real-time read on whether the Treasury’s yield management has earned durable credibility or is defending a position that grows costlier by the operation.
This article is for informational purposes only and should not be considered financial advice. Investors should conduct their own research and consult with financial professionals before making investment decisions. Past performance does not guarantee future results, and any forward-looking statements are speculative and subject to change based on market developments.
Credibility held, for now, but the harder test is still ahead
Three dynamics define the current state. The programme is mechanically small yet carries outsized signalling power. The auction microstructure, led by that 4.3% September dealer share, is running firmly in the Treasury’s favour. And the breakeven decoupling from crude represents a genuine shift in how inflation signals are read.
The equilibrium holds under specific conditions: foreign demand stays stable, the Fed-Treasury tension does not escalate into visible coordination failure, and no auction surprise disrupts the window through 4 November. Should any of those give way, particularly the divergence between a hawkish front end and a managed long end, the credibility premium that currently sustains the programme could reverse quickly.
For now, the practical orientation is straightforward. The commodity-to-inflation heuristic is broken, and the signal that matters is no longer oil. It is Treasury auction microstructure, and it is telling you the strategy is working, until the data says otherwise.