The Brazilian Real just posted one of its better weeks among emerging market peers, climbing to roughly 5.09 per dollar by early September 2026. But the analysts watching it most closely are not celebrating.
Rabobank has its year-end target at 5.35. J.P. Morgan sits even further out, at 5.55. That gap, between what the Real just did and where the outlier forecasters think it is heading, is the story worth understanding.
Brazil carries one of the world’s highest real interest rates, a powerful structural magnet for carry capital. But that same rate advantage is starting to compress, the election calendar is reshaping fiscal calculus, and the global backdrop is handing out fewer tailwinds than it did six months ago. Here is what the data actually tells you about why the Real’s rally may be borrowing from a weaker future, and what each of the key forces means for how you read this currency into year-end.
The rally that does not match the forecast
For the week ending 4 September 2026, the Real gained roughly 1.26% against the dollar, ranking 11th out of 24 tracked emerging market currencies. It was a decent showing, helped along by broader emerging market FX strength and a soft week for the US Dollar. By 9 September 2026, the spot rate had firmed further, with Twelve Data’s feed closing at 5.0885.
So the Real is stronger, not weaker. That is what makes the forecast picture so striking.
Where the banks stand heading into Q4
The most recently published bank targets do not sit close together. A consensus table dated 5 September 2026 spanning 18 banks shows a December 2026 median of 5.14, but the individual range runs from 4.50 all the way to 5.70. That is not a rounding difference. It is a genuine split in how professional currency desks read Brazil.
| Bank | Year-end 2026 USD/BRL forecast | Directional stance |
|---|---|---|
| ING | 4.50 | Bullish (stronger BRL) |
| UBS | 4.80 | Bullish |
| HSBC | 4.85 | Bullish |
| Goldman Sachs | 4.90 to 5.00 | Bullish |
| Deutsche Bank | 5.05 | Neutral |
| Commerzbank | 5.20 | Neutral |
| Citi | 5.20 | Neutral (bullish BRL bias) |
| Bank of America | 5.25 | Neutral |
| Societe Generale | 5.35 | Bearish (weaker BRL) |
| Rabobank | 5.35 | Bearish |
| J.P. Morgan | 5.55 | Bearish |
The selection above reflects the most recently available published targets from each house. Brazil’s own Focus survey (August 24 edition) offers a useful independent check: it held its median year-end estimate at 5.20 for a tenth consecutive week, reflecting domestic market consensus rather than international bank positioning.
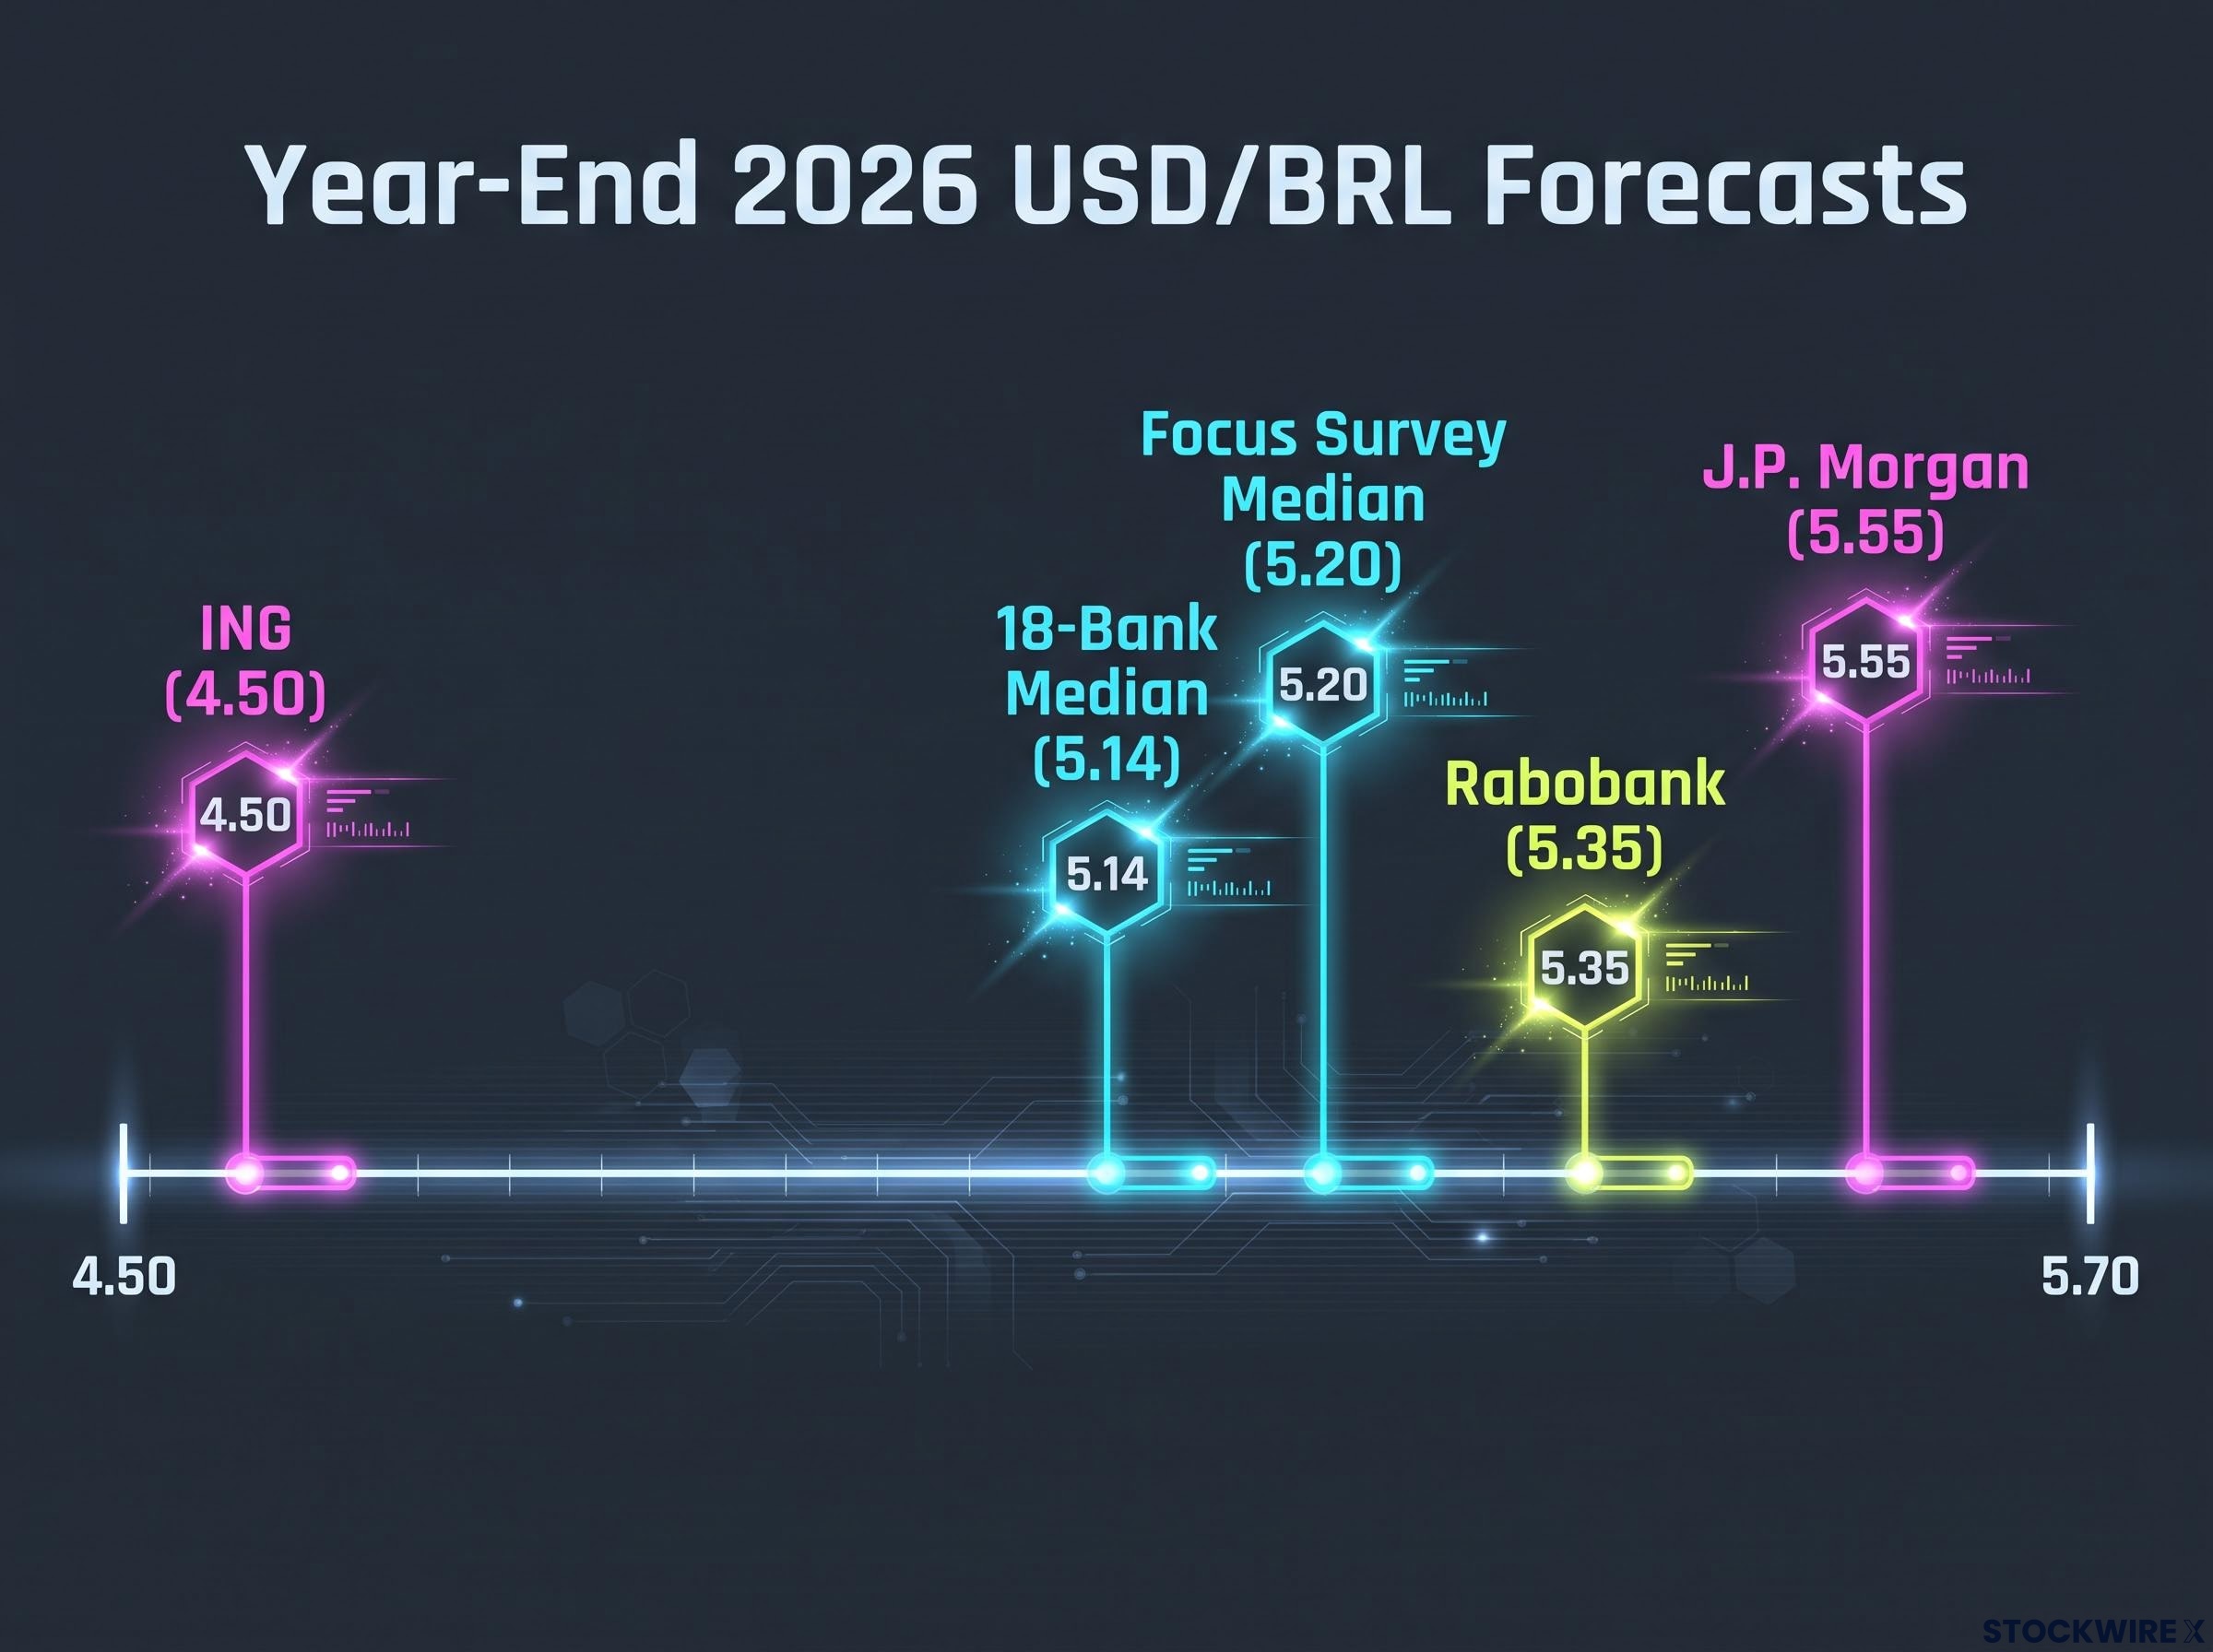
Rabobank’s 5.35 sits above both the 18-bank median and the Focus reading. That makes it a minority view, but not an isolated one. The width of that forecast range, 4.50 to 5.70, tells you these desks are working from genuinely different macro assumptions, not minor timing disagreements. Anchoring on the median obscures that. The more useful question is why the bears sit where they sit, because if you are pricing Brazil exposure into Q4, you want to know which framework is most likely to be right.
When big ASX news breaks, our subscribers know first
Why the carry trade is both the Real’s greatest asset and its clearest vulnerability
Start with why the money comes in, because the case is genuinely compelling. After the Copom’s 25 basis point cut on 5 August 2026, the Selic sits at 14.00%. The Federal Funds target range sits at 3.50% to 3.75%, a midpoint of roughly 3.625%. That leaves a nominal policy-rate gap of about 10.375 percentage points in Brazil’s favour.
Strip out inflation and the picture stays strong. With IPCA inflation running near 5-6%, Brazil’s ex-ante real rate lands somewhere around 8.5% to 9.5%, placing it among the highest real-rate offerings anywhere. One-month Real NDFs have been carrying implied yields of 13% to 13.4%, roughly 1.1% per month. That is a lot of income for holding a currency.
NDF forward repricing is the highest-signal early warning indicator available to carry holders, because carry premiums compress in the forward market before spot USD/BRL adjusts, giving investors a measurable informational lead over those reacting to headline news flow.
The market has noticed. A euro-funded carry basket going long Real, Colombian Peso and Turkish Lira is up around 19% year-to-date in 2026.
The strongest start since 2005 A euro-funded basket long BRL, COP and TRY has returned roughly 19% so far in 2026, its best opening stretch in two decades.
Here is where the logic inverts. The same rate advantage that pulls capital in is now compressing. The August cut opened a cautious easing cycle, and the Copom minutes gave no explicit guidance on the next move. Meanwhile a data-dependent Fed limits how far the differential can stretch. Every basis point Brazil cuts while the US holds narrows the cushion that carry holders rely on.
What triggers a carry reversal in practice
Historically, Real carry trades unwind sharply under three conditions, and all three are live risks heading into late 2026:
- Global risk-off events: a spike in safe-haven dollar demand pulls capital out of high-yield currencies indiscriminately.
- Domestic fiscal shocks: a credibility break at home turns the yield premium into inadequate compensation for the risk.
- Central bank credibility loss: any sign the Copom is easing faster than inflation warrants erodes the real-rate advantage that anchors the trade.
When these episodes hit, USD/BRL commonly moves 5% to 8% in 4 to 8 weeks. That is the asymmetry: carry accumulates gradually, but exits happen fast, because every carry holder becomes a seller at once.
Carry reversals tend to cluster in windows of thin liquidity precisely because reduced order flow amplifies price moves per unit of selling pressure, meaning the 5-8% USD/BRL dislocations recorded in prior episodes arrived faster than positioning models anticipated.
The positioning shift is already visible. Major asset managers including VanEck, Vontobel and Aberdeen have recently trimmed Brazilian exposure, citing election risk and a limited downside cushion. That does not mean the trade is unwinding. It tells you the market is beginning to price the conditions under which it could, and that direction of travel matters more than the spot rate on any given day.
Brazil’s fiscal position in an election year is the structural fault line
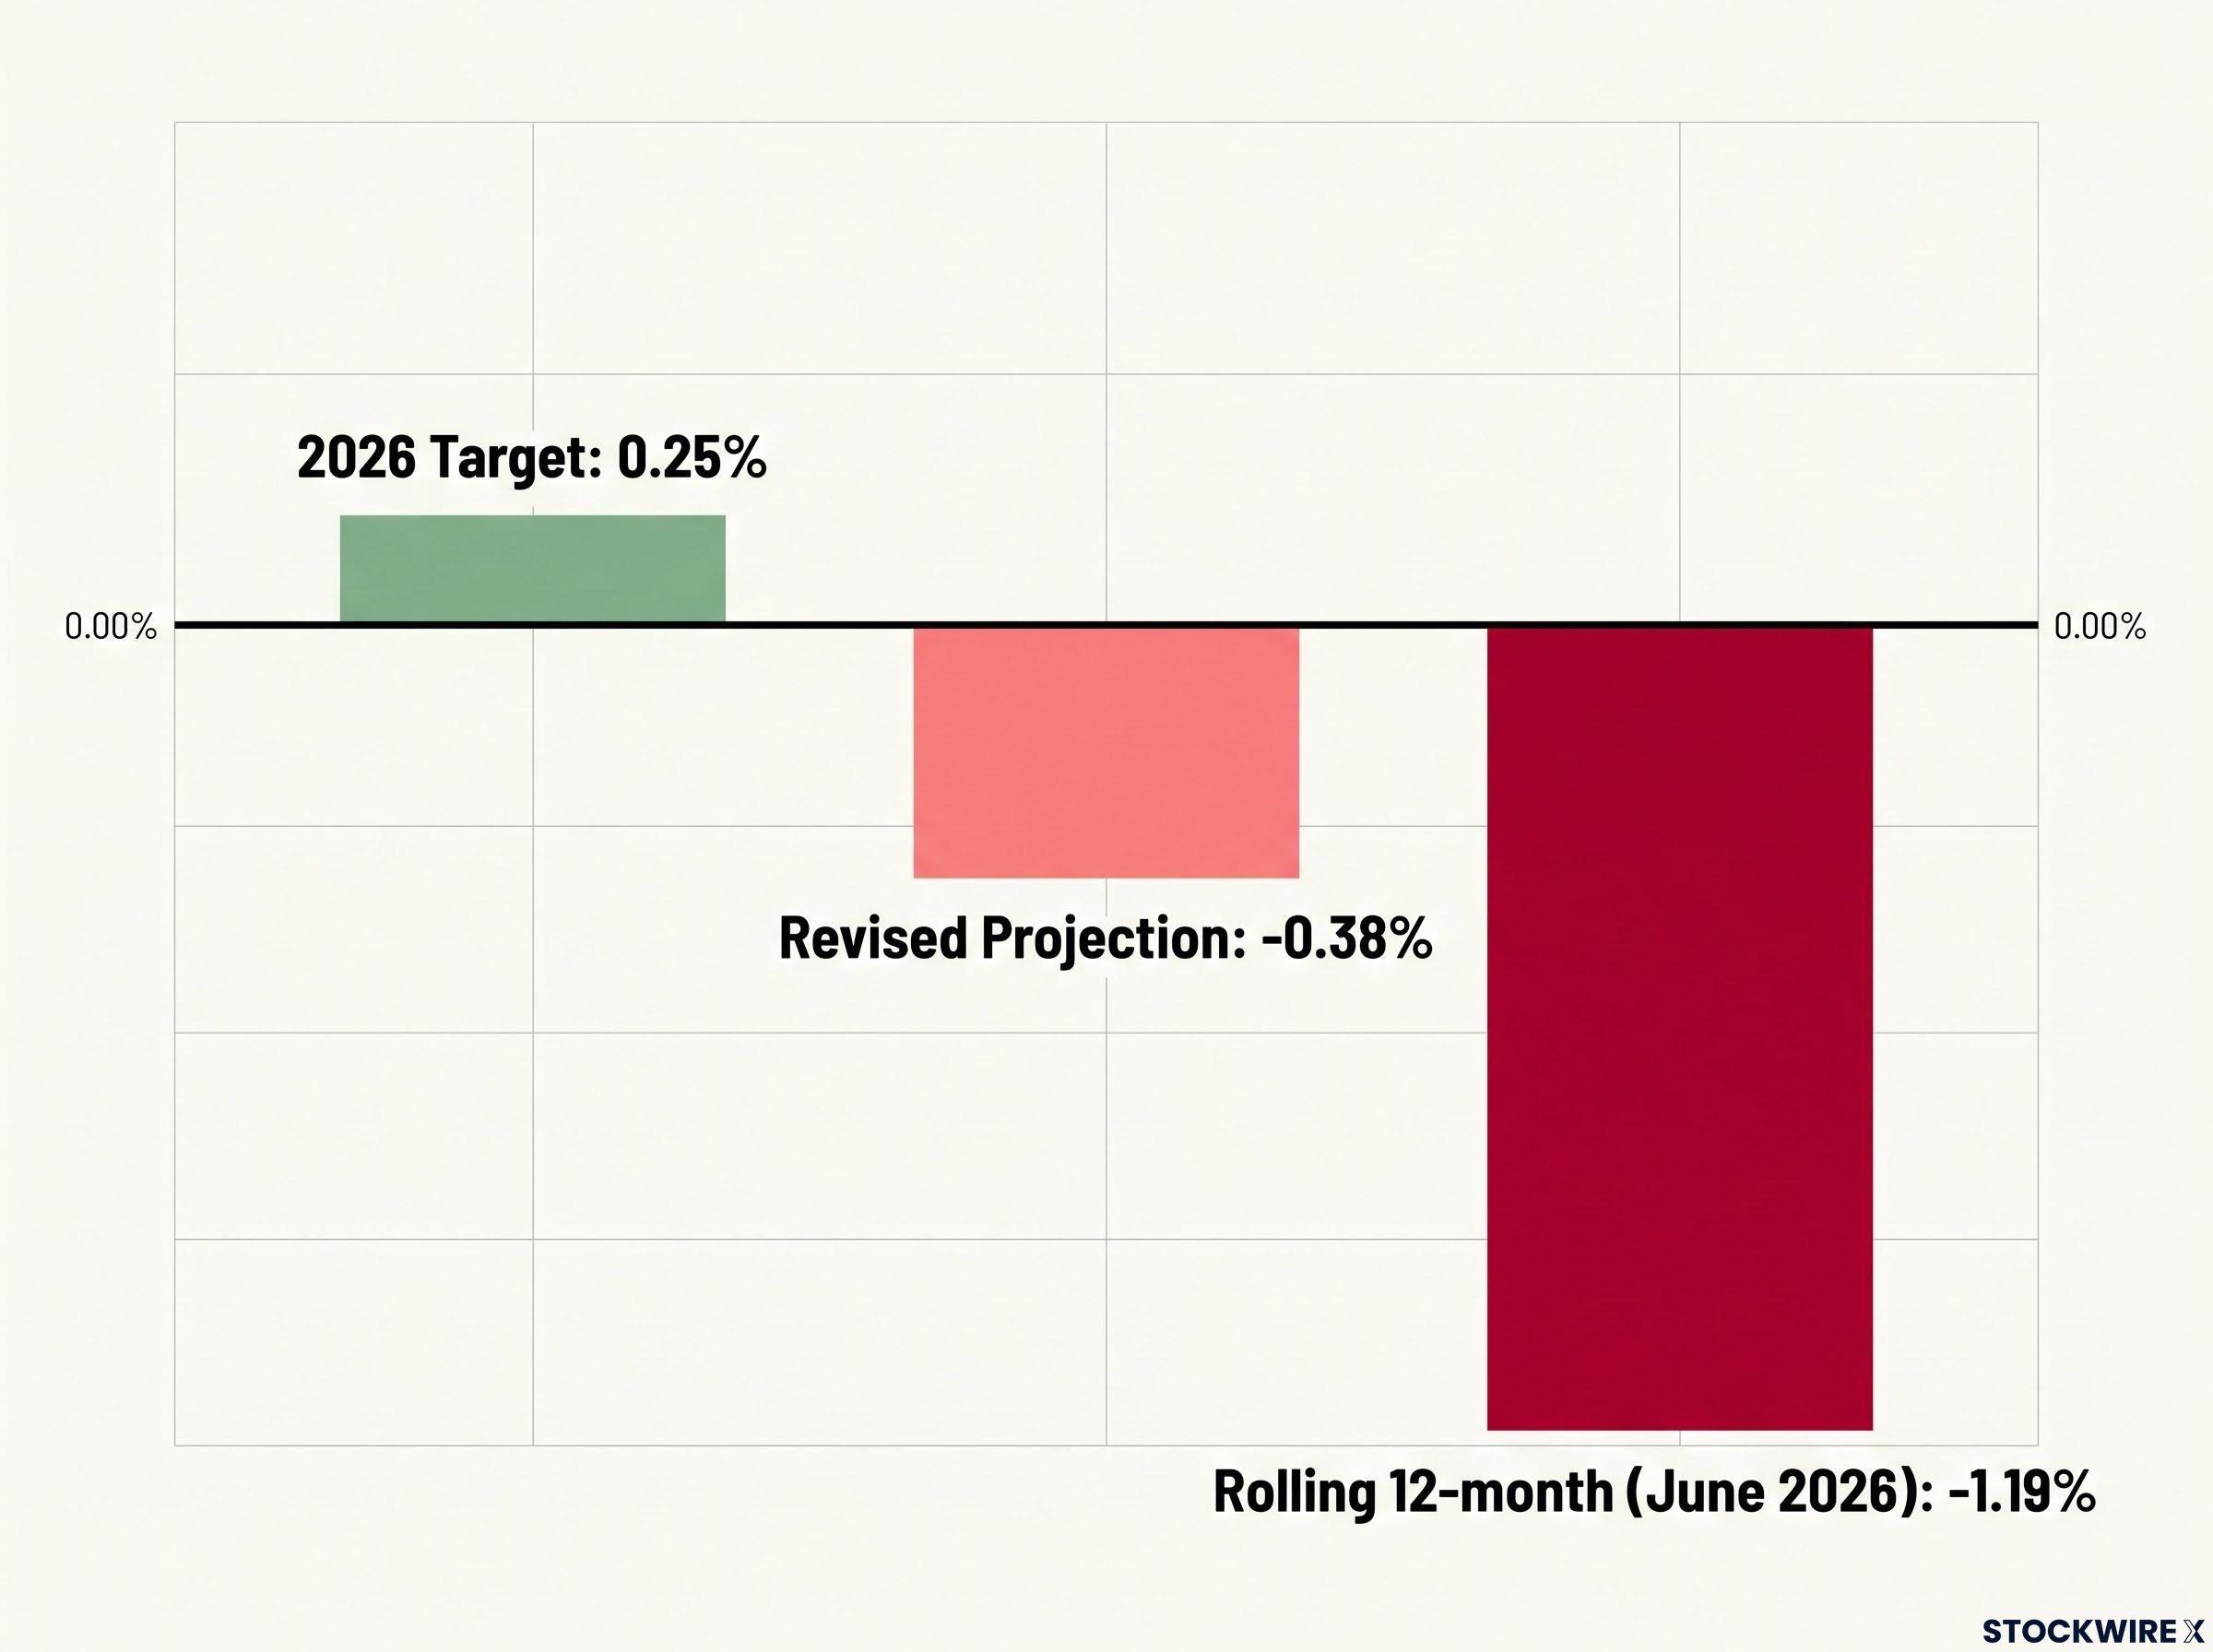
On paper, the fiscal framework looks disciplined. The 2026 primary surplus target is 0.25% of GDP, with a tolerance band that permits deficits up to 0.5%. Look one layer down, though, and the numbers tell a different story.
- 2026 primary surplus target: 0.25% of GDP
- Government’s own revised 2026 projection: a primary deficit of 52 billion reais, or 0.38% of GDP
- Rolling 12-month primary deficit through June 2026: 1.19% of GDP
- Gross general government debt: 81.9% of GDP as of June 2026, around R$10.8 trillion
The government’s revised projection already points to a deficit rather than the targeted surplus, and the Treasury argues it stays compliant only under the tolerance band. But the rolling 12-month deficit of 1.19% of GDP is the figure that cuts through the point-forecast optimism. That is the trajectory, not a snapshot.
The Banco Central do Brasil fiscal statistics track the rolling primary balance, gross general government debt, and net public sector debt in monthly series, providing the primary reference for the trajectory figures that carry traders and sovereign analysts use to calibrate Brazil exposure.
Then there is the debt level. At 81.9% of GDP, gross debt already sits above the 80% threshold that the opposition Bolsonaro campaign’s reported fiscal rule would use to trigger an automatic spending freeze (a proposal reported but not independently verified). That means the fiscal debate entering the election is not theoretical. It is immediately binding on whatever government takes office.
Historical episodes that calibrate today’s risk
Brazil’s own record shows how fast fiscal doubt becomes a currency event.
| Year | Trigger | BRL depreciation | Peak USD/BRL |
|---|---|---|---|
| 2002 | Election stress on Lula victory signals | Large real devaluation | Sharp yield spike |
| 2015 | Budget-surplus target cut without a credible repair plan | ~50% (year to Dec 2015) | Above 4.00 |
| 2024 | Weakened fiscal framework, revenue-only measures | 27.9% | 6.19 |
In 2002, polls signalling Lula’s win prompted a current-account reversal and soaring government bond yields. In 2015, Brazil cut its surplus target without a repair plan and the Real lost roughly 50% against the dollar in a single year as gross debt climbed above 65% of GDP. In 2024, a diluted fiscal framework triggered a credibility crisis and a 27.9% depreciation to 6.19 per dollar.
The lesson for 2026 is not that a repeat is certain. It is that when fiscal credibility breaks in Brazil, the correction is fast, deep and difficult to time. The IMF also finds election-year deficits run 0.3% of GDP higher on average, which is exactly the drift the market is watching for. Knowing where the fault lines sit before an event is the only useful vantage point.
Global headwinds compound the domestic picture
The domestic fiscal risk does not stand alone. Each external variable independently tightens the conditions under which the Real’s carry advantage can hold.
Start with the Fed, because it is the primary constraint. US August 2026 employment data came in strong, with solid job creation and a steady unemployment rate, which trims the odds of a near-term cut.
US dollar positioning is itself a variable in the Real’s near-term outlook: the DXY slipped back below 99.00 on 7 September 2026 despite a stronger-than-expected NFP print, because crowded long-dollar positioning and relative rate expectations are overriding headline data surprises in the short run.
Fed Governor Christopher Waller The September 2026 rate decision hinges on the August inflation print. An upside surprise could warrant a hike; continued disinflation would support holding the current 3.50% to 3.75% range.
That single data release is the most consequential near-term external variable, because it sets the ceiling on how far the Selic-Fed differential can stretch. The four external pressures line up like this:
- US monetary policy: a Fed that stays higher for longer caps the rate differential that anchors carry inflows.
- US and China growth deceleration: softer demand threatens Brazilian commodity export revenues, a central plank of the bull case.
- Bank of Japan tightening: further BoJ moves drain global liquidity, with historical precedent for triggering simultaneous carry unwinds across emerging markets.
- Geopolitical instability: broad risk-off shifts disrupt the appetite that carry capital depends on.
Here is why this matters. A Fed holding firm while China’s demand for Brazilian commodities softens removes two of the three structural supports the Real bull case relies on. That leaves the carry differential as the sole remaining pillar, and the Copom’s easing cycle is already compressing it. External conditions could accelerate a correction that domestic fiscal dynamics alone would produce more slowly.
What the balance of risks actually says about year-end positioning
The bull case is real, and worth stating plainly. The Selic at 14.00% offers a genuine yield edge. Q2 2026 GDP grew 0.5% quarter-on-quarter, above the 0.4% expected, driven by agriculture and extractive industries. Commodity and agricultural export revenues are strong, and the central bank carries a credible track record. That combination explains why most banks forecast stability or mild Real strength.
Commodity export revenues represent the second structural pillar of the Real bull case: Brazil’s net oil-exporter status, achieved in 2017, converts energy price movements from a currency headwind into a current-account tailwind, and record foreign institutional inflows of R$53.37 billion in Q1 2026 alone confirmed that this structural shift had been repriced into positioning.
Now the pivot. The reason Rabobank’s 5.35 and J.P. Morgan’s 5.55 are analytically coherent rather than eccentric is timing. The compressing differential, the election-year fiscal drift, and the three external headwinds do not distribute evenly across the year. They converge on a Q4 inflection point. Gross debt at 81.9% of GDP, a Copom already cutting, and a data-dependent Fed all stack in the same window.
You do not need to decide whether USD/BRL closes 2026 at 5.14 or 5.35. You need to know which signal moves first.
The three variables that will resolve the debate
- US August CPI (Fed September decision). This is the near-term trigger. A hot print raises hike risk and caps the rate differential, pressuring the Real; continued disinflation lets the Fed hold, easing external pressure. Watch this before anything else.
- The October election outcome and incoming fiscal framework. The result matters less than the fiscal rule that follows it. A credible plan to stabilise debt supports the Real; ambiguity or loosening reopens the 2015 and 2024 playbook, where credibility breaks fast.
- Copom forward guidance on the pace of cuts. A gradual, cautious easing path preserves the carry cushion. Any signal of accelerated cuts compresses the differential faster than the market expects and hands the bears their case.
Watch which of these moves first, and you will know in real time which analytical camp is winning, without having to outsource the call to any single forecast.
This article is for informational purposes only and should not be considered financial advice. Investors should conduct their own research and consult with financial professionals before making investment decisions.
Past performance does not guarantee future results. Financial projections are subject to market conditions and various risk factors, and forward-looking statements are speculative and subject to change based on market developments.