On 7 September 2026, just seven commodity vessels transited the Strait of Hormuz. That single number, drawn from Kpler tracking data, tells the whole story of a chokepoint that normally sees 130 to 140 ships per day under peacetime conditions.
The collapse is a direct consequence of US-Iran military escalation, and it explains why the Indian rupee crossed 95 per US dollar the same day. The transmission from Hormuz to INR is mechanical, not metaphorical.
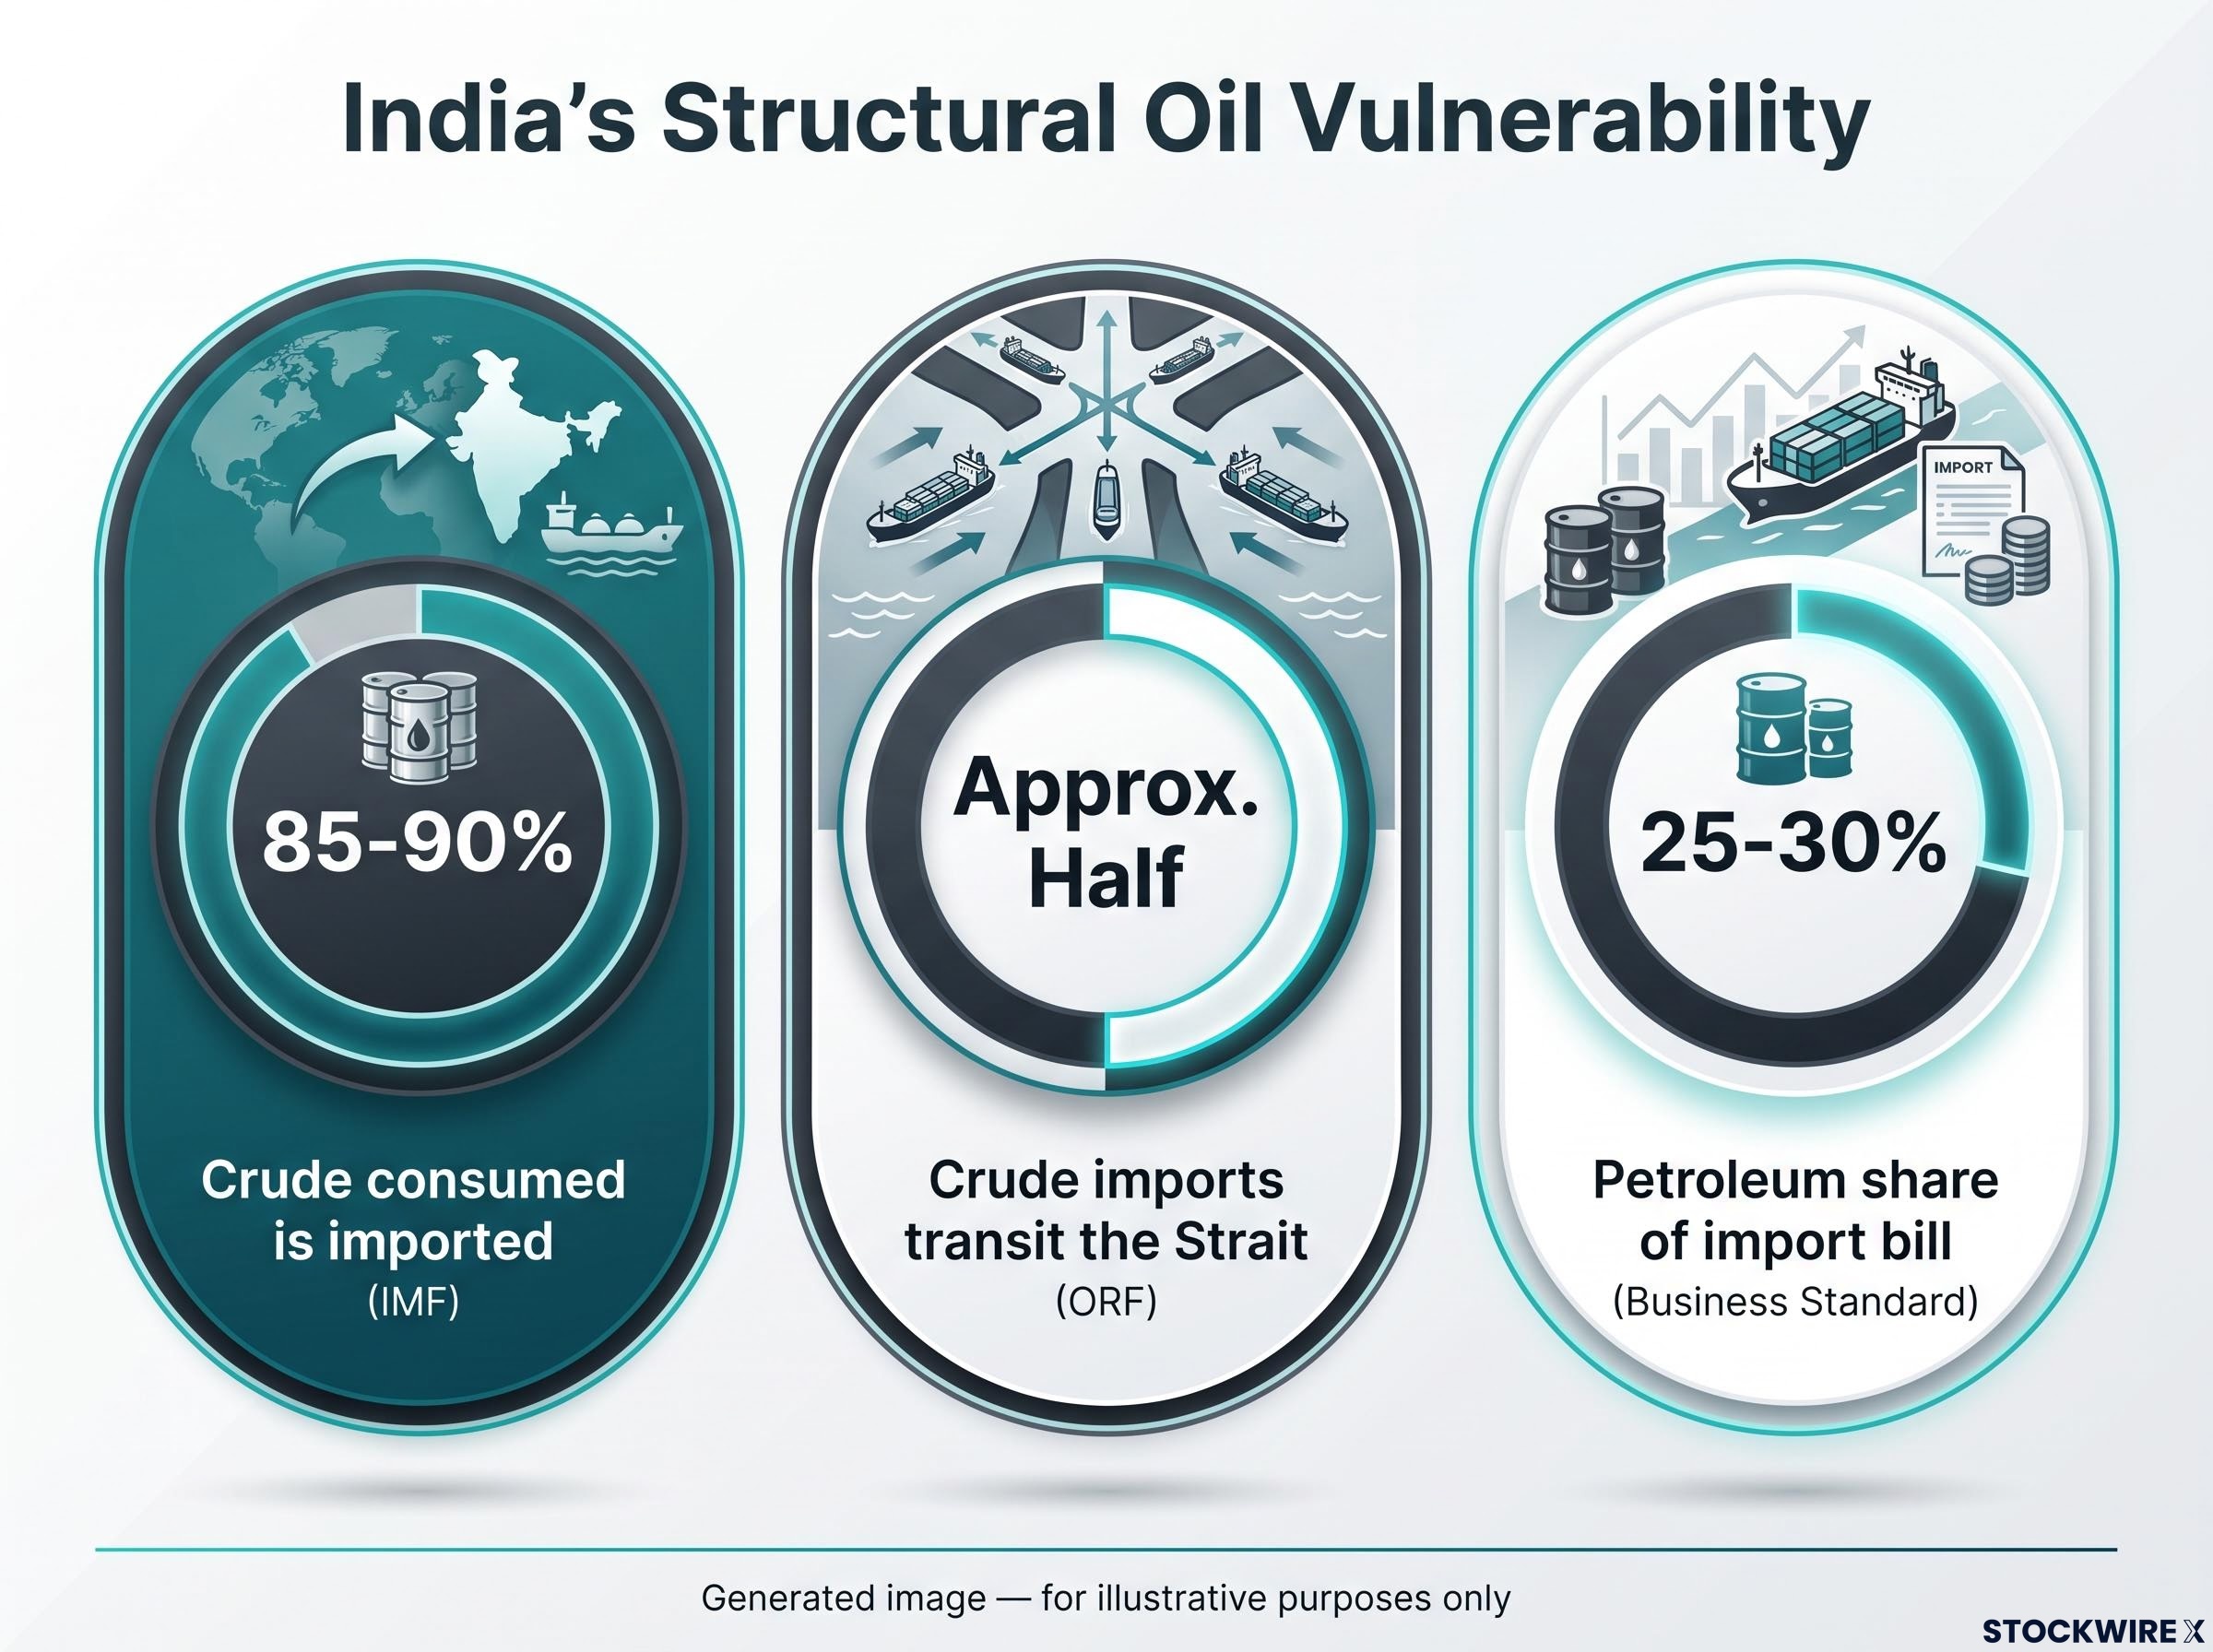
India imports roughly 85 to 90 percent of its crude, with about half of that supply routed through the Strait. When vessel traffic falls to single digits, India’s oil supply chain is among the first to feel it, and the resulting surge in dollar-denominated import costs drains reserves and widens the current account deficit in ways that press the rupee lower.
This analysis traces the full causal chain from a geopolitical conflict to currency markets, examines why India is more exposed than its emerging-market peers, and assesses what the Reserve Bank of India’s reportedly insufficient defence signals about the scale of the challenge ahead. By the time you finish, the way an oil-supply shock turns into a currency problem in a high-import economy should be clear.
From 140 ships to 7: how the Hormuz traffic collapse became a supply shock
Start with the baseline, because everything that follows is measured against it. Under normal conditions, roughly 130 to 140 commodity vessels move through the Strait of Hormuz each day, according to tracking data from Kpler and Lloyd’s List Intelligence.
The first collapse came in April 2026. On 9 April 2026, Reuters, citing Kpler data, reported traffic at well below 10 percent of normal, with just seven ships crossing in a 24-hour window against the usual 140.
A US-Iran ceasefire took effect on 8 April 2026, yet the recovery never arrived on schedule. Al Jazeera, drawing on Kpler and LSEG figures, reported that only 45 ships entered or exited the Strait between the ceasefire and 12 April.
By August, traffic had improved only marginally and unevenly. Reuters put the 10-day average at approximately 12 vessels in mid-August, with a single-session low of eight ships on one Tuesday, and by late August the count had regressed to seven on 27 August 2026.
September brought no relief. The most recent daily figure, seven commodity vessels on 7 September 2026, sits squarely within the depressed August range.
| Date | Daily Vessel Count | Context |
|---|---|---|
| Pre-conflict | ~130-140 | Peacetime baseline (Kpler, Lloyd’s List Intelligence) |
| 9 April 2026 | 7 | Below 10% of normal at peak of escalation |
| August 2026 | ~12 (10-day avg) | Partial, uneven recovery; low of 8 one session |
| 7 September 2026 | 7 | Regression to late-August pattern |
For investors tracking commodity-linked macro trades, the takeaway is that Hormuz is not a binary open-or-closed switch. The structurally suppressed traffic regime, well below any functional recovery threshold, is itself the market-moving condition, not a temporary spike waiting to correct.
Why a ceasefire did not reopen the Strait
Commercial shipping decisions are not driven by political announcements. They are driven by war-risk insurance premiums and operator risk assessments, and those recalibrate on their own timeline.
Lloyd’s List Intelligence weekly briefs show transits collapsing through July and only partially recovering by mid-August, weeks after the April ceasefire technically took hold. The mechanism matters here: supply risk stays live even when formal hostilities pause.
That persistence of seven-ship days months after a ceasefire tells you the commercial risk calculus has fundamentally shifted. Supply chains cannot be restored by diplomacy alone until insurers, operators, and charterers each independently decide the passage is safe.
The Hormuz risk premium has behaved differently from prior geopolitical oil spikes precisely because commercial war-risk insurance withdrawal preceded, and then outlasted, the formal military exchanges; VLCC daily hire rates tracking near $110,000 per day confirmed the physical market was pricing a structural closure, not a temporary disruption.
When big ASX news breaks, our subscribers know first
Why India absorbs this shock more deeply than other major oil importers
The same oil-price move does not hit every emerging-market currency equally. India is more exposed than most, and the reason comes down to three interlocking structural facts.
The first is import dependence. India is the world’s third-largest crude importer, and the IMF staff report is blunt about the scale of its reliance.
IMF staff report “India imports almost 90 percent of the oil it consumes.”
The second is routing concentration. According to an April 2026 analysis from the Observer Research Foundation, roughly half of India’s crude imports transit Hormuz directly, which means the Strait’s disruption is not a generic oil-price risk for India but a specific supply-chain shock.
The third is the weight of oil in the trade balance. Petroleum imports account for roughly 25 to 30 percent of India’s total import bill, according to Business Standard, so an oil shock transmits immediately into the current account.
Here are the three vulnerability factors in one view:
- Import dependence: roughly 85 to 90 percent of crude consumed is imported (IMF, ORF)
- Hormuz routing share: approximately half of total crude imports transit the Strait (ORF)
- Petroleum share of import bill: approximately 25 to 30 percent (Business Standard)
The numbers behind the mechanism are large. IMF staff estimate that a sustained US$10 per barrel rise in oil prices adds roughly 0.3 to 0.4 percentage points of GDP to India’s current account deficit.
The global oil supply shock set in motion by the conflict has proved resistant to the standard emergency-release toolkit: IEA and SPR releases totalling approximately 280 million barrels failed to halt inventory drawdowns running at 8.5 million barrels per day in Q2 2026, double the previous record pace, confirming that reserve releases cushion but cannot substitute for a restored chokepoint.
In absolute terms, each US$10 move in Brent adds an estimated US$12 to 15 billion to India’s annual oil import bill. That bill is settled in dollars, which is where the currency pressure originates.
For an investor comparing emerging-market currency exposure, this is the distinction that matters. India’s routing concentration through a single chokepoint means a Hormuz disruption is qualitatively different for the rupee than a broad oil-price move would be for peers that produce more of their own crude or carry lighter oil baskets. The dollar-demand mechanism is direct and identifiable.
The oil-to-rupee transmission: how $97 Brent reaches 95 per dollar
Two numbers on a screen tell the story. Brent crude sat near $97 per barrel on 8 September 2026, according to The Hindu, and the rupee crossed 95 per US dollar the following day. The link between them is a sequence, not a coincidence.
The transmission runs in four steps. Higher crude raises India’s dollar-denominated import bill, which increases dollar demand from oil importers, which widens the current account deficit, which puts structural downward pressure on the rupee.
The domestic price signal moved in lock-step. MCX September crude futures climbed from roughly Rs 8,711 on 7 September to the Rs 8,892 to 8,920 range by 8 to 9 September, confirming that the international spike was flowing straight into local pricing.
The rupee’s weakness on 9 September 2026 was broad-based, not a one-currency wobble.
INR performance, 9 September 2026 The rupee fell approximately 0.31% against the US dollar, 0.47% against the euro, and 0.78% against the Japanese yen, its steepest single-day loss of the session. Losses were recorded against every major currency tracked.
One econometric estimate offers a rough anchor for the relationship: a $1 increase in Brent is associated on average with about Rs 0.28 (28 paise) of rupee depreciation. Treat that as directional rather than precise, since it has not been independently verified, but it frames the sensitivity usefully.
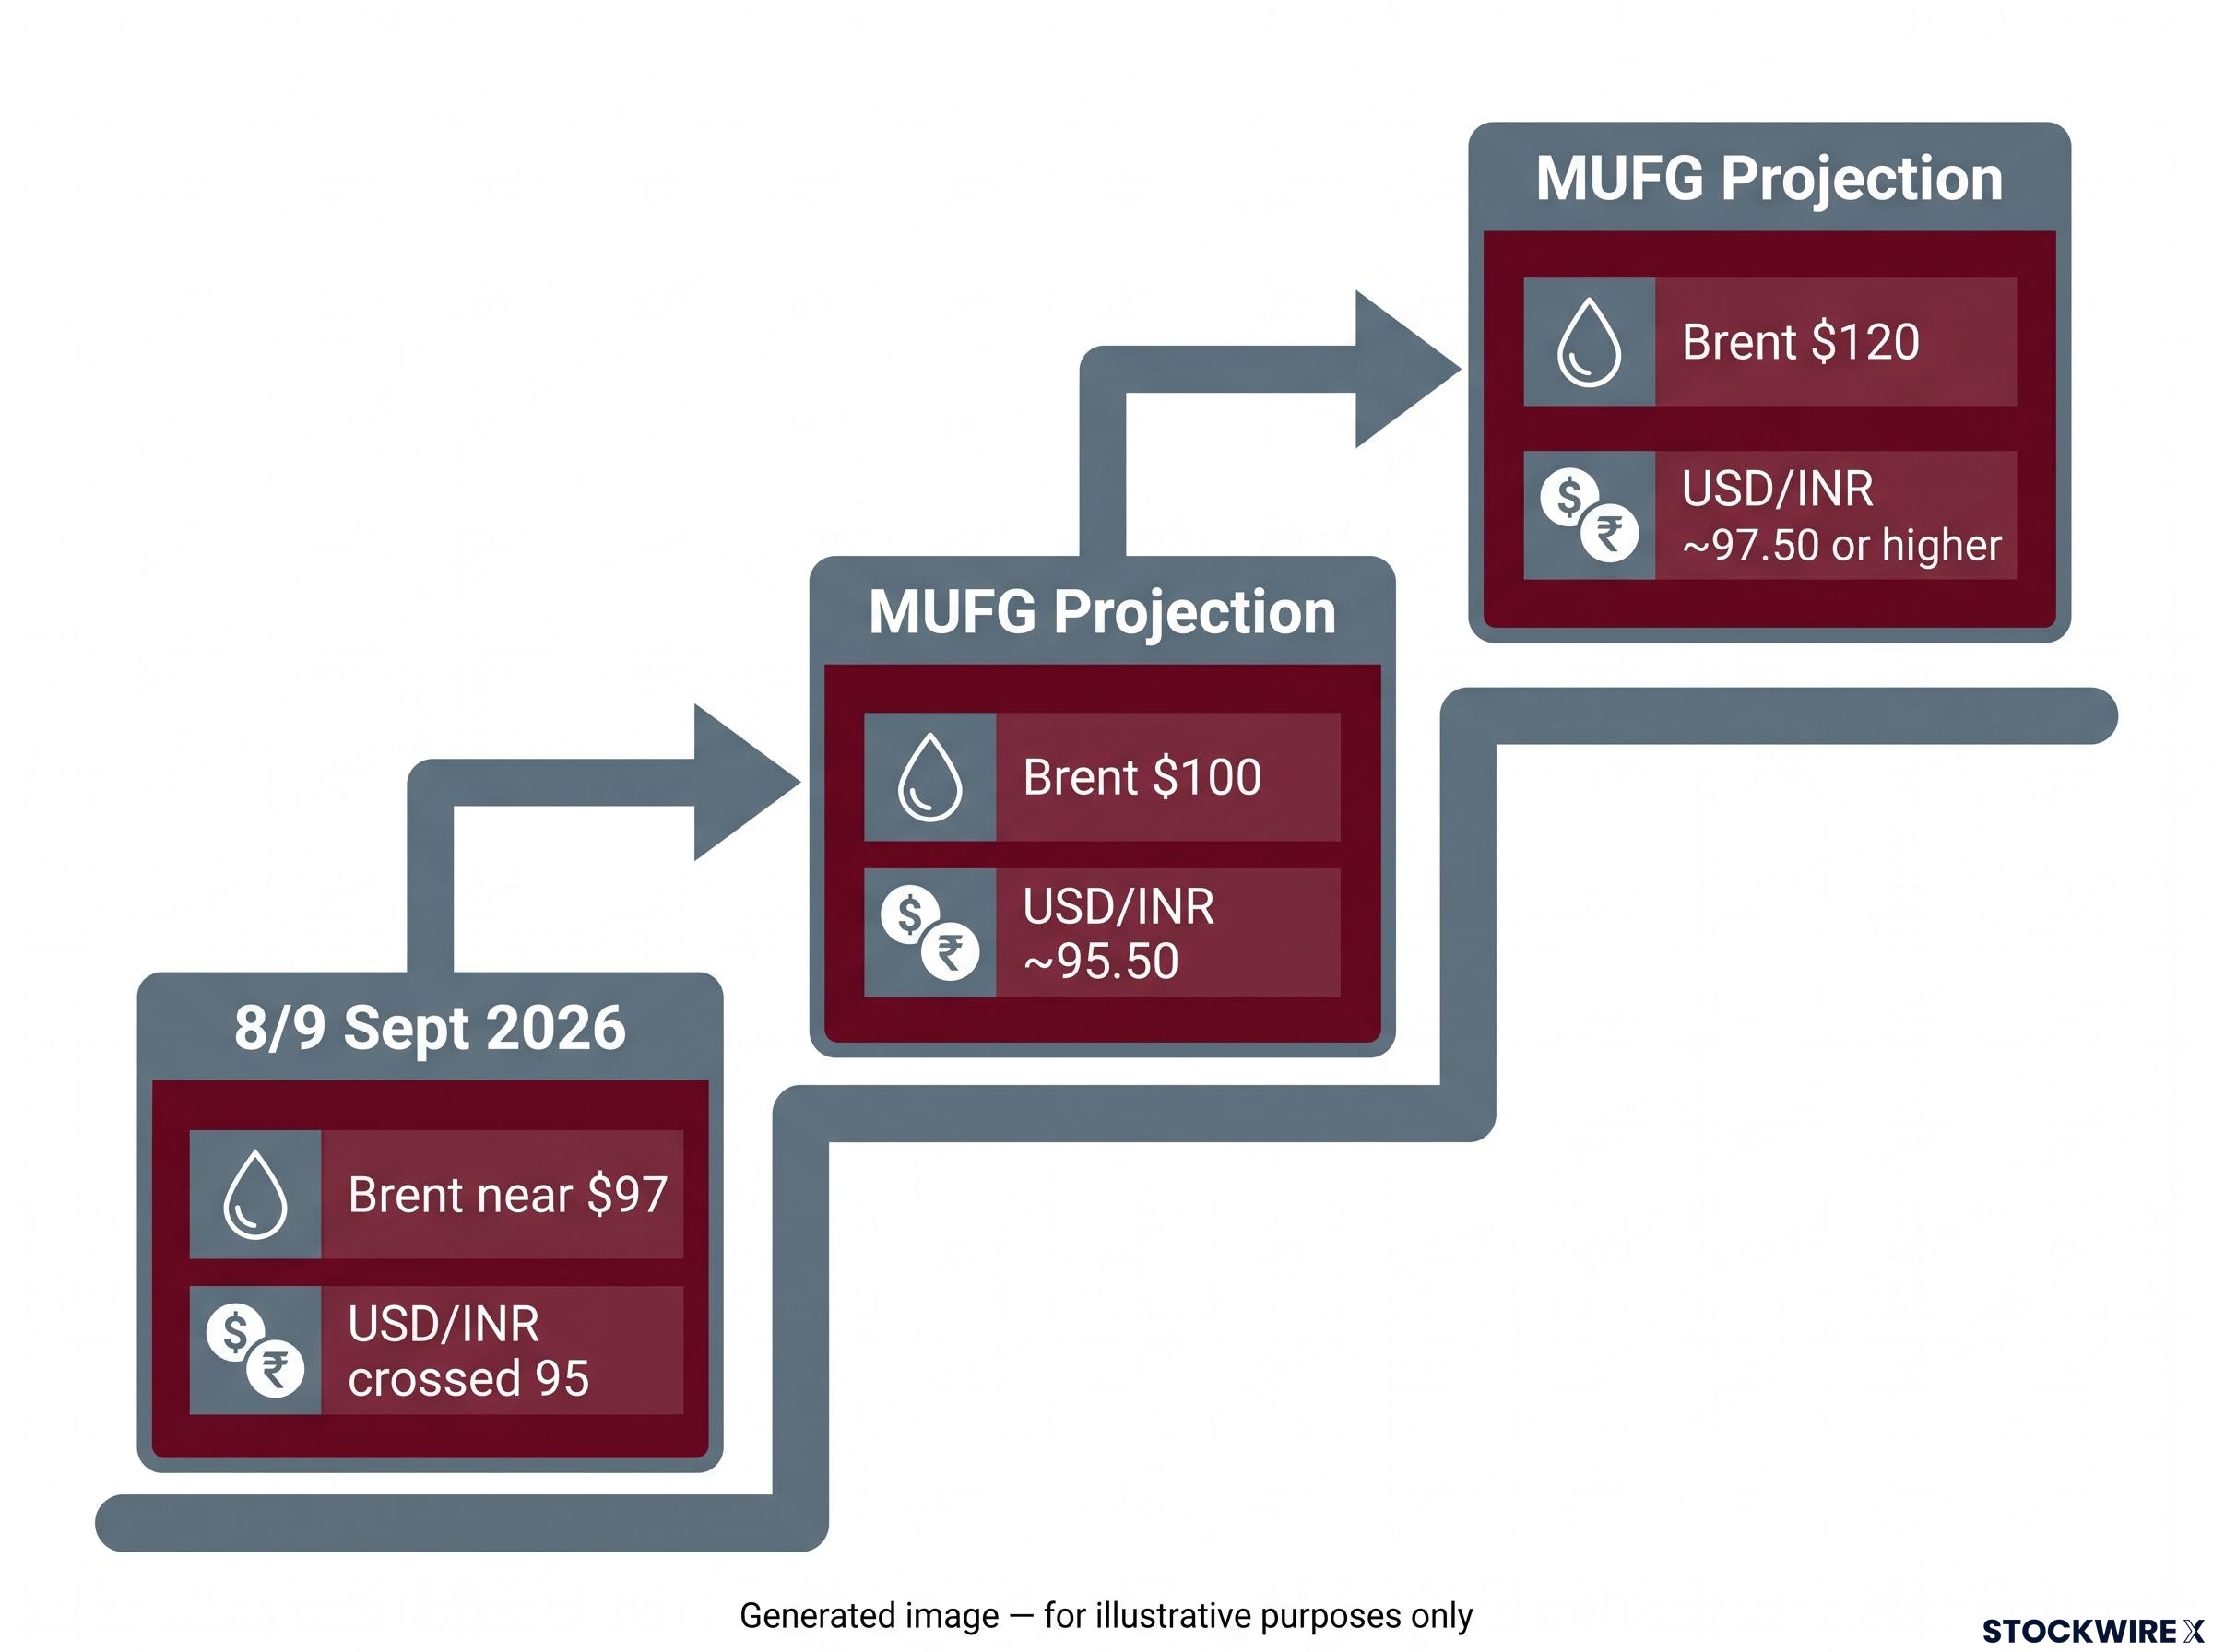
For a quantitative view of where this could go, MUFG Research has sketched scenario projections tied to specific crude thresholds.
| Brent Scenario | Implied USD/INR | Key Assumption |
|---|---|---|
| $100 per barrel | ~95.50 | Sustained Hormuz disruption keeping crude elevated |
| $120 per barrel | ~97.50 or higher | Deeper supply shock, wider CAD, risk aversion rising |
The MUFG range tells you something concrete: if Hormuz disruption pushes crude past the $100 mark, the rupee carries meaningful additional downside from current levels, and that trajectory is model-supported rather than speculative. For anyone holding INR exposure or commodity-linked positions, this converts directional commentary into a set of testable price triggers.
These projections are speculative and subject to change based on market developments. Past performance does not guarantee future results.
The RBI’s intervention firepower and where its limits show
The Reserve Bank of India has not been passive. Its intervention footprint in FY26 is, by any measure, substantial.
According to the Economic Times, the RBI sold more than $53 billion in the spot foreign exchange market in FY26 and built a short forward dollar position exceeding $103 billion. Two senior bankers, cited by Reuters on 28 July 2026, estimated the bank sold $8 to 9 billion in a single Friday session across spot and non-deliverable forward markets.
In the week before 8 September, six bankers told the Economic Times the RBI sold at least $8 billion, with some estimates running as high as $15 billion. This is a record-scale defence.
And then came the inflection point. On 8 September 2026, traders described the RBI’s presence in the session as insufficient to arrest the rupee’s slide, despite that prior track record.
That gap is the whole story. The distance between record intervention and a market verdict that it was not enough tells you this is no longer a question of central bank willingness. It is a question of whether intervention can mechanically offset structural current-account dollar demand at $97 crude.
Two camps read the trajectory differently, and each becomes more credible under a specific condition:
- Downside-risk camp (MUFG, Business Standard): argues the rupee can weaken further even with intervention. Business Standard warns crude spikes could push the rupee down by as much as 10 percent in adverse scenarios. This view strengthens if Brent moves toward the $110 to $120 range.
- RBI-can-stabilise camp (IMF, forex strategist Anil Bhansali): points to FX reserves well above $600 billion and a relatively contained CAD. Bhansali, quoted in The Hindu on 8 September, expects a tight 94.00 to 94.75 near-term range. This view strengthens if crude holds near but not far above $97 and the dollar index eases.
For investors, the value of holding both views is that it distinguishes rupee weakness that intervention will reverse from weakness that reflects a structural imbalance the RBI cannot fully offset without rate changes or a resolution of the oil disruption itself.
The feedback loop that makes this hard to break
The mechanism is self-reinforcing. Higher crude widens the import bill, which raises dollar demand, which weakens the rupee, which raises the local-currency cost of oil further, which deepens both the current account deficit and inflation pressure.
Intervention slows this loop but does not resolve it. If Hormuz disruption persists, the risk is that the loop tightens to a point where rate tightening becomes the only remaining lever, a move that anchors inflation but slows growth.
Oil-driven inflation transmits through a three-stage chain of energy costs, logistics costs, and consumer prices, with oil-importing emerging markets experiencing faster and more severe pass-through than advanced economies; for India, where petroleum accounts for 25-30 percent of the import bill, this sequencing means domestic CPI pressure arrives with a lag that monetary tightening must anticipate rather than react to.
What resolves this, and on what timeline
Resist the urge to end on a single directional call. The rupee’s path from here depends on three observable variables, and watching them in the right order is more useful than any forecast.
- Hormuz vessel traffic recovery. The primary variable. A sustained return to meaningfully higher daily ship counts, against the 130 to 140 peacetime baseline, would signal genuine supply normalisation. Continued single-digit counts lock in the elevated Brent regime.
- Brent price trajectory. The MUFG thresholds of $100 and $120 are the key trigger levels. If Brent holds near $97 or above, the CAD impact accumulates quarter by quarter at roughly 0.3 to 0.4 percentage points of GDP per sustained $10 move.
- RBI policy response. Reserves above $600 billion provide a buffer but not unlimited headroom. The bank faces a genuine trade-off between conserving reserves and defending the currency.
That trade-off is worth stating plainly. Tolerating more rupee weakness conserves reserves but deepens inflation pass-through. Intensifying intervention burns reserves and risks balance-sheet stress, while rate tightening anchors inflation but slows growth.
IMF simulations reinforce the stakes: oil shocks tend to produce higher energy inflation with spillovers to core inflation, followed by monetary tightening.
MUFG outer-bound scenario Brent at $120 per barrel implies USD/INR toward 97.50 or higher, the anchor for how much further the rupee could fall under a deeper supply shock.
If there is one data point to watch first, it is the daily Hormuz vessel count. It is the upstream variable that determines whether the rest of the causal chain intensifies or begins to unwind.
For readers wanting to translate the Hormuz vessel-count signal into a concrete checklist, our deep-dive into the five conditions for genuine Hormuz normalisation covers the specific verification steps, mine-clearance timelines, and insurance-underwriting triggers that must all be satisfied before daily transit volumes can approach pre-crisis levels.
What the Hormuz shock tells you about INR risk in the months ahead
The four-part case is now complete. Hormuz traffic sits at historically suppressed levels of seven ships on 7 September 2026. India is uniquely exposed through routing concentration, with 85 to 90 percent import dependence, roughly half via Hormuz, and petroleum at 25 to 30 percent of the import bill.
The oil-to-rupee transmission is quantifiably active, with the rupee above 95 and Brent near $97. And the RBI’s record defence, over $53 billion in spot sales and a short forward position beyond $103 billion, was judged insufficient on 8 September 2026.
The rupee stabilises under specific, observable conditions:
- A credible Hormuz recovery to meaningfully higher daily vessel counts sustained over time
- Brent retreating below $90 per barrel
- A domestic policy response that absorbs the CAD impact through fiscal or import-tariff adjustment
Until one of those conditions holds, the oil-CAD-rupee feedback loop persists, self-reinforcing and stubborn to break. For an investor deciding whether the rupee near 95 represents value or the start of a deeper move, the answer sits in Kpler’s daily ship count, not in RBI statements or short-term Brent fluctuations. That single number is the most actionable leading indicator of rupee direction in this environment.
This article is for informational purposes only and should not be considered financial advice. Investors should conduct their own research and consult with financial professionals before making investment decisions.