
The national diesel average hit $5.90 per gallon on 8 September 2026, a record. That number alone is not the interesting part.
Here is the part that should stop you: the United States is the world’s largest net diesel exporter, and it is shipping record volumes overseas at the exact moment its own drivers are paying more at the pump than they ever have. Record exports, record domestic prices, at the same time.
That paradox is not an accident, and it is not going away quickly. Three structural forces are driving it. Ukrainian drone strikes have knocked 30-40% of Russian refining capacity offline. The Strait of Hormuz has been effectively closed since 28 February 2026. And US distillate exports surged to an unprecedented 1.884 million barrels per day in August 2026.
These are not seasonal swings. They are dislocations with a timeline measured in quarters.
Here is what the data actually tells you: where prices are headed, why America exports diesel while charging record prices at home, and what all of this means if you hold transportation stocks, own consumer goods names, or are weighing energy sector exposure.
What the record actually looks like on 8 September 2026
Start with the two numbers, because they are not the same and the difference matters. The daily national average hit $5.90 per gallon on 8 September 2026. The Energy Information Administration’s official weekly figure, which averages retail prices across a full week rather than a single day, came in lower at $5.599 per gallon for the week of 31 August 2026. Daily spot data moves faster than the weekly official series, so the $5.90 print is the leading edge of where the weekly average is heading.
Now the part the national headline hides. “US diesel prices” is a single number stretched over dramatically different realities.
| Region | Price ($/gal) |
|---|---|
| US National Average | $5.599 |
| California | $7.218 |
| West Coast | $6.497 |
| Midwest | $5.571 |
| Rocky Mountain | $5.555 |
| Gulf Coast | $5.360 |
California drivers paid $7.218 per gallon in the week of 31 August, nearly two dollars above the Gulf Coast at $5.360. That spread is why exposure is not uniform. A Midwest-based trucking operator faces a materially different cost environment than a California logistics firm, and the national average tells you nothing about which one you are actually holding.
Then there is where the market thinks this goes next.
Prediction market signal Kalshi, a regulated prediction market, assigns a 69% probability that US diesel prices exceed $6.40 per gallon before year-end. This is the market’s forward view expressed as a bet, not an analyst forecast.
Here is the detail that should recalibrate your thinking. Early 2026 consensus forecasts expected diesel to ease toward $3.50-$3.60 per gallon by now. The reality is $5.90. That gap of more than two dollars tells you this price event was not in the baseline models, which means the forces driving it are genuinely new and were not priced into anyone’s longer-range planning.
The diesel futures divergence from crude was already visible in mid-July 2026, when US diesel futures surged approximately 20% in a single week while WTI held near $79, a structural signal that physical delivery stress in refined products was materialising well before the September pump price record.
When big ASX news breaks, our subscribers know first
Two wars, one refining crisis: how global supply collapsed
The gap between forecast and reality has a cause, and it is not a single event. It is two conflicts hitting the same part of the supply chain from opposite ends of the map.
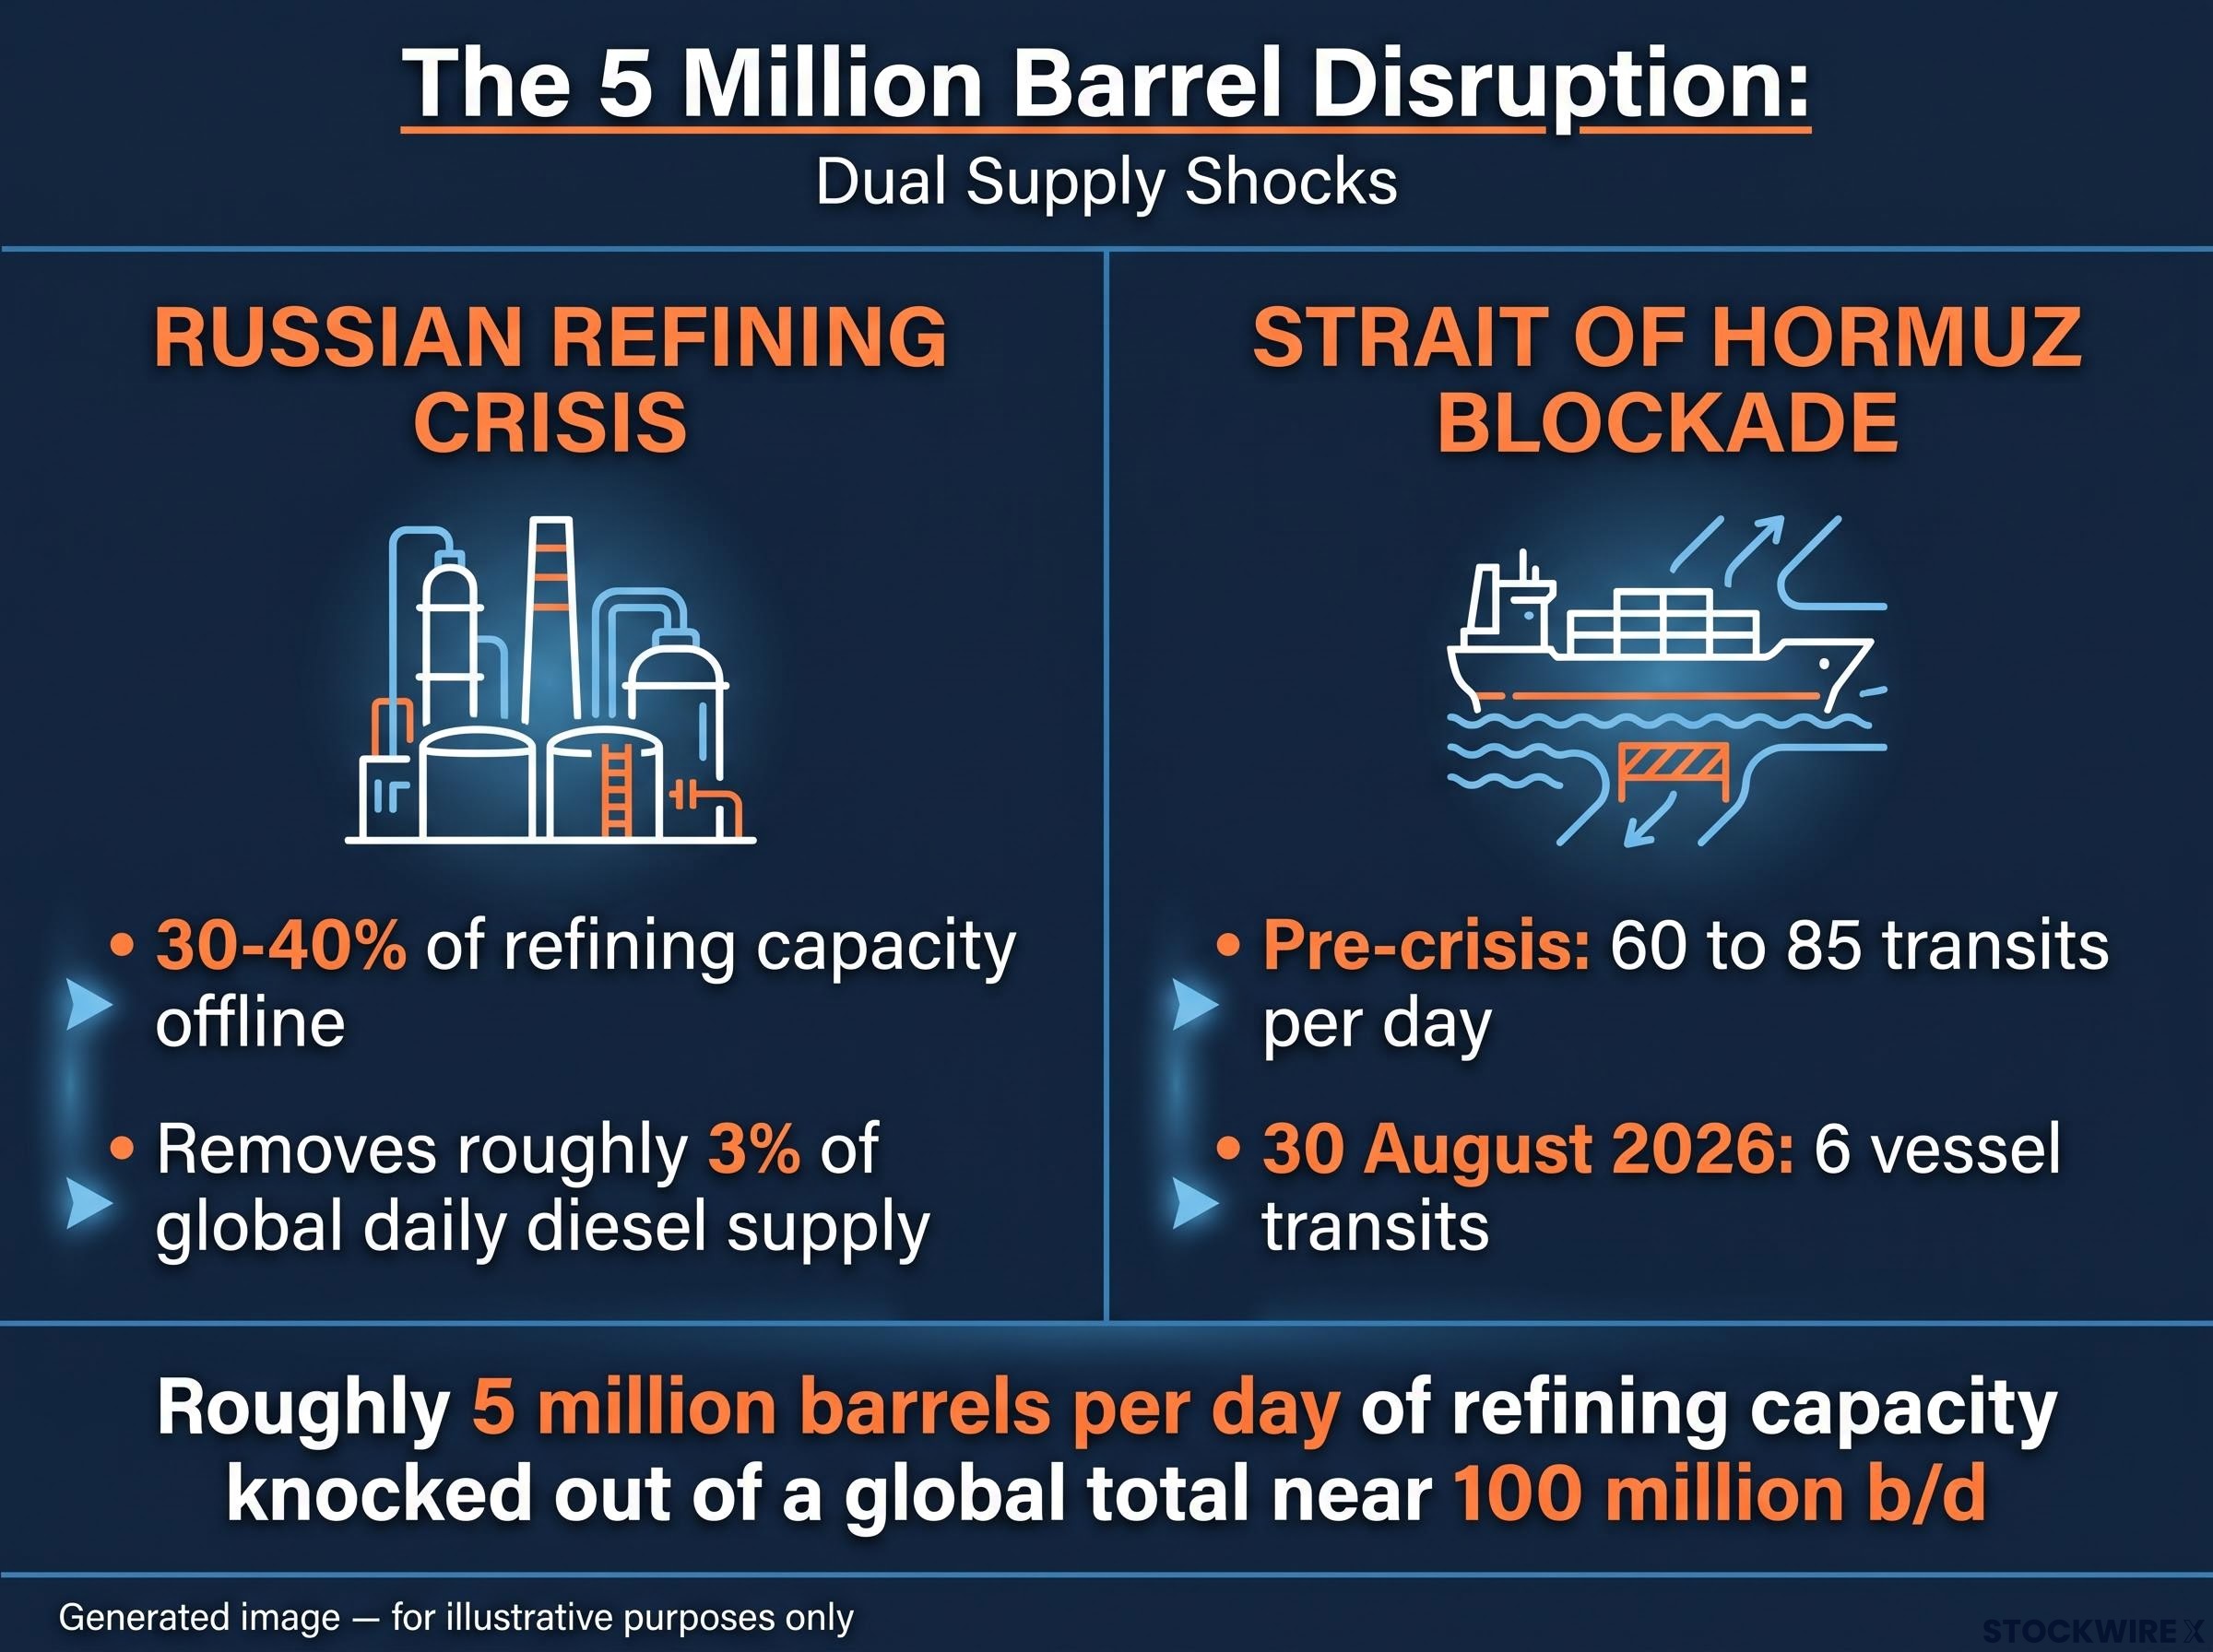
Start in Ukraine. Drone strikes, reportedly backed by European and potentially American support, have hammered Russian oil infrastructure and put an estimated 30-40% of Russia’s refining capacity offline. Russia responded by suspending diesel exports entirely to preserve supply for its own agriculture, long-haul transport, and military.
That single decision removed roughly 3% of global daily diesel supply from the market. Russian exports historically accounted for 15-20% of the globally traded seaborne diesel market, a market that totals around 7 million barrels per day.
Here is why the strikes matter more than they might first appear. Attacking a refinery is considered more economically damaging than attacking a crude oil source, because crude has no use until it is processed, and crude reserves exist at a scale that finished diesel stockpiles simply do not. Damage a refinery and you remove the ability to make diesel, not just the raw material.
The Strait of Hormuz: from chokepoint to near-closure
The second front is the Middle East, and the numbers there are stark.
- Pre-crisis baseline traffic through the Strait of Hormuz averaged 60 to 85 transits per day.
- By 30 August 2026, trackers reported just 6 vessel transits in a single day.
- Cumulatively, only 3,456 vessels had crossed in 172 days as of 17 August 2026, roughly 20% of what normal traffic would have been.
The waterway has been effectively closed since 28 February 2026. It briefly reopened on 21 April 2026, then shut again the following day. US forces struck three Iranian tankers after Iranian missile fire directed at American warships, and Qatar’s Ras Laffan facility remains offline, pushing the disruption into European gas markets as well.
Hormuz transit data from mid-August 2026 captures the gap between Iran’s official declarations and actual commercial shipping: just 14 vessels completed the crossing in a single 24-hour window against a pre-war baseline of 120-140 per day, and war-risk insurance premiums running at 30 times normal rates mean a diplomatic ceasefire alone cannot restore flows.
Put the two fronts together and roughly 5 million barrels per day of refining capacity has been knocked out of a global total near 100 million b/d.
Goldman Sachs crack spread forecast Goldman Sachs forecasts Q4 2026 US diesel crack spreads of $50-$56 per barrel, with diesel expected to trade about $63 above Brent crude in the US by late next year. The crack spread is the profit margin refiners earn from turning crude into diesel.
This is the analytical frame that matters most. The shortfall is being generated at the refining and transit layer, not at the crude layer. That is why falling crude prices have not fed through to lower pump prices, and why they will not until refining capacity comes back online. If you are assessing energy positioning, refining equities and crack spread exposure tell a very different story than crude-linked positions, and Goldman’s $50-$56 forecast puts a number on the gap.
The export paradox: why America ships diesel abroad while prices hit records at home
So the US is short on supply and paying record prices. Yet it is exporting diesel at a record pace. Both things are true at once, and the reason is structural, not political.
Start with the scale. US distillate exports averaged roughly 1.30 million b/d across both 2024 and 2025. By August 2026, weekly exports surged to an unprecedented 1.884 million b/d, about 22% above the same week a year earlier. That makes the US the world’s largest net diesel exporter during a domestic price record.
Domestic inventories are tight as a direct result. Current US distillate inventories sit 12% below the five-year average, while broader OECD diesel stocks stand at just 27 days of supply. Production gains are being routed overseas faster than stockpiles at home can recover.
Why an export ban would not solve the problem
The obvious political fix is to restrict exports and trap supply at home. The President holds the statutory authority to do exactly that through an emergency declaration, because diesel is classified as both a military fuel and an agricultural necessity. Biden-era officials studied similar limits in 2022 but never implemented them.
The current administration has ruled it out. Energy Secretary Chris Wright, Vice President JD Vance, and White House spokespeople have all confirmed restrictions are “not on the table.” The industry argues that a ban would make things worse, not better, for three reasons.
- Global stabilisation role. US refiners are currently filling the supply gap left by Russia and the Middle East. Pulling that supply would worsen conditions for allies.
- Coastal state prices. California and the Northeast import diesel regardless of national production, because they are not fully integrated into the national pipeline network. Disrupting global trade flows would raise their prices, not lower them.
- Refinery utilisation. Cutting off the export market reduces how hard refineries run, which can tighten domestic supply further rather than easing it.
There is a mechanical dimension too: every 1% reallocation of global refining capacity toward diesel addresses roughly 15% of the current seaborne shortfall, which is why keeping US refiners running at full tilt matters globally.
For you as an investor, the export debate is a low-probability but high-impact variable. Any change in administration posture, however unlikely, would be a sudden negative shock to refining margins and a potential relief event for transportation stocks. It is worth monitoring precisely because it sits at the tail of the distribution.
What high diesel does to the US economy, and which stocks feel it most
The pump price does not stay at the pump. It becomes a grocery receipt and, eventually, an earnings miss. The transmission mechanism is worth understanding in detail.
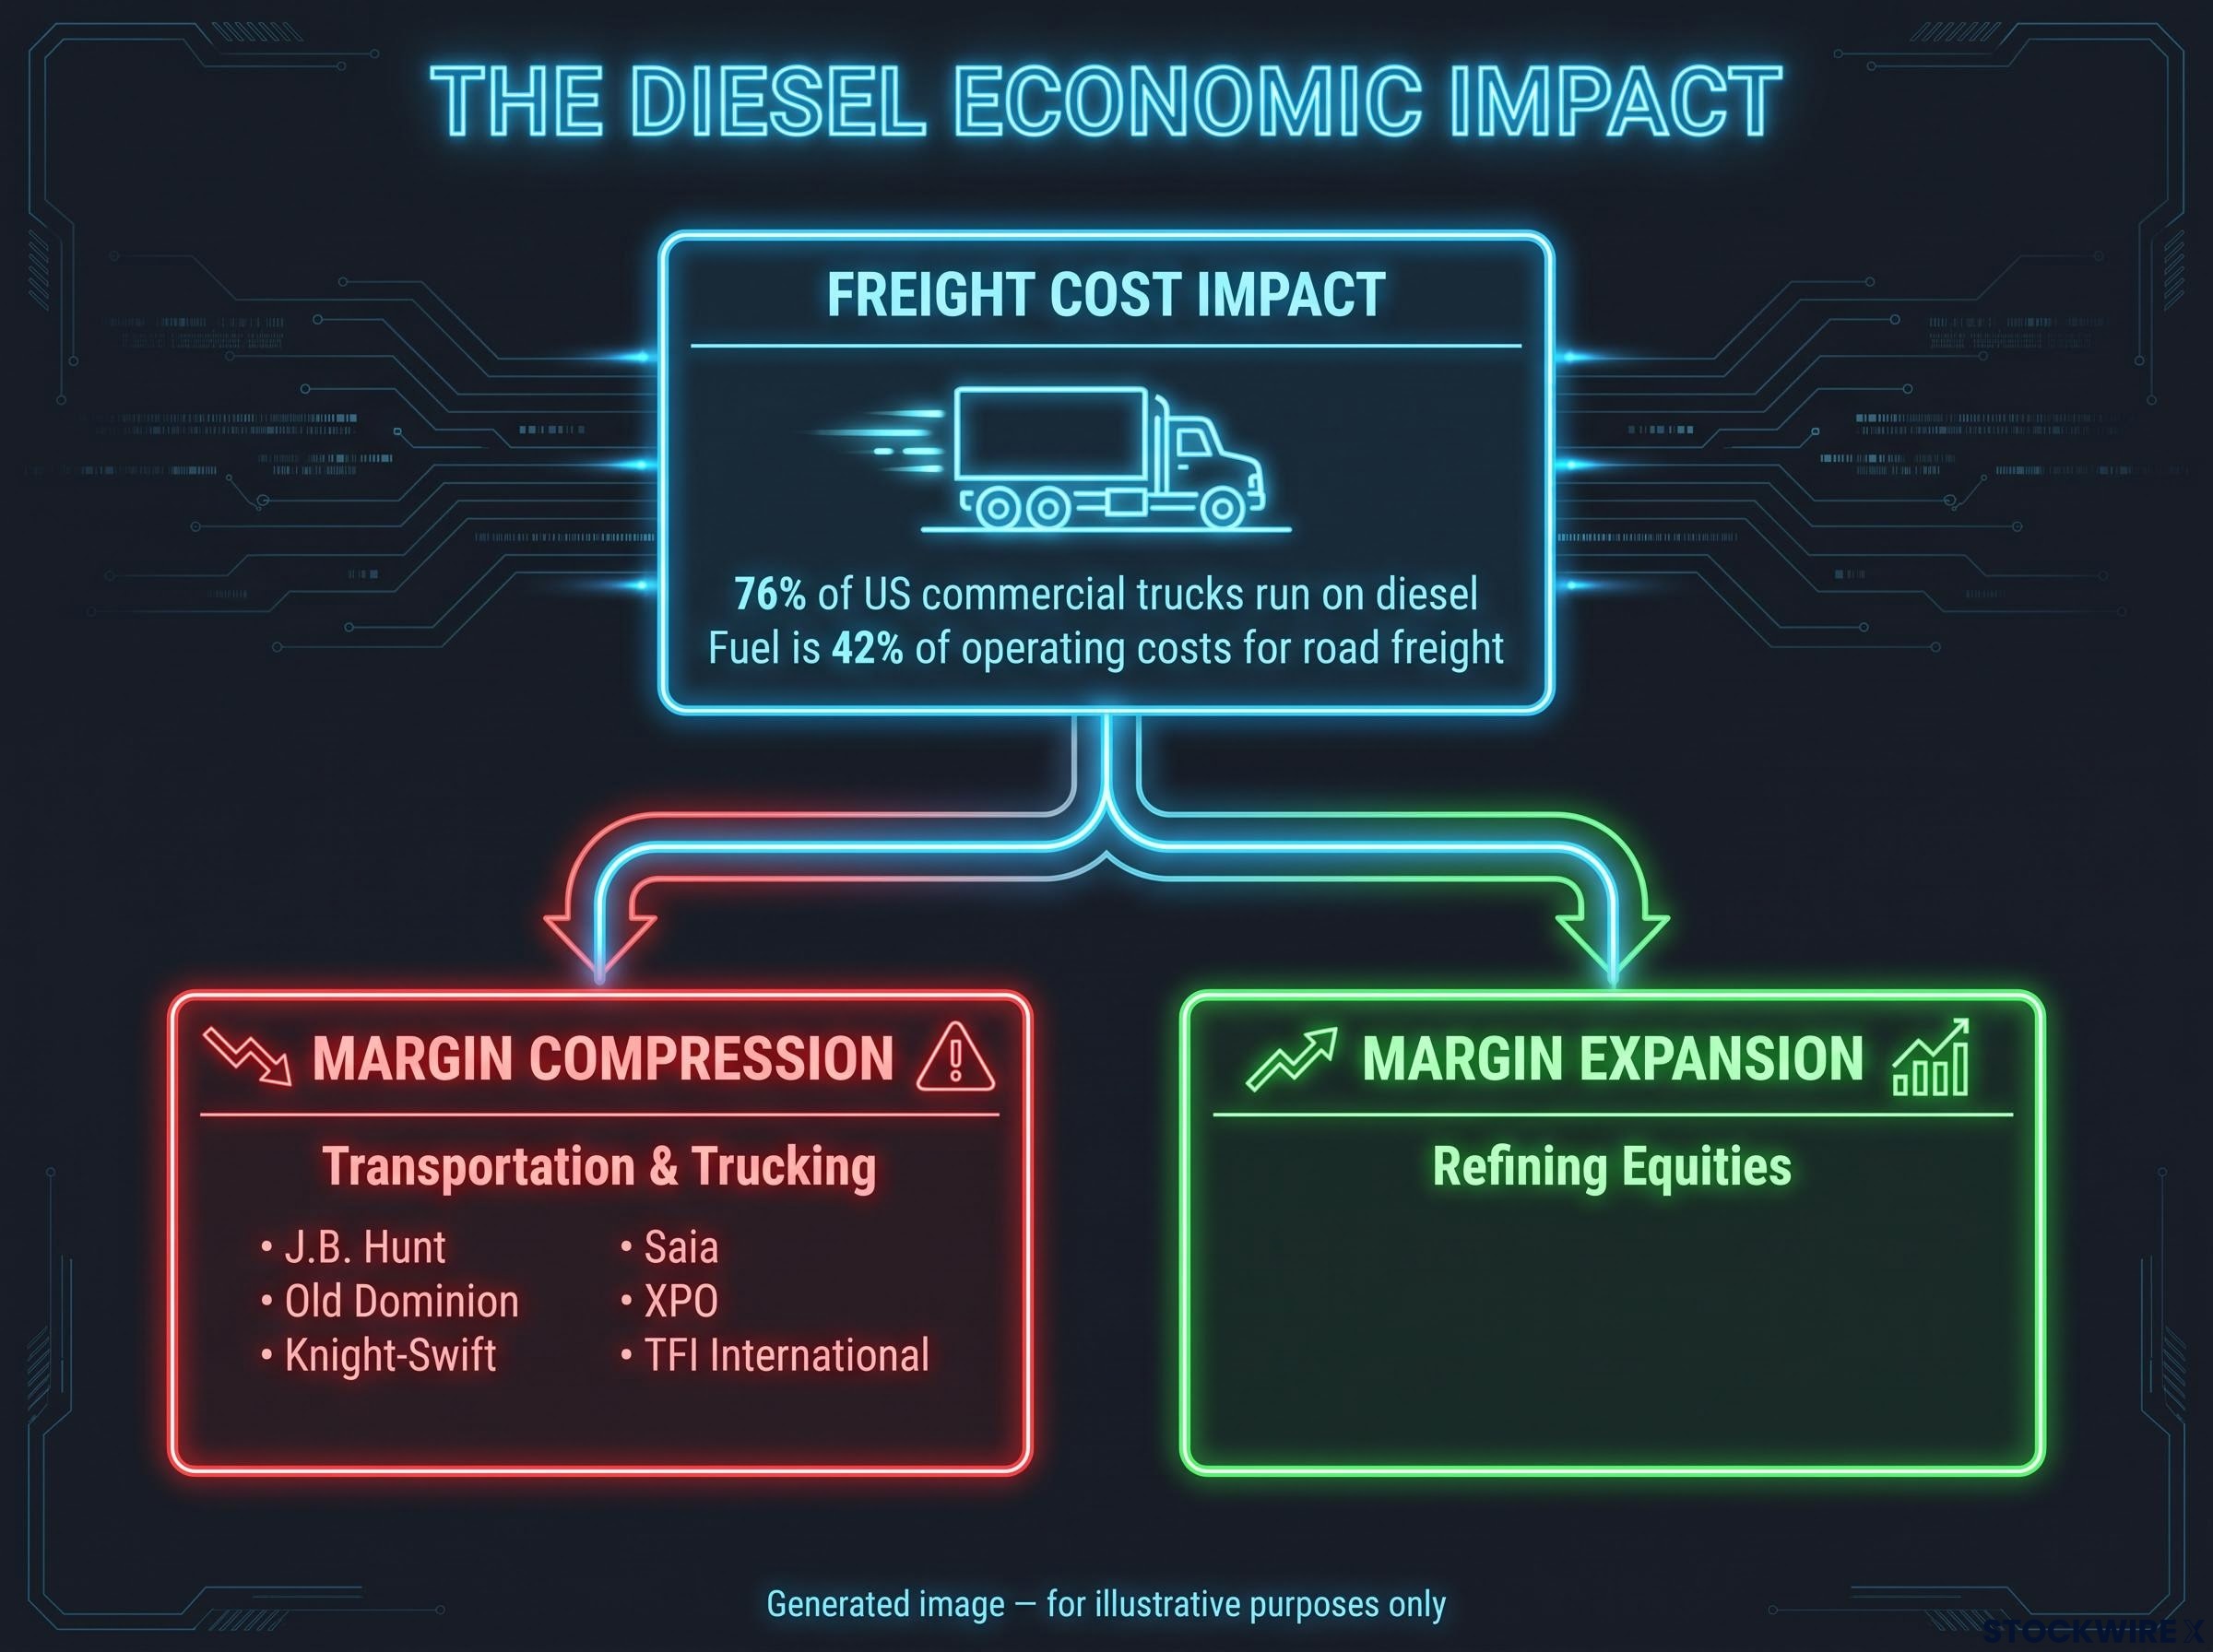
Diesel is the foundational energy input for US commercial freight. Roughly 76% of US commercial trucks run on it, and fuel represents about 42% of operating costs for road freight. When diesel rises, the cost of moving nearly everything rises with it.
The single most important statistic here Diesel prices explain 46% of the variation in the producer price index for truck transportation. Diesel is not one input among many for freight. It is the dominant cost variable.
That 46% figure tells you something concrete: sustained prices above $5.50 will mechanically keep freight inflation elevated no matter what happens to other cost components. You cannot engineer that away with efficiency gains.
The inflation data already shows it. In April 2026, a 3.8% rise in energy prices accounted for more than 40% of the entire US consumer price index increase for the month. The “other motor fuels” category, which includes diesel, surged 17% month-on-month. Significant fuel price hikes historically carry a direct CPI impact of 36-48 basis points.
CPI measurement gaps systematically understate the war-driven energy toll: Dallas Fed estimates put US headline PCE approximately 0.6 percentage points above a no-war baseline on a Q4/Q4 2026 basis, and war-driven fuel costs embedded in airfares and imported goods appear in core inflation rather than the energy category, obscuring the true transmission channel.
For the equity market, this splits into two opposite trades.
| Stock Category | Directional Impact |
|---|---|
| Transportation and trucking | Margin compression from elevated fuel costs |
| Refining equities | Margin expansion; Goldman Sachs recommends overweight |
The transportation names carrying the fuel-cost weight include:
- J.B. Hunt
- Old Dominion
- Knight-Swift
- Saia
- XPO
- TFI International
On the other side, elevated crack spreads and prolonged supply constraints have driven strong refining profits, which is why Goldman Sachs recommends overweighting refiners.
If you hold consumer staples, logistics, or e-commerce infrastructure, this is not abstract macro risk. It is direct margin pressure on companies whose earnings models were built on a fuel environment that no longer exists.
Where prices go from here depends on variables few analysts are modelling correctly
The forecasts keep undershooting, and that pattern itself is the signal.
Consider the baseline. The EIA forecasts average 2026 retail diesel around $4.80-$4.85 per gallon, with prices staying above $5 through Q2 2026 before gradually declining below $4 by Q3 2027. The 8 September reality of $5.90 sits above both bands. Early 2026 consensus, remember, expected $3.50-$3.60. Official models have consistently underestimated the disruption.
That consistent undershoot tells you the models are not yet treating the refinery capacity loss as a semi-permanent condition. The market, through crack spreads and prediction markets, is pricing a more sustained disruption than the agencies are publishing.
Three variables will most directly determine near-term direction. Watch these rather than waiting for the next analyst report.
- Hormuz closure duration. Track the daily transit counts. A sustained return toward the 60-85 baseline would ease pressure materially.
- Russian refinery reconstruction. How quickly Russia repairs or adapts around the damaged 30-40% of capacity determines when 3% of global supply returns.
- US export policy posture. Any shift from the current “not on the table” position would move refining and transportation stocks in opposite directions overnight.
The Kalshi market’s 69% probability of prices exceeding $6.40 before year-end reflects a straightforward read: the structural forces are judged more likely to intensify than to resolve. For that probability to fall materially, at least one of the three variables above would need to move in the market’s favour.
For readers wanting to model a longer disruption horizon, our deep-dive into the 2027 supply normalisation timeline examines Saudi Aramco’s warning that refinery and shipping normalisation may not arrive until next year and the structural implications for global distillate balances.
This article is for informational purposes only and should not be considered financial advice. Investors should conduct their own research and consult with financial professionals before making investment decisions. Past performance does not guarantee future results, and financial projections are subject to market conditions and various risk factors. Forward-looking statements are speculative and subject to change based on market developments.
Three variables to watch before the next price move
Here is the core of it. This is a refinery-layer and transit-layer supply shock, not a crude-layer shock. That distinction matters because the standard levers, Strategic Petroleum Reserve releases and production increases, do not fix a shortage of processing capacity or a blocked chokepoint. As long as refineries stay offline and the Strait of Hormuz stays restricted, more crude does not become more diesel.
For your portfolio, the practical read is that the divergence between refining and transportation equities is likely to persist while crack spreads stay elevated. Goldman’s Q4 2026 forecast of $50-$56 per barrel is the quantitative anchor for that gap.
The inventory picture reinforces it. With domestic distillate stocks 12% below the five-year average and OECD supply at 27 days, prices cannot fall quickly even if geopolitical risk eases partially. The cushion simply is not there.
You leave with a framework, not a prediction. Track Hormuz transit counts, Russian refinery reconstruction, and US export policy. Those three signals tell you where prices are heading before any headline does.