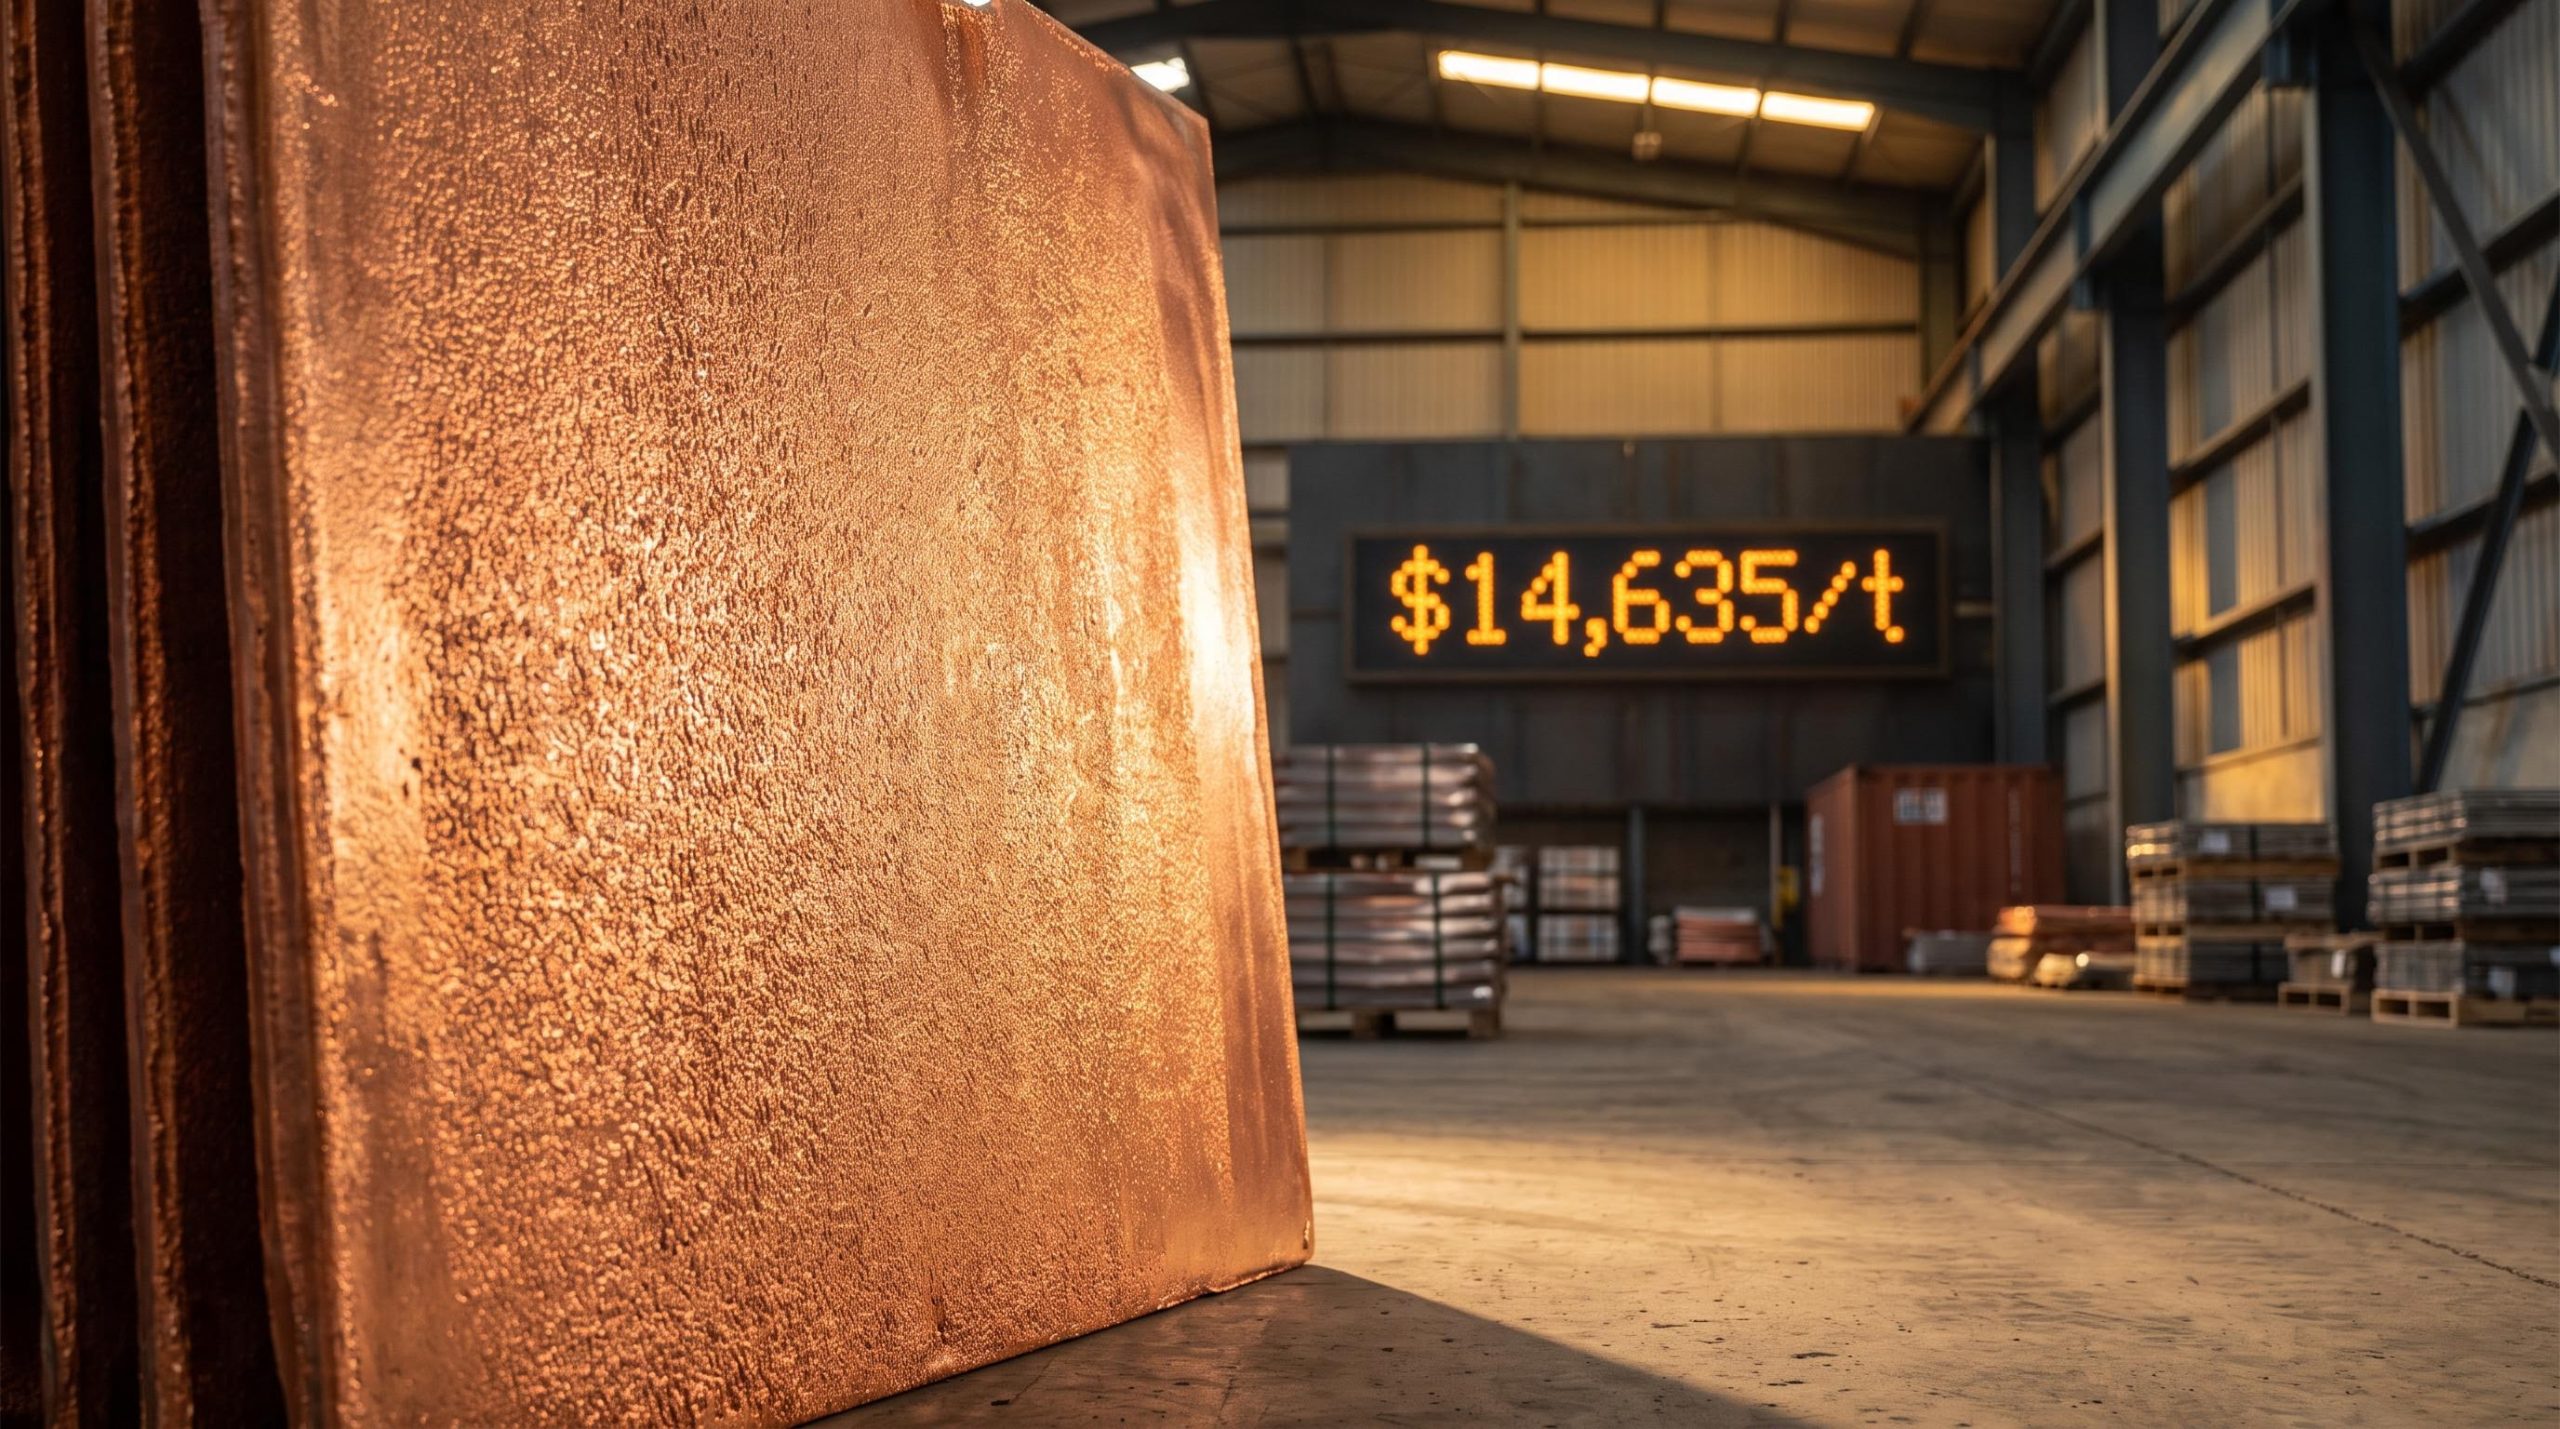
Copper just broke its own record for the third time in nine months, and the reason has almost nothing to do with the world suddenly needing more wire. It is climbing because the US government is threatening tariffs that do not yet exist, on a commodity the US cannot yet produce at scale. That tension, between a policy threat and physical reality, is the defining feature of commodity markets right now.
It shows up everywhere you look. China’s trade surplus with the US has widened to its broadest point since Trump’s return to office, copper is pricing in a levy that has not landed, zinc is quietly tightening in parallel, and China’s oil buying is running at record volumes. These are not four separate headlines. They are one interconnected system under stress, with the same country sitting at the centre of most of it.
This maps the mechanics connecting those four signals, so you can separate the policy-driven noise from the structural shifts that will outlast any single tariff cycle.
The surplus that tariffs cannot close
Start with the number that is supposed to be shrinking. China’s trade surplus with the US reached $29.18 billion in August 2026, according to customs data reported on 8 September 2026. That is up from $28.03 billion in July 2026, and it represents a 44% expansion on the same period a year earlier.
Sit with that figure for a moment. The entire stated rationale for tariffs is to narrow this gap, and the gap is doing the opposite of narrowing.
The mechanism is not mysterious once you break it into pieces. Three structural escape valves let the surplus keep widening even as duties climb:
- Front-loading: Buyers rush to import ahead of tariff deadlines, pulling future demand into the present.
- Third-country rerouting: Goods move through ASEAN, Latin America and other intermediaries to reach the US market indirectly.
- Product exemptions: Laptops, tablets and smartphones remain largely untouched by the tariff schedule, leaving huge trade segments intact.
Here is where the analysis gets sharper. Research from the European Central Bank and Global Trade Alert draws a line between two different things: bilateral decoupling, which is real and measurable, and broad-based trade diversion, which is limited. US-bound Chinese shipments have genuinely fallen. China’s overall export machine has not.
The numbers make the point cleaner than any argument. Global Trade Alert estimates that roughly $150 billion of Chinese exports was redirected away from the US in 2025, a figure that sounds enormous until you realise it equals just 0.6% of global goods trade. Capital Economics found that China’s export share to the US dropped by about 4 percentage points, while rerouting through third countries clawed back only 0.5 percentage points of that loss.
Only about one-eighth of the lost direct exports were recovered through indirect routing, according to Capital Economics. The other seven-eighths simply found different buyers.
Allianz calculates that up to 64% of Chinese exports to the US could theoretically reroute through other Asian countries, though the logistics would strain ports well before that ceiling was reached. And despite reduced US access, China’s global trade surplus topped $1 trillion for the first time in 2025.
| Month | Surplus (USD billions) |
|---|---|
| June 2025 | $26.57 |
| July 2025 | $23.74 |
| June 2026 | $28.90 |
| July 2026 | $28.03 |
| August 2026 | $29.18 |
The Peterson Institute for International Economics notes the average US tariff on Chinese imports rose 26.8 percentage points in Trump’s second term. That 44% year-on-year surge in the bilateral surplus tells you tariffs are reshaping where trade flows, not how much of it there is. If you are positioning for a genuine decoupling of China from global trade, you are working from a flawed premise.
When big ASX news breaks, our subscribers know first
Why copper is pricing a tariff that has not landed yet
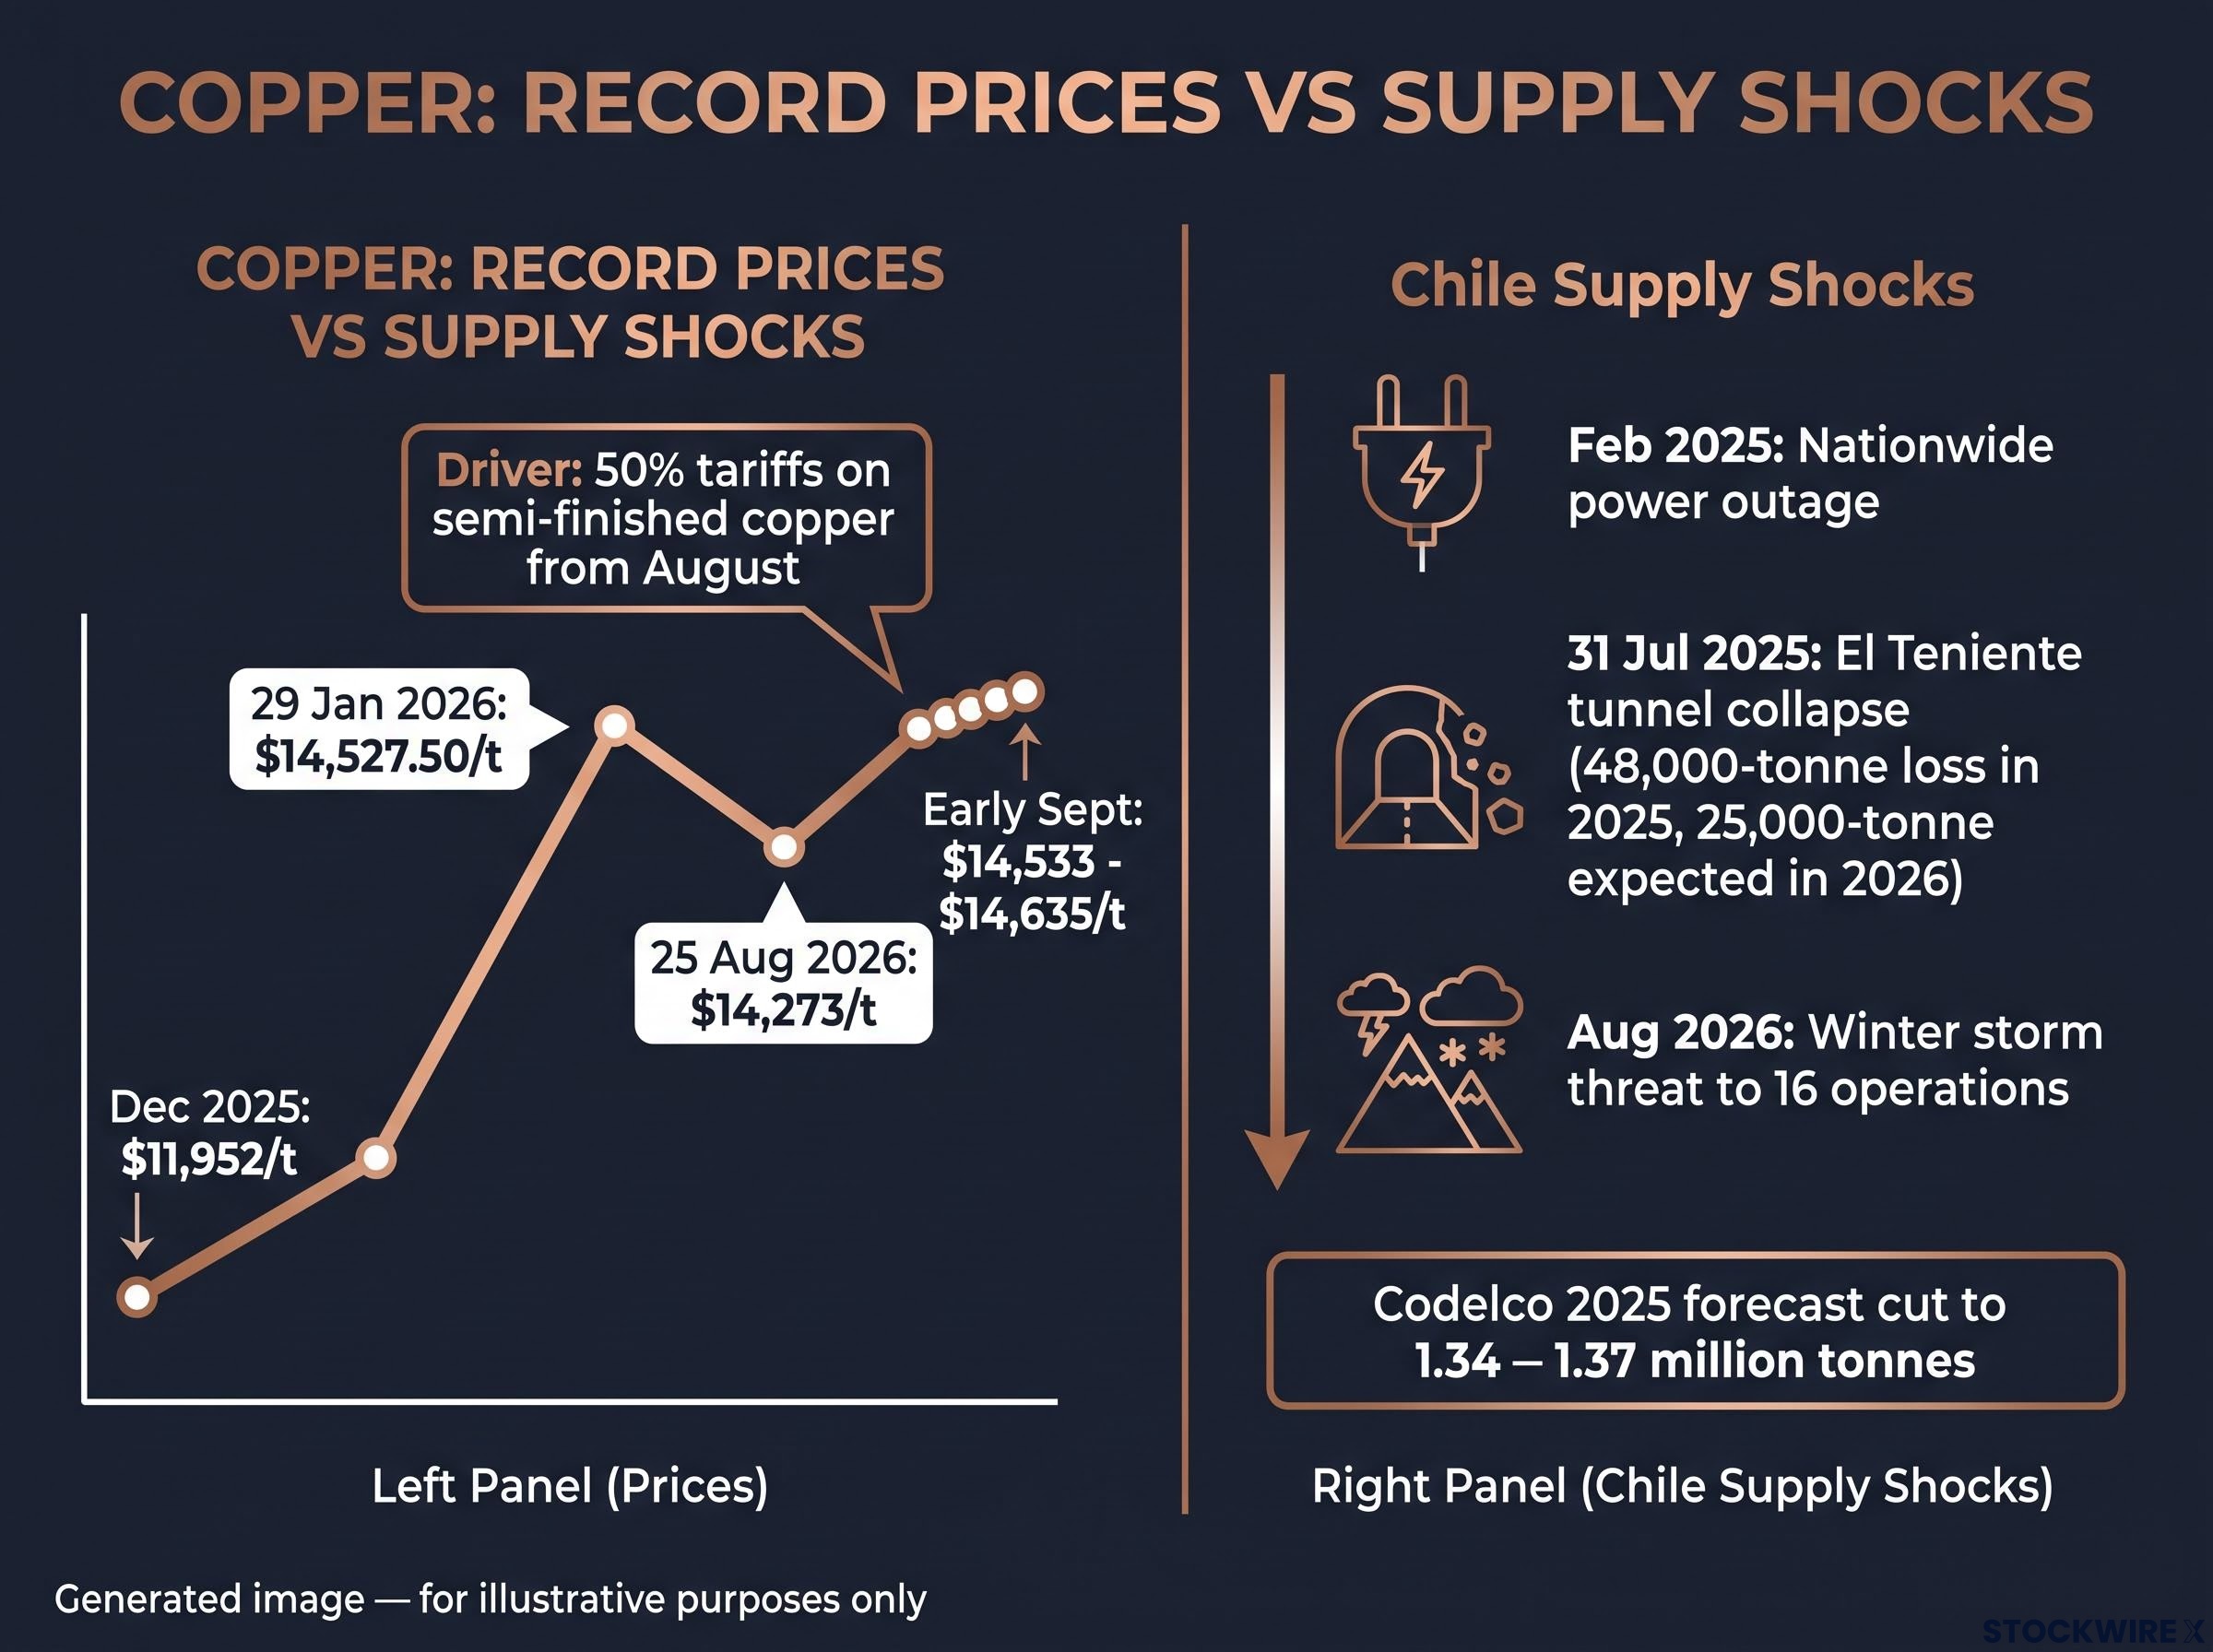
Now to a price that should not exist if fundamentals alone were in charge. LME three-month copper closed at an all-time high of $14,273 per tonne on 25 August 2026, then pushed into fresh record territory in early September, touching a range of roughly $14,533 to $14,635 per tonne. That extends a record chronology running from $11,952 per tonne in December 2025 through a $14,527.50 intraday peak on 29 January 2026.
Reuters put the paradox plainly on 25 August 2026: the prospect of US import tariffs could drive copper to records “even though there is no global shortage.”
No global shortage. Record prices. That combination only makes sense once you separate the two engines driving the market: inventory redistribution and genuine supply loss.
How the tariff-stockpiling engine works
The first engine is pure repositioning. S&P Global’s Ken Hoffman told Platts that 50% tariffs on semi-finished copper imports took effect from August, with a stated intention to extend them to unwrought copper by 2027. That policy has triggered what he described as a large increase in copper flows into the US, for inventory rather than end-use.
The mechanism matters. US buyers pull copper out of LME warehouses ahead of the anticipated levy, which creates scarcity everywhere outside North America without reflecting a single unit of new end-use demand. The metal has not disappeared. It has just relocated.
That is why this leg of the rally is fragile. Once US stockpiles fill up or tariff policy shifts, the redistribution reverses, and the scarcity outside America eases. You are looking at a price signal that can turn quickly, and that asymmetry deserves real weight in any positioning decision.
Chile’s compounding supply problems
The second engine is a genuine supply story, concentrated in Chile, and it stacks several discrete shocks on top of each other. The most quantitatively documented is the tunnel collapse at Codelco’s El Teniente mine on 31 July 2025. Fastmarkets, citing Codelco’s own chairman during LME Week, revised the 2025 production loss up to 48,000 tonnes, with a further 25,000-tonne reduction expected in 2026. That prompted Codelco to cut its 2025 forecast to 1.34 to 1.37 million tonnes, down from 1.37 to 1.40 million tonnes.
Two more risk events compound the picture. A nationwide power outage in February 2025 temporarily cut electricity to major mines including Chuquicamata and El Teniente, and in August 2026 CRU Group flagged a severe winter storm threatening output at 16 copper operations. Chile’s 2026 output target of 5.5 to 5.7 million tonnes is now increasingly at risk.
| Driver | Type | Price Impact Direction |
|---|---|---|
| El Teniente tunnel collapse | Supply | Upward |
| US tariff stockpiling | Inventory redistribution | Upward, short-term |
| Chile nationwide power outage | Supply | Upward |
| Winter storm threat | Supply | Upward risk |
| Tariff clarity or rollback | Demand signal | Downward risk |
A Reuters analyst poll on 29 January 2026 raised the average 2026 copper forecast above $11,000 for the first time, but the same analysts warned of speculative excess and expected averages well below record highs. That gap between the forecast and the record tells you which engine is dominant right now: redistribution, not consumption. Knowing which engine is running is what separates a tactical trade from a structural allocation.
What zinc’s quiet deficit tells you about the broader metals complex
Copper is loud. Zinc is not, and that is precisely why it is worth reading. The tightness pattern showing up in copper is not an isolated event; it is part of a broader base-metals complex under structural stress, and zinc offers corroborating evidence.
Then it complicates the story. According to ILZSG data summarised in February 2026, the global refined zinc market ran a deficit of 33,000 tonnes in 2025, smaller than the 69,000-tonne shortfall in 2024. The forecast deficit for 2026 is roughly 19,000 tonnes. The complex is tightening broadly, but zinc specifically is on a rebalancing path.
Part of that rebalancing is fresh mine supply coming online. Three additions in particular are ramping up:
- Aripuanã (Brazil): A relatively new operation contributing incremental concentrate supply.
- Kipushi (DRC): A high-grade project adding to global output.
- Ozernoye (Russia): A large-scale addition helping lift mine production, which ILZSG reported rose 4.8% in 2025.
The single most actionable data point sits in the physical market rather than the balance sheet.
A $139 per-tonne physical premium in Western markets is the price of Western tightness, and it tells you the strain is geographically concentrated in ways the headline deficit figure does not capture.
If your zinc exposure sits outside China, you are facing a genuinely different supply picture than the global deficit number implies.
LME inventory dynamics and the East-West split
The inventory data confirms the split. Reuters reported that LME zinc stocks rebounded from below 50,000 tonnes in October 2025 to 144,000 tonnes by the end of that year, before retreating to 100,525 tonnes of registered inventory as of 2 September 2026, with nearly one-third sitting in cancelled warrants awaiting load-out.
Reuters framed the divide in one line: well-supplied in China, still tight in the rest of the world. That East-West split is the key takeaway, because it means a single global figure can hide two entirely different markets.
For an investor whose primary exposure is copper, zinc’s narrowing deficit is worth watching anyway. It is a useful leading indicator for what copper may eventually look like once its own supply responses and policy adjustments work through.
China’s oil buying and what record imports signal for commodity demand
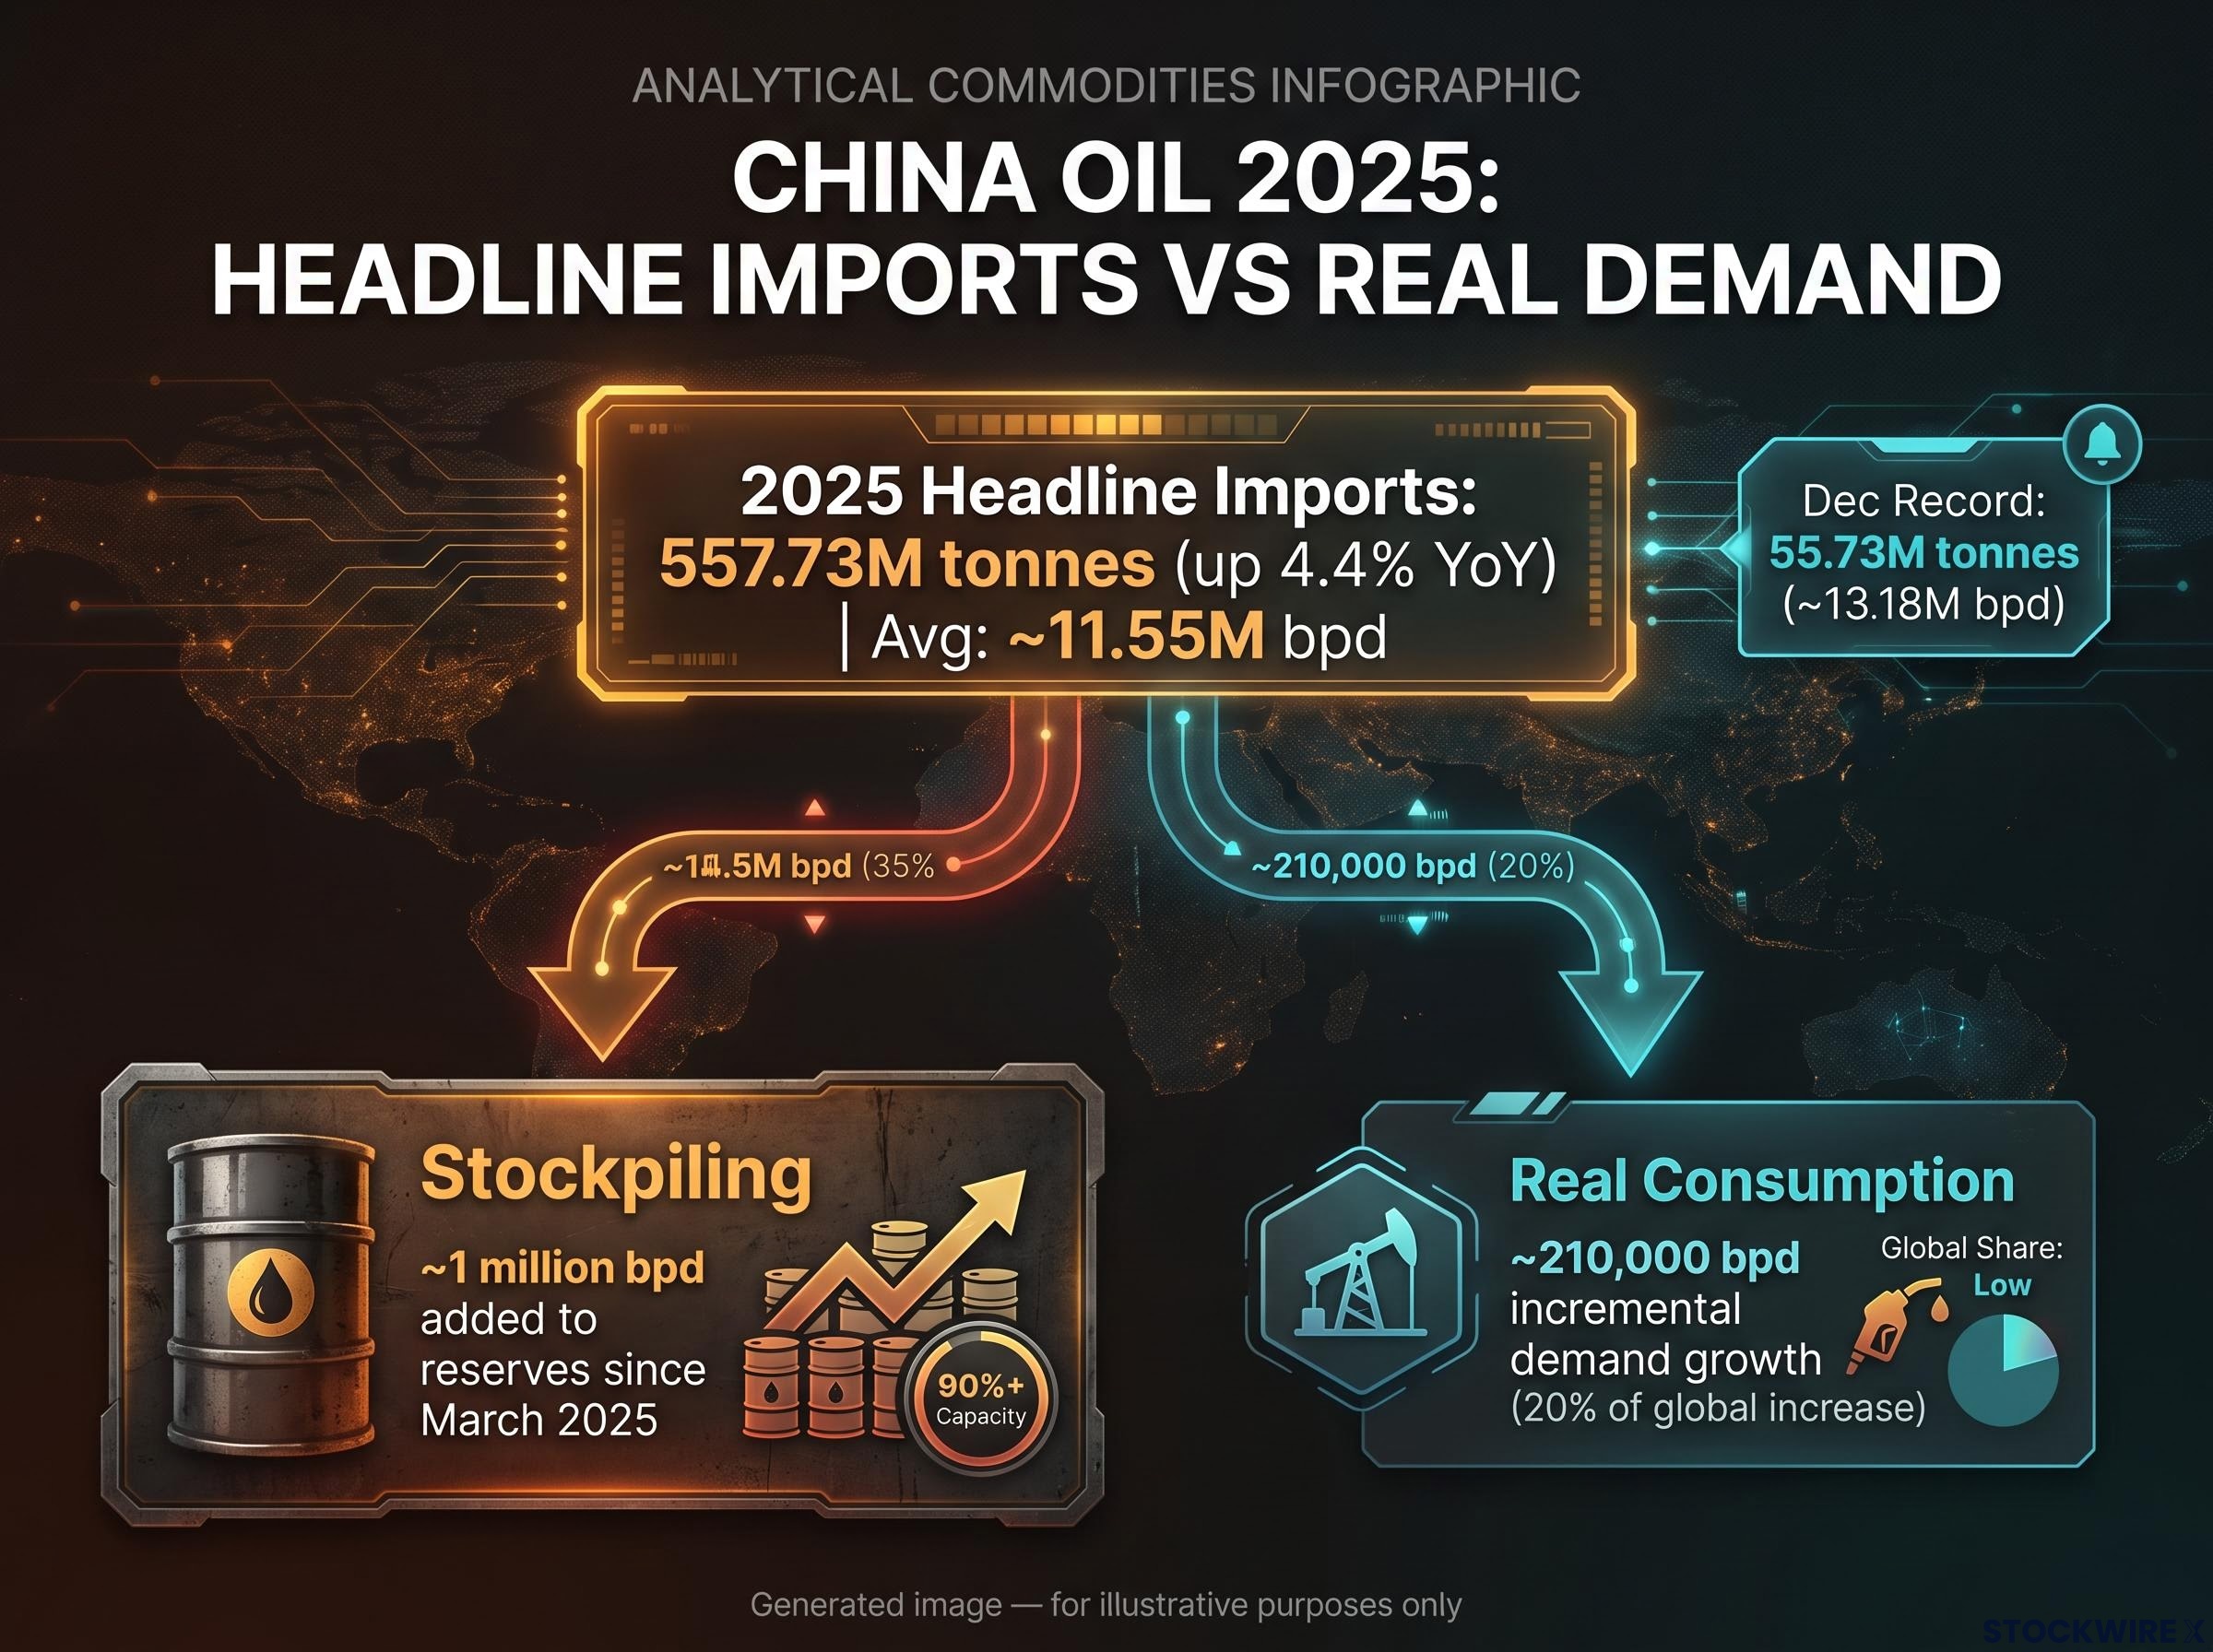
The volume is what makes you stop. China imported 557.73 million tonnes of crude in 2025, up 4.4% year-on-year, with December inflows hitting a record 55.73 million tonnes, about 13.18 million barrels per day. Across the full year, that averaged roughly 11.55 million barrels per day.
That scale makes China the single most consequential demand variable in the oil market, full stop.
At 11.55 million barrels per day in 2025, China’s imports covered about two-thirds of its own consumption and represented 16% of global demand, according to Reuters. That is the profile of an oil fortress, not a marginal buyer.
Here is where the interpretive frame has to shift. The instinct is to read record imports as record consumption, but that is not what is happening. The Columbia University Center on Global Energy Policy estimates China has been adding roughly 1 million barrels per day to reserves since March 2025. Bloomberg described this stockpiling in December 2025 as cushioning global markets from a looming surplus while masking weaker underlying consumption.
The IEA puts China’s incremental demand growth at about 210,000 barrels per day in 2025, roughly 20% of the global increase, even as its growth rate slows. Strip out the stockpiling, and the consumption story is softer than the import headline suggests.
That leaves three signals worth tracking:
- Structural demand scale: At 16% of global demand, China’s baseline appetite is not going anywhere.
- Policy-driven stockpiling: Reserve accumulation is masking the real consumption trajectory.
- Latent drawdown risk: If China switches from importing to drawing down reserves, that becomes a price-suppression variable global markets are not currently pricing.
The gap between record imports and slower real consumption is the key risk here. If China starts drawing down rather than buying, commodity markets face a demand-signal reversal that today’s prices do not reflect. That hidden demand floor has been supporting prices, which is exactly why it needs watching alongside the headline figures.
Separating the structural from the cyclical before the next policy move
Pull the four threads together and a decision framework emerges. Some features of this environment are durable and worth positioning around. Others are policy-contingent and worth hedging against or simply waiting out. The whole game is telling them apart.
The structural forces are the ones that survive any tariff cycle. China’s manufacturing overcapacity and export dominance are structural, which is why the surplus keeps widening regardless of political temperature. Long-term electrification, EV adoption and AI infrastructure keep a real floor under copper demand, and declining ore grades in Chile create multi-year supply constraints.
The cyclical forces are reversible. Tariff-driven copper stockpiling redistributes existing metal rather than reflecting new demand. China’s oil inventory accumulation masks slower consumption. And zinc’s deficit trajectory, from 69,000 tonnes in 2024 to 33,000 tonnes in 2025 to a forecast 19,000 tonnes in 2026, is the clearest quantitative example of a market moving from cyclical tightness toward rebalancing.
| Variable | Nature | Current Signal | What Changes It |
|---|---|---|---|
| China-US trade surplus | Structural | Widening (44% YoY) | Domestic consumption shift in China |
| Copper price premium | Cyclical | Record highs, no shortage | Tariff clarity, US stockpile capacity |
| Zinc deficit | Cyclical | Narrowing, rebalancing | New mine supply ramp-up |
| China oil imports | Mixed | Record volume, soft consumption | Reserve drawdown decision |
The normalisation path is one several analysts converge on. Goldman Sachs argued in December 2025 that copper would moderate as supply responded and tariff uncertainty cleared, a view already overtaken by subsequent price action, which is itself a warning about forecasting precision here. History offers two reference points: copper’s 2008 record collapsed in the financial crisis, and its 2011 record gave way to a multi-year correction as new supply caught up.
Those precedents do not tell you today’s rally will collapse. They tell you to be precise about which part of the price you are paying for, structural demand or cyclical distortion, because those two components demand different holding horizons.
Three variables, in order of importance, form your watchlist:
- US tariff policy resolution: Clarity reduces pre-emptive buying and deflates the copper premium fastest.
- Chilean mine recovery trajectory: Determines whether the genuine supply loss persists or eases.
- China’s inventory accumulation pace: Signals whether the hidden oil demand floor holds or reverses.
Watch those three, and you can tell a structural correction from a policy-driven reversal before the next move lands.
This article is for informational purposes only and should not be considered financial advice. Investors should conduct their own research and consult with financial professionals before making investment decisions.
Past performance does not guarantee future results. Financial projections are subject to market conditions and various risk factors, and forward-looking scenarios described here are speculative and subject to change based on market developments.