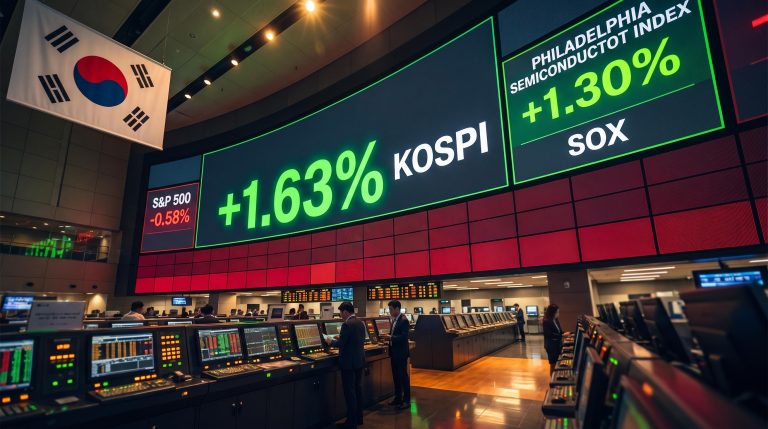
The 10-year Treasury yield just pressed against a resistance level it has not seriously tested since late 2023, and two inflation reports due this week will decide whether it holds or breaks toward 5%. For equity investors, the stakes are lopsided: a soft print gives markets room to breathe, while a hot one could reprice the entire near-term outlook before the Federal Reserve even walks into its September meeting.
Here is where the numbers sit right now. Headline consumer price inflation is running at 3.4% year-over-year, producer prices at 4.7%, and the 10-year yield hovers around 4.80%, just above the 4.809% technical line that analysts have flagged as the divide between quiet consolidation and a run toward 5.021%. The Federal Open Market Committee (FOMC) meets the following week, which makes this week’s data doubly consequential for how inflation data moves equity markets.
This piece traces the specific chain of events that connects Thursday’s producer price number and Friday’s consumer price number to the value of the stocks in your portfolio. Once you can see the mechanism, you will know how to read each scenario as it unfolds.
The macro setup heading into two high-stakes data prints
Start with what is already on the table, because the numbers in hand are not reassuring on their own. Headline Consumer Price Index (CPI), the measure of what US households pay for goods and services, rose 0.1% month-over-month and 3.4% year-over-year in July 2026, according to the Bureau of Labor Statistics release on 12 August 2026. Core CPI, which strips out volatile food and energy, sat at 2.5% annually.
The producer side tells a hotter story. The Producer Price Index (PPI), which tracks prices at the wholesale and factory-gate level before they reach the shelf, ran at 4.7% year-over-year in July, per the BLS report of 13 August 2026, even though it was unchanged on the month.
Here is why that gap between PPI at 4.7% and CPI at 3.4% matters to you. Upstream cost pressures embedded in producer prices have historically fed through to consumer prices with a lag, which tells you the inflation pipeline has not cleared. Investors heading into this week’s prints cannot assume the trend is already settled.
The month’s PPI components split cleanly:
- Final demand services rose 0.2% on the month.
- Final demand goods fell 0.7% on the month.
| Metric | Most Recent Value | Reference Period | Fed Target |
|---|---|---|---|
| Headline CPI (YoY) | +3.4% | July 2026 | 2% |
| Core CPI (YoY) | +2.5% | July 2026 | 2% |
| PPI Final Demand (YoY) | +4.7% | July 2026 | 2% |
| PPI Final Demand (MoM) | Unchanged | July 2026 | 2% |
The August PPI reading is scheduled for the middle of this week and the August CPI for Friday, 11 September 2026, at 8:30 a.m. ET. The Fed has held its funds target at 3.50%-3.75% across its March, June, and July 2026 meetings, so with policy frozen, each data point carries more weight. A shortened, three-session trading week compresses that impact further: less time to absorb the numbers means each print lands with more force.
The current policy backdrop inherits a split Fed committee that was already divided 9-9 between hold and hike factions heading into the summer, which means this week’s prints do not just inform the September meeting but land into an internal FOMC debate where a single hot number could tip the balance before the vote.
The FOMC July 2026 meeting minutes confirm the Committee held the federal funds target at 3.50%-3.75%, a decision that placed the full weight of market repricing on incoming inflation data rather than on any active policy adjustment.
When big ASX news breaks, our subscribers know first
Why does a Treasury yield near 4.8% matter so much?
You already know yields are rising. What matters is the mechanism behind why that is a problem for stocks, and which stocks bear the most of it.
Start with the discount rate. When you value a company, you translate its future earnings into what they are worth today, and the rate you use for that translation is anchored to the 10-year Treasury yield, the return on lending money to the US government for a decade. As that yield climbs, the value of those future earnings shrinks, which compresses the price-to-earnings multiple investors are willing to pay.
Not every stock feels this equally. Long-duration equities, meaning technology and high-growth names whose value sits mostly in distant future earnings, are the most sensitive to yield moves. Value stocks, financials, and energy are more resilient, and some can actually benefit when the yield curve steepens.
The discount-rate channel works mechanically: the IMF has estimated that a 100 basis point increase in global long-term real rates lowers the equilibrium price-to-earnings ratio of advanced-economy indices by 10-15%, even when underlying earnings are unchanged, which is precisely why the yield level matters as much as the direction of travel.
Where does the yield sit today? As of 7-8 September 2026, the 10-year traded at roughly 4.779%-4.802%, per the Wall Street Journal, CNBC, and TradingEconomics. It touched an intraday high of 4.818% around 1-2 September 2026, its highest level since late 2023, and its 52-week range runs 3.95%-4.81%, according to Yahoo Finance.
The fragility of the current equilibrium showed on 3 September 2026, when Fed Governor Christopher Waller signalled support for no rate hike and the 10-year slipped to about 4.77%.
When a single Fed governor’s comment can move the 10-year by several basis points, it tells you how thin the current balance is. The yield level matters, but the speed and cause of any further move will matter more for your portfolio.
The technical levels investors are watching
Technical analysis of the current chart identifies 4.809% as the resistance the yield keeps testing, with 5.021% as the next target if it breaks. Those are not arbitrary figures. The 5.021% level corresponds to a pivot from the October and November 2023 yield spike, when the 10-year last surged toward 5%, so the market is using that episode as its reference point.
The setup looks technically credible rather than speculative. According to that analysis, the yield has printed five consecutive green candles, and recent trading has consolidated in a tight bullish pattern just under resistance.
For the equity side of the ledger, the same analysis puts SPY support at $760.40, the prior all-time high pivot, and resistance near $772.10 along a declining trend line. If yields push higher, a move toward that lower support becomes more likely.
How the inflation-to-yield-to-equity chain reaction actually works
Follow the transmission as three distinct links, and the equity conclusion arrives on its own logic rather than as something you are asked to accept.
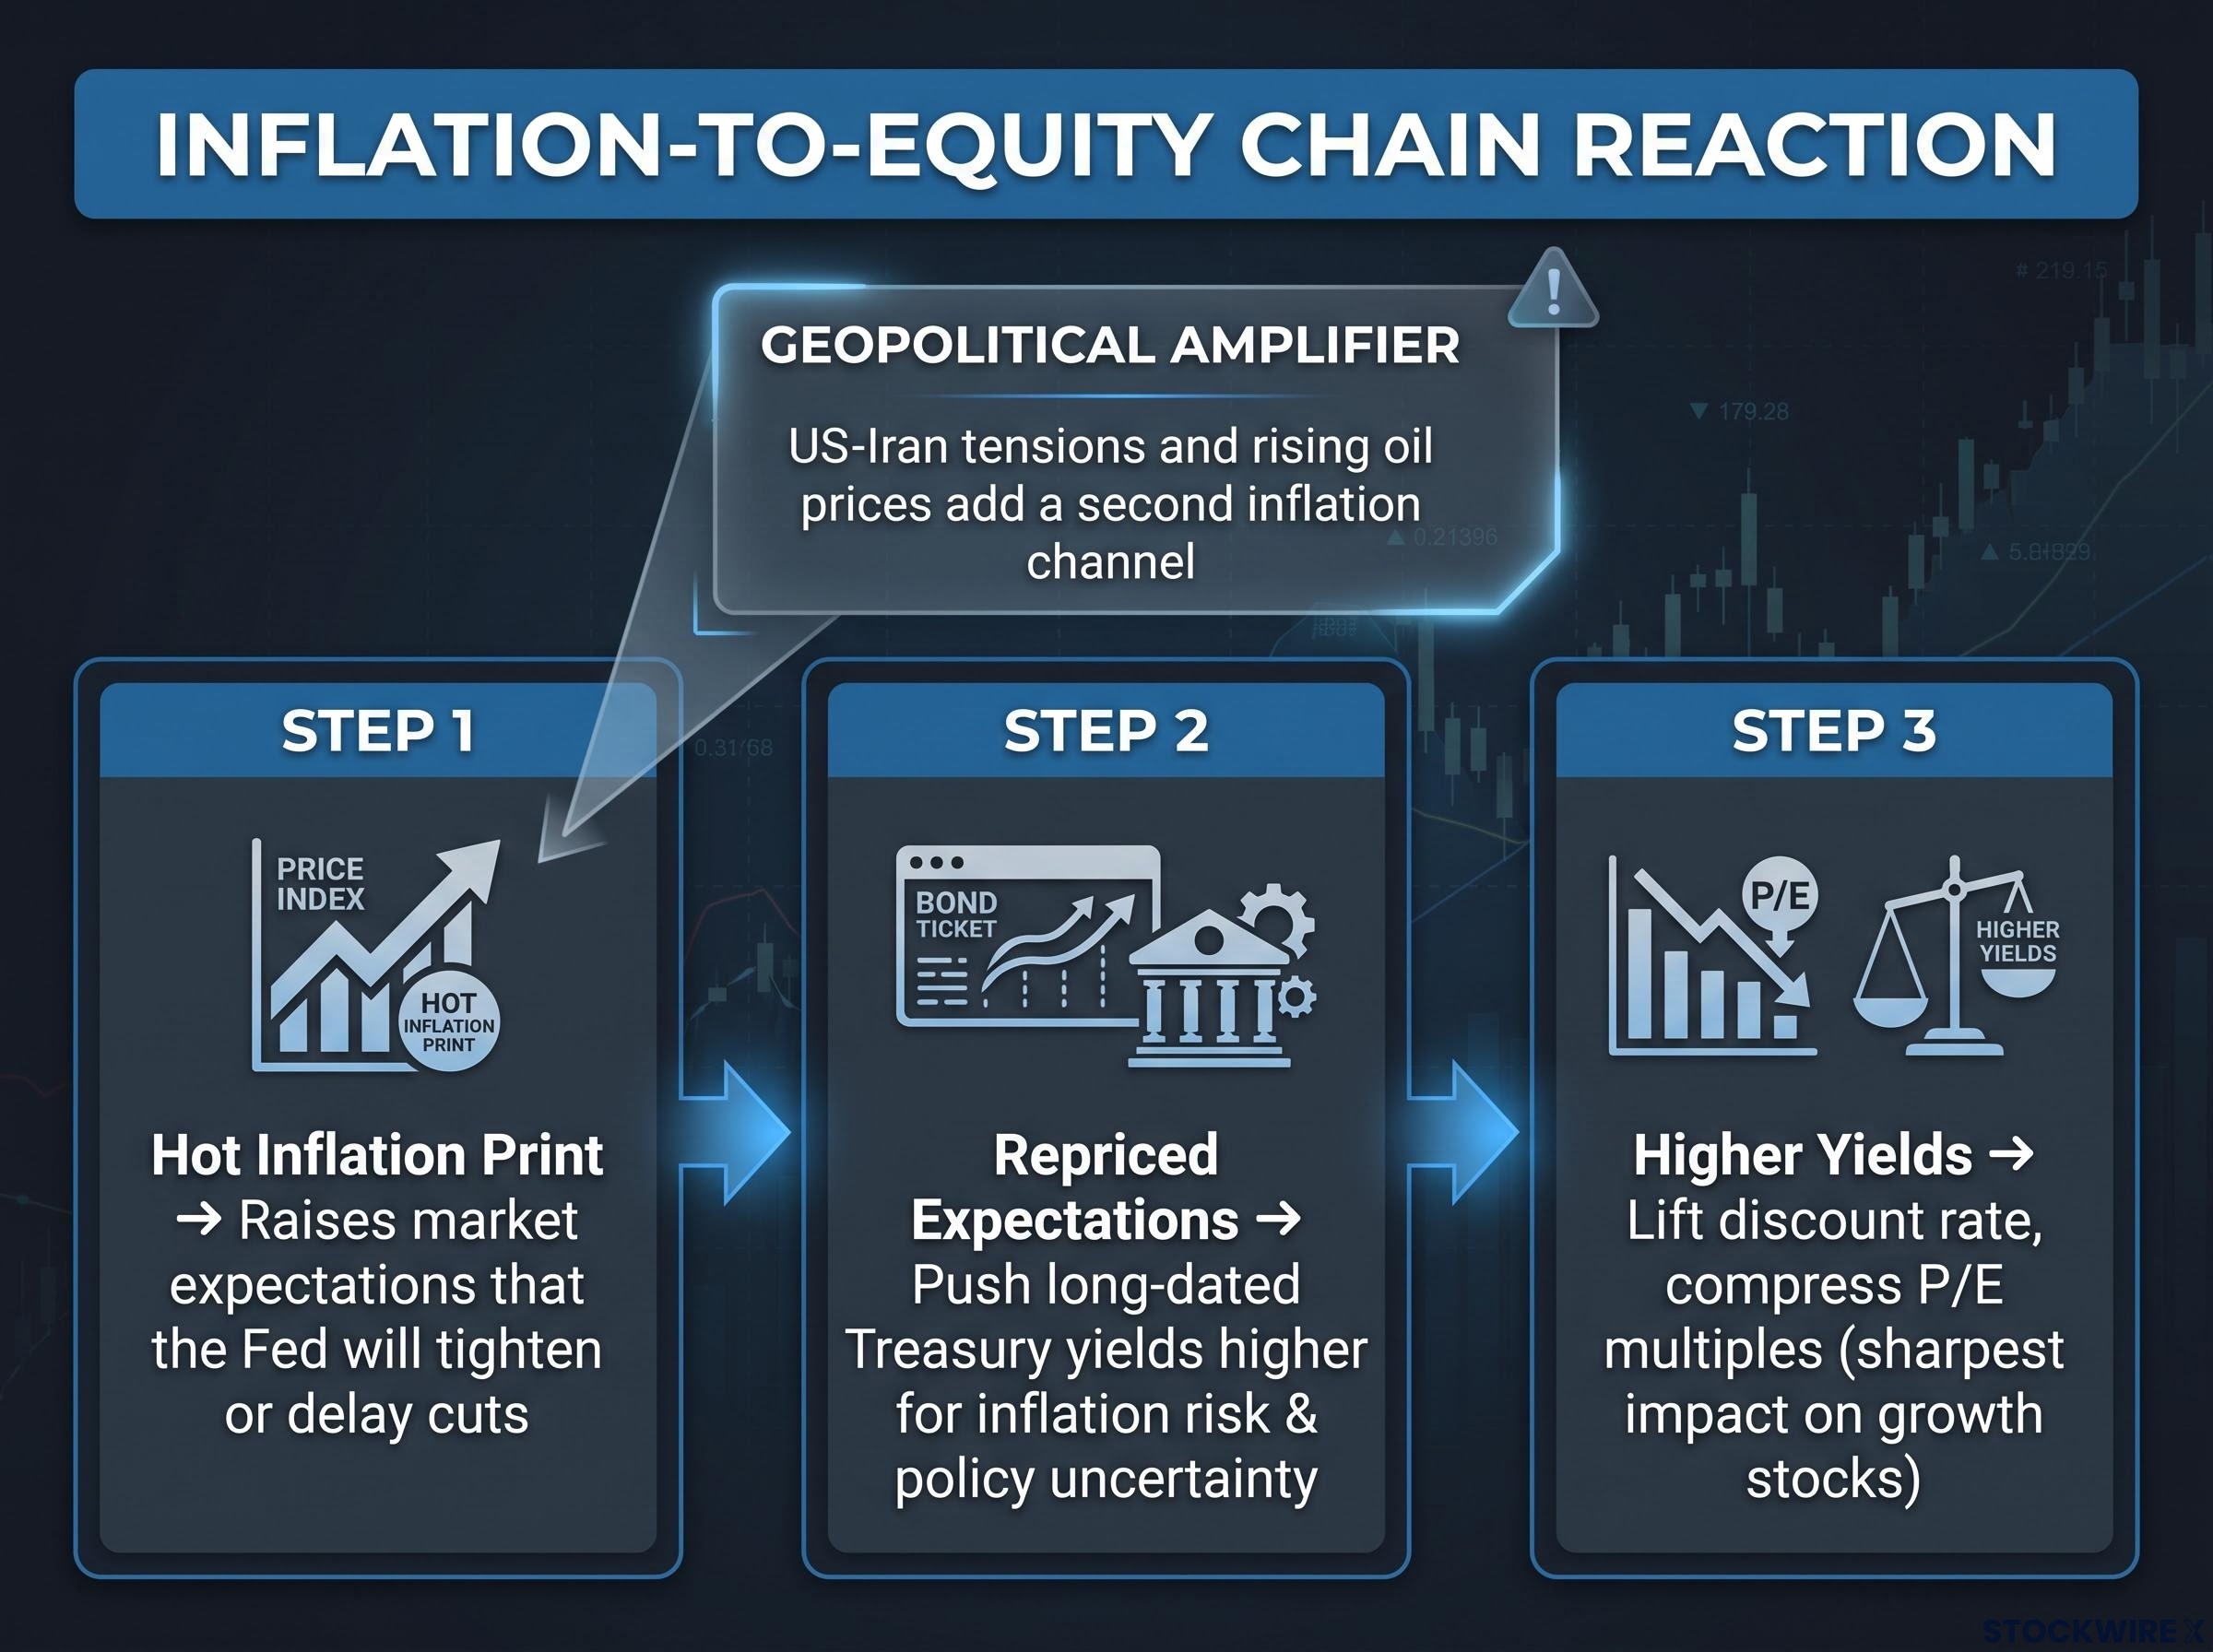
- A hot inflation print raises market expectations that the Fed will tighten or delay cuts. When CPI or PPI surprises to the upside, investors reprice the odds of Fed action almost immediately.
- Those repriced expectations push long-dated Treasury yields higher, because investors demand extra compensation for inflation risk and policy uncertainty.
- Higher yields lift the discount rate inside equity valuation models, compressing price-to-earnings multiples, most sharply for the growth stocks whose value sits furthest in the future.
There is a geopolitical amplifier layered on top this time. US-Iran tensions and rising oil prices have added a second inflation channel on top of the domestic CPI and PPI dynamic. After US-Iran strikes pushed oil higher, markets increased their bets on a rate hike, and the 10-year climbed toward its 4.818% high, making this setup more volatile than a routine data week.
The chain is not automatic, and one episode proves it.
On 10 June 2026, the CPI headline came in at its hottest in three years, yet the 10-year yield held near 4.548% and equities did not de-rate sharply, because the core and underlying detail was judged as manageable.
That June episode is the one to remember. Whether the market reads Friday’s CPI as alarming depends not just on the headline number but on what the components underneath it say about the Fed’s actual policy path.
The headline versus core divergence is the diagnostic lens the June 2026 episode proved essential: a 1.3 percentage-point gap between headline and core CPI in May confirmed an energy-driven uptick rather than a demand-fuelled spiral running through goods and services, which is exactly why the market did not de-rate sharply despite a headline well above target.
The stakes show in the tape already. On the current reference session, SPY fell roughly 0.55%, opening with a downside gap and never turning positive as Middle East tension and oil pressure weighed on sentiment. As a prior snapshot, the CME FedWatch tool put the probability of a Fed hold at 97.1% as of 13 June 2026, a figure that may have shifted since but still frames the market’s baseline expectation of no change.
Knowing which conditions trigger a full de-rating versus a contained response is what separates a measured reaction to data from either panic over a headline or dismissal of genuine risk.
What history says about equities when the 10-year approaches 5%
The current technical target of 5.021% is not a random level. It references October 2023, when the 10-year yield last approached or touched 5%, driven by stronger growth data, elevated inflation, and a rising term premium.
The equity response that autumn is the concrete before-and-after picture worth holding in mind. Long-duration growth sold off sharply as the yield spiked, capital rotated into value, financials, and energy, and the market eventually stabilised once earnings expectations held. The damage was real but uneven.
That leaves two competing views on whether yields near 5% genuinely threaten stocks today.
- The bearish view: yields near 5% reflect tighter financial conditions and threaten elevated equity multiples, a risk sharpened by how concentrated US indices are in mega-cap technology, the segment most sensitive to discount rate changes.
- The absorbed view: equities can co-exist with yields near 5% when earnings growth is robust, inflation expectations stay anchored, and the yield rise reflects real growth rather than inflation fear.
| Episode | Yield Move Type | Equity Sector Most Impacted | Key Moderating Factor |
|---|---|---|---|
| October 2023 | Rapid spike toward 5% | Long-duration growth | Earnings expectations held |
| 2013 Taper Tantrum | Surprise on Fed signalling | Broad risk assets | No actual rate hikes |
| 2018 Hiking Cycle | Gradual but persistent | Rate-sensitive sectors | Perceived over-tightening fear |
The 2013 Taper Tantrum and the 2018 hiking cycle add a lesson that cuts across both views. Both show that surprise policy shifts destabilise markets more than gradual, well-telegraphed yield moves tied to solid growth.
If this week’s prints surprise to the upside and the yield move accelerates, the 2023 playbook says your highest-growth holdings face the sharpest near-term pressure. That is not because the businesses changed, but because the maths of valuation did.
The three variables that determine whether yields at 5% are manageable
Three factors decided which view prevailed historically, and you can track each in real time this week:
- Speed: How fast did yields move? A rapid spike shocks valuations more than a gradual climb.
- Cause: What drove the move, real growth or inflation panic? Growth-driven yields are far more digestible.
- Earnings trajectory: Are forward earnings estimates rising or falling? If earnings keep pace with the discount rate, price damage is partly offset.
Reading this week’s data as it lands: a framework for the sessions ahead
You now have the mechanism. Here is the interpretive grid to carry into the prints so each number maps to a consequence you already understand.
| Scenario | CPI/PPI Outcome | Expected Yield Response | Likely Equity Impact |
|---|---|---|---|
| 1 | Both prints soft | Yields retreat | Broad rally, growth leads |
| 2 | Headline soft, core sticky | Limited move | Mixed, choppy |
| 3 | Headline hot, core benign | Muted (June template) | Contained reaction |
| 4 | Both prints hot | Breaks above 4.809% toward 5.021% | Growth under real pressure |
The scenario that matters most for your positioning is not the extreme hot or cold print. It is the ambiguous middle, scenario two, because that is where investor interpretation diverges and intraday volatility is hardest to read.
The FOMC meeting the following week is a second-order factor you should not ignore. Even a benign data week leaves uncertainty elevated while the Fed meeting looms, which argues against over-interpreting any single day’s price action. Governor Waller’s stated preference for holding steady sets the baseline expectation entering the week, consistent with that prior 97.1% hold probability.
Sector positioning shapes how each scenario hits you:
- If you are tilted toward financials, energy, or value, you are better insulated across every scenario.
- If you are concentrated in long-duration growth, you carry the most exposure to a scenario-four break.
- The broad market sits in between, with SPY likely to trade its $760.40 support to $772.10 resistance band as the data reaction plays out.
With this framework, each number that crosses the wire maps to a consequence rather than to noise, which lets you respond deliberately instead of chasing the price move.
What the data will tell you, and what to watch after it does
Step back and the core insight is simple. Inflation data matters not for the number itself but for what it implies about the Fed’s next move, and that implication drives the discount rate embedded in every stock you own.
The most actionable signal this week is not the headline print. It is where the 10-year yield settles after the release, specifically whether it holds above or below 4.809%. That level, and the 5.021% target beyond it, are the markers that tell you which scenario the market has chosen.
The June episode makes the case one final time: a hot headline did not move the yield, because the detail underneath it was manageable. The number alone is an unreliable guide, but what the market does with the yield afterward is the actual verdict.
When Friday’s CPI drops, do not watch the headline. Watch where the 10-year yield settles an hour later, because that is the market’s read on what the number means for policy, and policy is what drives equity prices from here.
The September FOMC meeting the following week is the event that will confirm or deny what this week’s data implies, so treat the prints as the setup and the Fed decision as the confirmation.
Investors wanting the full strategic picture beyond this week’s prints will find our deep-dive into the H2 2026 stock market outlook, which maps the directional consensus from Goldman Sachs, Bank of America, BlackRock, and JPMorgan onto specific sector positioning recommendations across energy, financials, and long-duration growth.
This article is for informational purposes only and should not be considered financial advice. Investors should conduct their own research and consult with financial professionals before making investment decisions. Past performance does not guarantee future results. Financial projections are subject to market conditions and various risk factors.